
Chapter 10
Using Fields and Tables
Adding text to a set of drawings can become a large part of your work. You’ll find that you’re editing notes and labels almost as frequently as you’re editing the graphics in your drawings. To make some of those editing tasks easier, AutoCAD provides a few special text objects.
In this chapter, you’ll look at fields and tables, two features that can help automate some of the common tasks in AutoCAD. Fields are a special type of text that can automatically update to reflect changes in a drawing. The Table feature helps to automate the process of creating and editing tables and schedules. Tables are a common part of technical drawings and are similar to spreadsheets. In fact, AutoCAD tables behave much like spreadsheets, giving you the ability to add formulas to cells.
In this chapter, you’ll learn to do the following:
- Use fields to associate text with drawing properties
- Add tables to your drawing
- Edit the table line work
- Add formulas to cells
- Export tables
Using Fields to Associate Text with Drawing Properties
The text labels you worked with in Chapter 9, “Adding Text to Drawings,” are static and don’t change unless you edit them by using the tools described there. Another type of text object, called a field, behaves in a more dynamic way than the multiline text. A field can be linked to the properties of other objects and updates itself automatically as the associated properties change. For example, you can create a field that is associated with a block name. If the block name changes, the field text automatically changes as well.
Try the following exercise to see how this works:
1. Open the 10c-unit.dwg file. This file is similar to the drawing you worked on in Chapter 9. (10c-unit.dwg can be downloaded from www.sybex.com/go/masteringautocadmac.)
2. Double-click the Kitchen text to highlight it and make it available for editing.
3. Right-click the highlighted Kitchen text, and then choose Insert Field to open the Insert Field dialog box (Figure 10-1). A list on the left shows the types of fields available.
Figure 10-1:Choose the field to insert.
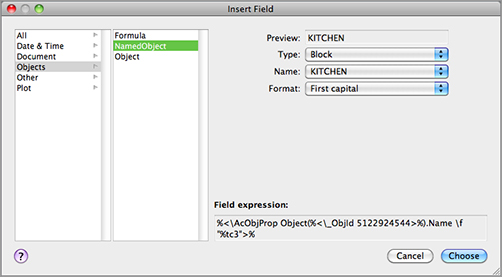
4. In the Field Category list (left column), select Objects. This limits the display of field types to object fields.
5. In the Field Names list (right column), select NamedObject.
6. Make sure Block is selected in the Type pop-up menu on the right side of the dialog box, and for the Name pop-up menu, select Kitchen. This associates the field with the Kitchen block name.
7. In the Format pop-up menu, select First Capital. This causes the field text to be lowercase with a capital first letter, regardless of how the block name is actually treated. It will work only when more than one word is present in the name; e.g., Large Kitchen). Your settings should look like Figure 10-1.
8. Click Choose to exit the Insert Field dialog box, and then press ↵ twice to return to the Command prompt.
When you return to the drawing, the text appears with a gray background. This tells you that the text is a field rather than an Mtext or Text object. The gray background is just a device to help you keep track of field text; it doesn’t print.
You’ve converted existing text into a field that is linked to a block name. Now you’ll see how the field works:
1. Enter REN↵ at the Command prompt to open the Rename dialog box.
2. Make sure Blocks is selected in the Named Objects list, and then select Kitchen from the Items list.
3. Double-click to edit the name. Type Kitchenette.
4. Click OK to close the Rename dialog box.
5. Type RE↵ to regenerate the drawing. The field you created changes to reflect the new block name.
Fields can be associated with a wide variety of properties. You’ve just seen how a block name can be associated with a field. In this exercise, you’ll use a field to display the area of an object:
1. Click View Zoom Extents from the menu bar or type Z↵ E↵ to view the entire plan.
2. Place a rectangle in the living room area so that it fills the area, as in Figure 10-2.
Figure 10-2:Place a rectangle that fills the living room.
3. Double-click the Living Room text to open the Text Editor visor and the in-place text editor.
4. Highlight the text that reads 230 square feet. Right-click the selected text, and choose Insert Field from the shortcut menu.
5. In the Insert Field dialog box, select Objects from the Field Category list. In the Field Names list, select Object.
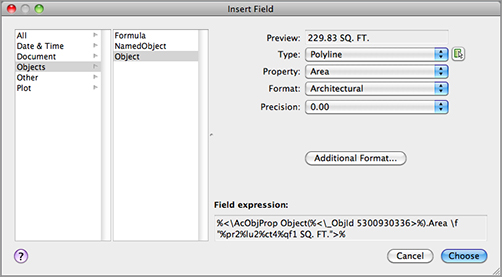
6. Click the Select Object button next to the Type pop-up menu at the top of the Insert Field dialog box (Figure 10-3). The Insert Field dialog box momentarily closes to enable you to select an object.
7. Select the rectangle you just added. The Insert Field dialog box returns.
8. In the Property pop-up menu, just below the Type pop-up menu, select Area.
9. Select Architectural from the Format pop-up menu. In the Precision pop-up menu, select 0.00 (see Figure 10-3).
10. Click Choose. The field you just added appears in the drawing as the area of the rectangle.
11. Click Save in the Text Editor visor.
Figure 10-3:Click the Select Object button.
Next you’ll alter the rectangle to see how it affects the field:
1. Click the rectangle to expose its grips (Figure 10-4). Then select the top middle grip of the rectangle, and move it upward so the top edge aligns with the bathroom wall.
Figure 10-4:Expose the grips.

2. Clear the selected objects and then type RE↵. The field you just added updates to reflect the new area of the rectangle.
3. After reviewing the results, close the 10c-unit.dwg file.
In previous exercises, you changed existing text into fields. You can create new fields in either the Text or Mtext command by selecting Insert Field from the shortcut menu whenever you’re typing the text content.
In this exercise you used a rectangle, but you can use any closed polyline to create an area field.
You’ve touched on just two of the many possible uses for fields. You can associate other types of properties, including the current layer, the drawing name, linetypes, and more. Fields can also be used in AutoCAD’s Table feature, described in the next section, which enables you to create tables and schedules quickly.
For most of your work, the standard text objects will work just fine, but you may find fields useful when you know a label has to be associated with specific types of data in your drawing. In later chapters, you’ll have more opportunities to work with fields.
One of the most common text-related tasks you’ll do for your drawings is to create schedules, such as door and window schedules or parts schedules. Such schedules are tables used to provide detailed information regarding the elements in your design.
You can use tables to help you generate schedules more quickly. Tables allow you to format the columns and rows of text automatically, similar to formatting in spreadsheet programs.
Creating a Table
The first step in creating a table is to determine the number of rows and columns you want. Don’t worry if you aren’t certain of the exact number of rows and columns; you can add or subtract them at any time. In this exercise, you’ll create a table that contains 12 rows and 9 columns, as shown in Figure 10-5.
Figure 10-5:A sample table created with the Table tool

Start by creating the basic table layout:
1. Click File New from the menu bar, or press F-N. Use the standard acad.dwt drawing template.
2. Click on the Tool Sets button and select Annotation (Figure 10-6).
Figure 10-6:The Tool Sets button on the Workflow toolbar

3. Click on the Table tool on the Tool Sets palette. You can also choose Draw Table from the menu bar or type TB↵.
4. At the Specify first corner: prompt, type 8.453 and press the Tab key. Now type 21.815 and press ↵.
5. At the Specify second corner: prompt, type 30.953 and press the Tab key. Now type 17.402 and press ↵.
6. The table is drawn with 9 columns and 12 rows and the cursor in the top cell. You also see the Text Editor visor (Figure 10-7).
Figure 10-7:The drawn table

7. Enter Room Finish Schedule and press ↵. The cursor moves to the next cell.
8. Click Save on the Text Editor visor.
Adding Cell Text
You’ve just created a table and added a title. Now let’s start to add some more text to the table:
1. Adjust your view so the table fills most of the drawing area.
2. Double-click in the first cell at the top left, just below the Room Finish Schedule label (see Figure 10-8). The cell turns gray, and the Text Editor visor appears. You also see labels across the top and left side showing the row and column addresses.
3. Enter Number for the room number column at the far left, and then press the Tab key to advance to the next cell to the right.
4. Enter Room, and press the Tab key again.
Figure 10-8:Double-click the cell shown selected here.

5. Enter Finish, and press the Tab key four times to advance four columns. You do this because the Finish heading (refer back to Figure 10-5) will have four columns under it: Floor, Base, Wall, and Ceiling. In the next exercise, you’ll learn how to format those four columns under the single heading.
6. Enter Ceiling Ht., and press the Tab key again.
7. Enter Area, press the Tab key, and enter Remarks.
8. Click Save in the Text Editor visor.
You have the column headings in place. Now you need to do a little extra formatting. In step 5, you left four cells blank because four of the columns will be combined under one heading: the Finish heading covers the Floor, Base, Wall, and Ceiling columns. Next you’ll combine the blank cells with the Finish heading:
1. Click in the center of Finish label’s cell to select it.
2. Click in the third cell to the right of the Finish cell to select all four cells (Figure 10-9).
Figure 10-9:Select a group of four cells.

3. On the Table Cell visor, select the Merge Cells flyout and then choose Merge All from the drop-down list. The four selected cells merge into a single cell with the word Finish.
Now you need to add the subheads under the Finish header:
1. Double-click in the leftmost cell below the Finish cell. The Text Editor visor appears (Figure 10-10).
Figure 10-10:Double-click this cell and the Text Editor visor appears.
2. Enter Floor, and press the Tab key.
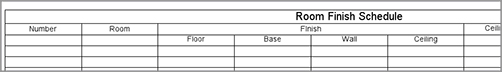
3. Enter Base, Wall, and Ceiling, respectively, in the following three columns. Remember that the Tab key advances you to the next cell to the right. Your table should look like Figure 10-11.
Figure 10-11:The table so far
4. Click Save in the Text Editor visor.
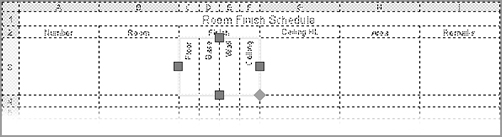
Adjusting Table Text Orientation and Location
You now have the basic layout of the table, with one difference. The Floor, Base, Wall, and Ceiling labels you just added are oriented horizontally, but you want them oriented vertically, as in Figure 10-5. The following steps will show you how to rotate a set of labels in a table so they appear in the orientation you want:
1. Click the cell labeled Floor to select it. The Table Cell palette appears.
2. Click in the cell labeled Ceiling to select all four of the cells below the Finish heading. The combined cells have four grips, one on each side of the group.

3. Click the grip at the bottom of the selected group, and move it down about four rows. Click to “fix” the row height in place. The entire row becomes taller. This provides room for the text when you rotate it.
4. In the Properties Inspector palette, click the Text Rotation input box under the Content category.

5. Enter 90↵ for a 90-degree rotation of the text. The text rotates into a vertical orientation. You can also use the circular slider located to the right of the text input box to set the rotation.
With the text in this orientation, the columns are too wide, so you’ll change the cell width for the selected cells.
6. Move the right grip to the left to decrease the width of the cells.
7. For the final touch, you’ll center the text in the cells. In the Properties Inspector palette, click the Bottom Center tool next to Alignment under the Cell category. The text becomes centered in the cells and aligned at the bottom of the cells.

In the last exercise, you learned how you can adjust the text orientation through the Properties Inspector palette. You can also use it to adjust the width of cells. If you prefer, you can adjust the width of multiple cells by adjusting the grip location of selected cells.
Now continue to add text to the cells and adjust their sizes:
1. Double-click in the cell in the Number column just below the row that contains the Floor, Base, Wall, and Ceiling cells. A text cursor appears in the cell, and the Text Editor visor appears.
2. Enter 110, and press ↵. Instead of advancing to the next cell to the right, you advance to the next cell below.
3. Enter 111, and press ↵ again. Continue to enter each room number in this way until you reach room number 117. When you’ve finished entering the room numbers, click Save in the Text Editor visor.
Next you’ll reduce the width of the column to fit the text a bit better.
4. Click in the cell with the Number text label. It’s the first column heading in the table.
5. Click in the bottom cell of the Number column to select the entire column.
6. Click the grip to the left of the column, and move the grip to the right so the column width is approximately half the width of the Room column. You can zoom in on the column to allow more control over the positioning of the grip.
7. Press Esc to exit the selection and view your table so far (Figure 10-12).
Auto-Filling Cells
In the previous exercise, you may have noticed that the room numbers were sequential. There is a time-saver that will allow you to auto-fill values. Follow these steps:
1. Type the number in the cell and press ↵.
2. Reclick in the cell to show the grips.
3. On the lower-right corner is a lighter-colored diamond grip. This is the auto-fill grip.
4. Click the diamond grip and drag downward. You will see a tooltip showing the incremented number.
5. When the tool tip displays 117, click again.
6. The numbers are automatically shown incremented.
Auto-fill will work in a horizontal or vertical configuration.
Figure 10-12:The table with the columns resized
Now, suppose you want to delete the extra row of cells at the bottom of the table or add a new row. Here’s what to do:
1. Click the bottom-left cell of the table to select it.
2. Select the Delete Row tool in the Table Cell visor. The row disappears.
3. To add a row, select a cell, and click either the Insert Row Above or Insert Row Below tool, depending on where you want the new row.
You may also notice the Insert Column Left, Insert Column Right, and Delete Column options in the Table Cell visor. These tools let you add or delete columns. These options function in a way that’s similar to how the Delete Row and Insert Row options function.
So far, you’ve concentrated on how you can format text and cells in a table, but you’ll also want some control over the lines in the table. Typically, heavier lines are used around the border of the table and between the title and the rest of the table.
The Border Style option lets you modify the outline of the border. When you select this option, the Cell Border Properties dialog box opens (Figure 10-13).
You can use this dialog box to fine-tune the appearance of the line work of the table. Try the following exercise to see firsthand how this dialog box works:
1. Turn on the display of line weights by clicking on the Show/Hide Lineweights tool on the Status Bar palette.
2. Click in the title cell at the top of the table to select the cell, and then in the Properties Inspector palette, choose Border Style in the Cell category to open the Cell Border Properties dialog box shown on Figure 10-13.
Figure 10-13:Setting border properties

3. Click the Lineweight pop-up list, and select 0.30 mm.
4. Click the Outside Borders button that appears just above the preview to change the borders of the cell to the selected line weight (Figure 10-14).
5. Click OK. The title cell is now outlined in a heavier line. To see it clearly, press the Esc key.
Figure 10-14:Click to display outside borders.

You can also adjust the line weights that encircle a group of cells, as in the following exercise:
1. Click the Number cell (in the upper-left corner).
2. Click the cell in the lower-right corner of the table so that all the cells from the second-from-the-top row down are selected.
3. In the Properties Inspector palette, choose Border Style in the Cell category to open the Cell Border Properties dialog box.
4. Select 0.30 mm from the Lineweight pop-up list. Then click the Outside Borders button as you did in step 4 of the previous exercise.
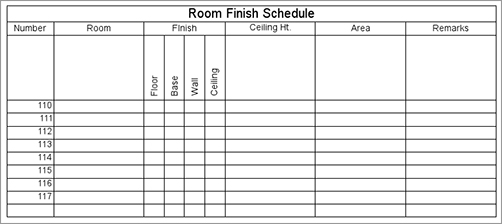
5. Click OK and press Esc. The outlines of the selected cells are given the new line weight setting (Figure 10-15).
6. Save this file as Room Finish Schedule.dwg for future reference.
Figure 10-15:The updated borders

Changing the Background Color
In addition to the table borders, you can change the background color for the cells of the table through the Background Fill drop-down list in the Properties Inspector palette.
The Cell Border Properties dialog box also lets you set the line colors by selecting a color from the Color pop-up menu. In addition, there are several buttons around the preview panel (Figure 10-16) that let you select the lines that are affected by the Cell Border Properties settings.
You can also use the preview to select individual borders by clicking the sample border in the preview panel. The sample changes to show you which border lines are affected.
Figure 10-16:Setting the borders that will be affected
In the beginning of this chapter, I mentioned that you can include formulas in table cells. This can be a great timesaver because you can set up a table with quantities that automatically adjust to changes in values in the table. You don’t have to calculate the changes manually.
You may recall that formulas are actually a type of field and that a field can be linked with objects in a drawing so that the field displays the linked object’s properties. The formula field can be linked to several numeric text values.
Although fields are the tools you use for formulas, you don’t have to choose consciously to add a field to a cell every time you want to add a formula. The exercise in the following section will demonstrate how you can add a formula by typing directly in a cell. AutoCAD takes care of converting your input into a field.
Using Formulas Directly in Cells
The simplest way to add a formula to a cell is to double-click the cell and then, when the Text Editor visor appears, enter the formula directly in the cell with the addition of an equal sign (=) at the beginning. Try the following exercise to see how it works:
1. Open the FieldSample.dwg file, which can be found on the book’s companion website.
2. Double-click in the cell, as shown in Figure 10-17, to select the location for your formula.
Figure 10-17:Selecting the cell for your formula
3. Enter =A2+D4 in the cell to add the values in cell A2 and cell D4.
4. Press ↵ after you enter the formula. The value of A2 plus D4 appears in the cell (Figure 10-18).
Figure 10-18:A cell showing the sum of two other cells

In step 3, the equal sign tells AutoCAD to convert the text into a formula field. You may have noticed that when you start to edit a cell in a table, the row and column labels appear along the top and left side of the table. You can use these labels to determine the cell addresses for your formula.
In typical spreadsheet fashion, you can change the formula in a cell at any time. Double-click the cell containing the formula, and then edit the formula values and operators.
When a table cell is selected, you can also use the Formula drop-down list from the Table Cell visor to select from a set of predefined math operations (Figure 10-19).
Figure 10-19:The Formula drop-down list on the Table Cell visor
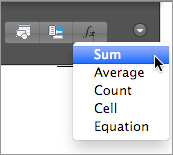
Click in the cell where you want to place the formula; then, in the Table Cell visor, click the Formula drop-down list. A list opens; select the operation you want to use. Next, place a selection window around the cells you want to include in the formula. Click in the first cell that you want to include in the formula, and then click in the second cell. As you do this, a selection window appears. All the cells that are included in the selection window are included in the formula.
Using Other Math Operations
In the previous exercise, you used the plus sign to add the value of two cells. You can string together several cells’ addresses to add multiple cells, as follows:
=A2+A3+A4...
You can also subtract, multiply, or divide by using the – (subtract or minus), * (multiply or asterisk), or / (divide or slash) sign. To perform multiple operations on several cells, you can group operations within parentheses in a way similar to how you would in a typical spreadsheet formula. For example, if you want to add two cells together and then multiply their sum by another cell’s value, use the following format:
=(A2+A3)*A4
The Average, Sum, and Count options that appear in the Formula drop-down list on the Table Cell visor give you quick access to these frequently used functions. You can add to a cell the average value of a set of cells, the sum of a set of cells, or the count of the number of cells. When you click one of these options after selecting a cell, you’re prompted to select several cells with a selection window. Once you’ve selected a set of cells, you see the appropriate formula in the selected cells. Clicking the Average option, for example, produces a formula similar to the following:
=Average(A1:B5)
Clicking the Sum option produces a formula like the following:
=Sum(A1:B5)
In both cases, a range of cells is indicated by a colon, as in A1:B5. You can use this format when entering formulas manually. You can also include a formula in a single cell with a range by using a comma, as in B5,C6:
=Sum(A1:B5,C6)
Some day, you might want to export your AutoCAD table to a spreadsheet program or database. Follow these steps:
1. Select the table. The entire table is highlighted and the Table visor opens.
2. Click the Export tool on the Table visor. The Export Data dialog box opens.
3. Specify a name and location for your exported table data, and click Save.
The file is saved with a .csv filename extension. This type of file is a comma-delimited file and can be read by most spreadsheet programs, including Microsoft Excel. Unfortunately, the CSV file doesn’t retain the AutoCAD table formatting.
To open the exported file from Microsoft Excel, choose File Open in the Excel menu bar (or press F-O); then, in the Open dialog box, select All Files in the Files Of Type pop-up menu. You can then locate the exported table and open it.
Adding Graphics to Table Cells
One of the most interesting features of the Table tool is its ability to include blocks in a cell. This can be useful if you want to include graphic elements in your table. Adding a block to a cell is a simple process. Here are the steps:
1. Click in a cell to select it.
2. On the Table Cell visor, click the Insert Block tool. The Insert Block In Table Cell dialog box opens.

3. Select a block name from the Name drop-down list. You can also click the Browse button to the right of the list to open the Select Drawing File dialog box that enables you to select a drawing file for import to the cell.
4. After you’ve selected a block and specified the settings in the Properties group of the dialog box, click OK. The block appears in the cell you’ve selected.
The Properties Inspector palette enables you to specify the alignment and size of the inserted block. By default, the Auto-Fit option under the Blocks In Cell category is turned on. This option adjusts the size of the block to make it fit in the current cell size.
Use fields to associate text with drawing properties. Fields are a special type of text object that can be linked to object properties. They can help to automate certain text-related tasks.
Master It Name two uses for fields that you learned about in the first part of this chapter.
Add tables to your drawing. The Tables feature can help you make quick work of schedules and other tabular data that you want to include in a drawing.
Master It What is the name of the visor that appears when you click the Table tool?
Edit the table line work. Because tables include line work to delineate their different cells, AutoCAD gives you control over table borders and lines.
Master It How do you get to the Cell Border Properties dialog box?
Add formulas to cells. Tables can function like spreadsheets by allowing you to add formulas to cells.
Master It What type of text object lets you add formulas to cells?
Export tables. The Table feature allows you to export the text from a table to a CSV file that can be imported into a Microsoft Excel spreadsheet.
Master It Describe how to export a table from AutoCAD into an Excel spreadsheet.