Force 1: Investment. This is an issue with any function, but it is particularly important for the human resources function. Deciding approximately how much to spend on employees is a very strategic issue that deserves much attention. Spending too little or too much can be disastrous. Five options are possible for the investment level.
3
SET THE PROPER INVESTMENT LEVEL
Establishing the Appropriate Amount to Spend on Human Capital
One of the most critical strategic issues facing the CHRO is determining the appropriate investment level for human resources. How much you should spend on your employees is a fundamental issue, yet in practice, it doesn’t receive enough attention. While some CHROs use benchmarking only—and maybe to a fault—other strategies may be appropriate. This chapter details five specific strategies for determining the investment level:
1. Let others do it. (Avoid the investment altogether.)
2. Invest the minimum. (Invest only what is absolutely necessary.)
3. Invest with the rest. (Use benchmarking to guide the appropriate investment.)
4. Invest until it hurts. (Spend too much on human resources either intentionally or unintentionally.)
5. Invest as long as there is a payoff. (Use a measurement system to understand the value of human capital compared with the investment.)
The majority, if not all, of organizations utilize one or more of these strategies. This chapter provides examples and information to help guide CHROs to determine which strategy will best fit their situation. Although the investment levels may be set initially, this is an issue that should be reviewed periodically.
Opening Stories
The retail industry, which represents one-fifth of American workers, struggles with the issue of how much to invest in employees. Typically, they invest the minimum: retail businesses set wages low and provide few benefits. Executives feel that they have no choice, because most of them compete on low prices. The assumption is that if they invest more in employees, customers will have to pay more, and they will lose business. These same executives conclude that employee-friendly stores like Wegmans and The Container Store can offer more pay and benefits because customers are willing to pay higher prices. But this is not always the case. Recent research has shown that there is an alternative to low pay and few benefits. Here are three examples.1
Costco
Costco is a wholesale club with more than 663 stores and $110 billion in annual sales. Costco employees earn about 40 percent more than those of its largest competitor, Sam’s Club. Annual turnover is 5.5 percent for employees who stay with Costco for more than a year. The average for the industry is more than 50 percent.
While dead-end jobs are the norm at most retailers, Costco provides advancement opportunities. About 98 percent of store managers started in the stores. The University of Michigan’s American Customer Satisfaction Index ranks Costco as high as Nordstrom, a retail chain known for its outstanding service. Costco’s rating is consistently above Sam’s Club.
Costco is simplifying their operations. For example, Costco has only four thousand SKUs (stock-keeping units), compared to a supermarket average of thirty-nine thousand. Costco also works hard to eliminate waste in their supply chain, such as by purchasing directly from manufacturers and moving goods to retail stores through their own efficient distribution process. The bottom line on these processes is that sales per employee per square foot at Costco is $986, about twice that of Sam’s Club at $588.
Trader Joe’s
Trader Joe’s is an American supermarket chain with 418 stores and $11.3 billion in annual sales. The starting wage for full-time employees is $40,000 to $60,000 per year, more than twice what competitors offer. All store managers are promoted from within, and many executives started in the stores. Turnover of full-time employees is less than 10 percent. Employees constantly engage customers in conversations and inform them about new products. They are known for suggesting products and recipes. Consumer Reports ranked Trader Joe’s the second best supermarket chain in the United States after Wegmans, which is also known for employee-friendly practices and not very low prices. As with Costco, simplification is key.
Trader Joe’s has only about four thousand SKUs and therefore offers fewer choices within categories than their rivals do. With fewer products, employees can be familiar with everything the store sells and make more knowledgeable recommendations to customers. Many perishable products are sold already packaged instead of loose, which speeds up checkout. Trader Joe’s purchases most products directly from manufacturers, and employees decide how many units of each item to order for their stores, with support from IT. The bottom line is that sales per labor hour are more than 40 percent higher than those of an average U.S. supermarket. Sales per square foot are more than three times those at an average supermarket.
Quiktrip
Quiktrip, a U.S. convenience store chain, has more than 600 stores and $11.45 billion in annual sales. The wages and benefits at Quiktrip are so good that the chain has been named one of Fortune’s “100 Best Companies to Work For” every year since 2003, including the most recent list in 2015.2 All store managers are promoted from within. Quiktrip’s 13.9 percent turnover rate among full-time employees is substantially lower than the 59 percent average rate in the top quartile of the convenience store industry. Customers get in and out of Quiktrip quickly because merchandise is always where it is supposed to be, and employees have been trained to ring up three customers per minute (often by not having to scan merchandise and by calculating change in their heads). Quiktrip only offers high-demand products.
Part-time employees receive 40 hours of training, and full-time employees receive two weeks of training in all aspects of the job, including ordering merchandise and sweeping floors. When customer traffic is high, employees focus on customer-related tasks; when traffic is low, they focus on other tasks. Employees can move from one store to another. Employees have more predictable schedules and are more productive, and customers get faster service. World-class manufacturing practices are applied to store operations. Every in-store logistic process is timed and standardized. Employee feedback is incorporated into process design and improvement. Employees regularly discuss problems and opportunities. While most retailers operate with fewer employees, Quiktrip does the opposite and maintains a force of floaters who can fill in for employees who get sick, take vacations, or have an emergency. The bottom line is that Quiktrip sales per labor hour are 66 percent higher than the average convenience store chain. Sales per square foot is $804 compared to $522 for the average convenience store chain.
These three examples show that retailers can avoid the tradeoff between low prices and investing in employees by implementing a set of operating practices that focus on simplifying processes, eliminating waste, cross training, enhancing jobs, and empowering employees. They can move beyond investing the minimum to investing when there is a payoff.
Let Others Do It
Some executives prefer to take a passive role when investing in employees, attempting to minimize the investment altogether. While somewhat dysfunctional, this approach has proven effective for some organizations, depending on their strategic focus. This section explores the strategy of avoiding the investment in human resources in detail, the forces behind it, and the consequences—both positive and negative—of implementing it.
Basic Strategy
This strategy can be implemented using two different approaches. The first approach is to use contract and temporary employees in place of permanent employees. This arrangement allows the organization to add and remove employees with little or no commitment, thus reducing the expense connected to employee acquisition, training, development, and termination. The second approach is to outsource the job, often at lower cost. Taken to the extreme, employers can outsource most of the functions that would be performed by regular employees in the organization.
Several factors motivate executives to pursue one or both of these approaches:
• The total cost of employees. Some executives cannot—or will not—build the infrastructure to support human capital.
• The need to bring stability to the organization. Expansion and decline can be particularly challenging in cyclical or seasonal industries. Letting others make the investment in people enables businesses to balance employment levels, address particular needs, and control costs at the same time.
• The unavailability of expertise in the organization. It may not be practical to develop the experience needed, so executives will take advantage of external expertise.
• Survival. Some executives cannot afford to invest in human capital, at least not to the extent needed to build a successful team.
Employee acquisition and maintenance is expensive. Table 3.1 shows the processes in which HR staff are involved. Because of the magnitude of these accumulated expenses, executives avoid some costs by hiring contract employees. This avoids costs associated with payroll, benefits, and terminations, as well as some acquisition and training costs. Contract employees should be ready to make an immediate contribution. Executives also outsource major functions to lower the total cost of employees. Most outsourcing providers offer services at a lower cost; however, their cost premiums can sometimes outweigh the savings of outsourcing.
• Recruiting
• Selection
• Indoctrination/orientation
• Socialization
• Initial job training
• Continuous development
• Career management
• Competitive pay and benefits
• Reward systems/motivation
• Maintenance/discipline
• Exit costs
Employing Temporary and Contract Workers
Because of the high cost of attracting and retaining employees, particularly in cyclical industries, some firms resort to employing contract workers. This is based on the belief that the nature of the employment cycle can create unnecessary expense when employees are being acquired and removed, creating turnover. Table 3.2 shows all the cost categories related to turnover. In recent years, departing costs have become significant as employers spend large amounts on severance packages and services to enable employees to find other jobs. Some experts suggest that the cost of turnover for critical talent is up to three times a person’s salary. Coupled with the high cost of attracting and developing employees, some organizations conclude that a highly capable contract employee is the best option, even for critical talent. For example, companies involved in exploration in the Alberta Oil Sands in Canada hire (and fire) contract workers as demand shifts, often driven by oil prices.
Table 3.2. Turnover cost categories.
|
Pre-employment training |
Exit costs |
|
• Development • Delivery • Materials • Facilities • Travel (if applicable) • Overhead (administration) |
• Administration time • Management time • Benefits termination/continuation • Pay continuation/severance • Unemployment tax • Legal expenses (if applicable) • Outplacement (if applicable) |
|
Orientation/on-boarding program |
Replacement costs |
|
• Development • Delivery • Materials • Facilities • Travel (if applicable) • Overhead (administration) |
• Recruitment/advertising • Recruitment expenses • Recruitment fees • Sign-up bonuses • Selection interviews • Testing/pre-employment examinations • Travel expenses • Moving expenses • Administrative time (not covered above) • Management time (not covered above) |
|
Initial training |
Consequences of turnover |
|
• Development • Delivery • Materials • Facilities • Time off the job • Travel (if applicable) • Overhead (administration) |
• Work disruption • Lost productivity (or replacement costs) • Quality problems • Customer dissatisfaction • Management time • Loss of expertise/knowledge |
|
Formal on-the-job training |
|
|
• Development • Job aids • Delivery • Management time • Overhead (administration) |
|
The alternative is to routinely reduce the number of employees, often through a “last-in-first-out” process, which is frequently used by unionized organizations. This leaves the most senior and highest paid, but not necessarily the most productive, employees on the payroll. Hiring temporary and contract workers avoids lowering regular employee morale by placing pay and jobs at risk.
Outsourcing
Recognizing the high cost of maintaining employees, particularly on a long-term basis, some organizations have resorted to outsourcing to keep their employee head count to a minimum. For some companies, this is a strategy that enables a highly flexible, adaptive organization. Outsourcing can benefit an organization that is using external providers to deliver leading-edge expertise. This approach essentially creates a small number of employees and a tremendous network of subcontractors who provide services that regular employees provide in other firms or that regular employees previously performed. Outsourcing usually costs less on a total basis and can bring in much-needed expertise and specialization. Additional information on outsourcing is presented in the chapter on globalization (Chapter 11).
Invest the Minimum
While the previous section examined organizations that let others do the investing in people, this one examines those organizations that invest only the minimum. A few organizations adopt this strategy by choice; others do it out of economic necessity. Either way, this is a viable option for some organizations. This section explores the issues involved in the strategy of minimum human capital investment and examines its challenges, consequences, and advantages. This strategy has several hidden land mines that can be detrimental in the long term if not recognized and addressed.
Basic Strategy
This strategy involves investing the very minimum in human resources, providing job training, salaries, benefits, and services only at the minimum level with almost no development and preparation for future jobs. Organizations adopting this philosophy operate in a culture that is sometimes reflective of the competitive forces in the industry. These organizations experience high turnover and usually adjust processes and systems to take into account the constant churning of employees.
Though efficiency is gained by keeping costs at a minimum, this strategy should not be confused with efficient resource allocation. The strategy presented here is a deliberate effort to dispense only the minimum investment. This strategy is about facing the inevitable in some situations or making a deliberate attempt to invest as little as possible in employees.
Forces Driving the Strategy
The primary forces driving this strategy can be put into three words—cost, cost, and cost. Some organizations work in such a low-cost, low-margin environment that a minimal human capital investment appears to be the only option. Low-cost businesses, such as Wal-Mart, operate on volume to make significant profits. Competition requires low wages and almost no benefits in many cases, and such conditions are inherent in some industries, such as retail or food service. However, the opening stories in this chapter illustrated that a low-cost pressure doesn’t necessarily mean that investment in employees should be minimized.
Nevertheless, in some cases, the minimum investment strategy is adopted out of necessity—the organization must invest as little as possible to survive, particularly in the short term. These organizations are often managed by executives who see little value in their employees and view them only as a necessary cost to deliver the service. They consider employees to be dispensable, easily recruited and quickly discharged if they are not performing appropriately. For example, as part of Radio Shack’s survival efforts, investment in employees went from low to even lower. But it didn’t work out. Radio Shack filed for bankruptcy in February 2015, after years of struggling to survive.3
The Cost of Turnover
Organizations investing only the minimum amount in human resources will have high turnover, and they usually do not understand the true cost of turnover. They see the direct cost of recruiting, selection, and initial training, but they do not take the time to understand the other impacts. Both the direct and indirect cost of turnover must be taken into consideration. The total cost of turnover is rarely calculated in organizations investing minimally in their human capital. When the cost is estimated, it is often underestimated. More important, estimations of the total cost are not communicated throughout the organization, leaving the management team unaware of the potential costs. Earlier, Table 3.2 listed the costs in the sequence in which they occur. This table suggested that there are many different costs, some of which are never known with certainty but can be estimated if enough attention is directed to the issue.
Table 3.3 shows the cost of turnover expressed as a percent of annual pay for selected job groups. As shown in this table, these costs, arranged in a hierarchy of jobs, are significant. The data for this table were obtained from a variety of research studies, journals, academic publications, industry publications, private databases, and professional associations, all from a database labeled ERIC (http://eric.ed.gov). Collectively, these external studies provide a basis for understanding the total cost of this important issue, and understanding the impact of turnover is the first step toward tackling it.
Table 3.3. Turnover costs for selected job groups.
|
Job type/category |
Turnover cost range (percentage of annual wage/salary)* |
|
Entry-level hourly, unskilled (e.g., fast food worker) |
30–50 |
|
Service/production hourly (e.g., courier) |
40–70 |
|
Skilled hourly (e.g., machinist) |
75–100 |
|
Clerical/administrative (e.g., scheduler) |
50–80 |
|
Professional (e.g., sales representative, nurse, accountant) |
75–125 |
|
Technical (e.g., computer technician) |
100–150 |
|
Engineers (e.g., chemical engineer) |
200–300 |
|
Specialists (e.g., computer software designer) |
200–400 |
|
Supervisors/team leaders (e.g., section supervisor) |
100–150 |
|
Middle managers (e.g., department manager) |
125–200 |
*Percentages are rounded to reflect the general range of costs from studies. Costs are fully loaded to include all the costs of hiring a replacement employee and bringing him or her to the level of productivity and efficiency of the former employee.
When the phrase fully loaded cost is used, it is important to consider what goes into it. The turnover costs in Table 3.3 contain both direct and indirect cost components. A complete list of the cost components is included in Table 3.4. This table contains a list of cost items that can be derived directly from cost statements and others that have to be estimated. Essentially, those on the left side of the table can easily be derived, while those on the right side typically have to be estimated. When considered in total, excessive turnover is expensive and very disruptive.
Table 3.4. Turnover cost components.
• Exit cost of previous employee
• Lost productivity
• Recruiting cost
• Quality problems
• Employee cost
• Customer dissatisfaction
• Orientation cost
• Loss of expertise/knowledge
• Training cost
• Supervisor’s time for turnover
• Wages and salary while training
• Temporary replacement costs
Advantages and Disadvantages
There are many advantages to the minimum investment strategy. The first and most obvious is low labor costs. Executives taking this approach strive to be the lowest-cost provider of goods or services. In doing so, they must invest at minimum levels. Another advantage is that this strategy requires simplistic jobs, tasks, and processes. These job elements make recruiting, training, and compensation relatively easy. Finally, this may be the best strategy for survival, particularly on a short-term basis. Depending on the nature of the business, some organizations must operate with minimum commitment to employees.
These advantages aside, investing the minimum in human capital can result in negative consequences for organizations. First, a minimum investment strategy must be considered only in the context of simple, lower-level jobs. Automation is preferable if the jobs can be eliminated. If not, the jobs must be broken down into simple steps.
Second, organizations using this strategy must be able to cope with a high turnover rate. With little investment, employees will move on to another organization for just a slight increase in pay. Executives must ensure that hiring costs are minimal and initial training costs are extremely low. For example, McDonald’s keeps its jobs simple and the training very efficient, resulting in a low cost to recruit and build capability. With these costs at a minimum, McDonald’s executives expect high turnover and are willing to live with and adjust for it.
Third, this approach can have a long-term negative impact as the turnover costs cause inefficiencies in the organization, deterioration in the quality of service, and an increase in indirect costs. This is not a major issue in a fast food chain where jobs can be divided into small parts and administered efficiently. However, for a manufacturing or electric utility firm, it may be difficult to live with the high turnover inherent in this strategy on a long-term basis. CHROs in such companies usually seek to increase the investment in people. This is a difficult road, but with the right internal champions, changes can be made. Using benchmarks, demonstrating value-added contributions, and aligning to business goals will assist in increasing investment in human resources. For example, Wal-Mart and McDonalds are now investing beyond the minimum. They are investing in upward mobility, career development, and management development. These organizations are proud of their store managers who started in entry-level positions.
Invest with the Rest
Some organizations prefer to invest in human capital at the same level that others invest. Investing with the rest involves collecting data from a variety of comparable organizations, often perceived as implementing best practices, to determine the extent to which those organizations invest in human resources. The benchmarking data are used to drive changes, if necessary, to achieve the benchmark level. In essence, this strategy aligns the organization to a level of investment that the benchmarked organizations achieve.
There has been phenomenal growth in benchmarking in the last two decades. Virtually every function in an organization has been involved in some type of benchmarking to evaluate activities, practices, structure, and results. Because of its popularity and effectiveness, many CHROs use benchmarking to show the value of and ideal investment level for human capital. In many cases, the benchmarking process develops standards of excellence from “best practice” organizations. The cost of connecting to existing benchmarking projects is often very low, especially when the available data are considered. However, when a customized benchmarking project is needed, the costs are significant. Organizations such as the Society for Human Resource Management (SHRM) have benchmarking services that use standardized measures for human resources practices and compare them by industry, company size, and geographic location. Other helpful benchmarks come from Workforce Magazine, Strategic HR Review, Human Resource Management, Talent Management, and People & Strategy. These sources provide excellent opportunities to understand and validate investments in human capital.
An important force driving the invest-with-the-rest strategy is that it is a safe approach. Benchmarking has been accepted as a standard management tool, often required and suggested by top executives. It is a low-risk strategy. The decisions made as a result of benchmarking, when proven to be ineffective, can easily be blamed on faulty sources or processes, not the individuals who sought the data.
Benchmarking Basics
Benchmarking is a strategy that can be used in conjunction with other approaches. As a low-cost approach, benchmarking can provide an important view of the human resources function and the investment required for it. Several issues must be addressed.
Human Capital Benchmark Measures
The first issue is to identify key HR drivers and performance indicators so that meaningful measures can be developed. Internal client feedback about existing processes and practices should be gathered so that critical success factors within the HR function can be prioritized and the appropriate focus for benchmarking can be selected.
For human capital investment, an important issue is determining specifically what should be benchmarked and what data are available. Ideally, a complete profile of cost data should be monitored to understand the total investment in human capital. Table 3.5 shows the human capital benchmarks needed to determine the appropriate investment levels. The definition of a particular measure must be addressed and clarified in benchmarking along with the many options, combinations, and possibilities available.
Table 3.5. Human capital investment benchmarks.
1. Human resources expenses (HR department costs/budget)
a. As a percentage of operating costs
b. As a percentage of revenue
c. Per employee
2. Total investment in human capital (total HR expenses plus all salaries and benefits of non-HR staff)
a. As a percentage of operating costs
b. As a percentage of revenue
c. Per employee
3. HR expenses by function
a. Recruiting and selection cost as a percentage of total HR
b. Recruiting and selection cost per new employee hired
c. Training/learning/development costs as a percentage of total HR
d. Training/learning/development costs per employee
e. Training/learning/development costs as a percentage of compensation
f. Compensation costs as a percentage of total HR
g. Compensation costs as a percentage of operating expenses
h. Compensation costs per employee
i. Benefits costs as a percentage of total HR
j. Benefits costs as a percentage of operating expenses
k. Benefits costs as a percentage of compensation
l. Benefits costs per employee
m. Employee relations costs as a percentage of total HR
n. Employee relations costs per employee
o. Compliance and fair employment costs as a percentage of total HR
p. Compliance and fair employment costs per employee
4. HR expenses by process/program
a. Analysis and assessment costs as a percentage of total HR
b. Design and development costs as a percentage of total HR
c. Implementation and delivery costs as a percentage of total HR
d. Operations and maintenance costs as a percentage of total HR
e. Measurement and evaluation costs as a percentage of total HR
5. Selected HR costs
a. Turnover costs per employee leaving
b. Turnover costs as a percentage of compensation
c. Accident costs per incident
d. Safety costs per employee
e. Absenteeism costs per absence
f. Absenteeism costs as a percentage of average wage rate
g. Healthcare costs per employee
h. Healthcare costs as a percentage of total benefits
i. Wellness and fitness costs per employee
j. Sick leave costs per employee
The first measurement group represents the expenses of the traditional HR function. This is often referred to as the HR department costs included in the overall HR budget. This measure shows the efficiency of the HR staff to deliver services. Presenting these expenses as a percentage of operating costs or revenue or on a per-employee basis provides an easy comparison to other organizations in the same industry.
From the human capital perspective, the second grouping is more important. This represents the total investment in human capital, which is the total HR department expenses plus salaries and benefits of all other employees. In essence, this group includes every function that exists in the chain of HR acquisition and maintenance. Attracting, selecting, developing, motivating, compensating, and maintaining employees are accounted for in this total cost. Because the traditional HR department expenses do not include salaries of other functions, this measure has the effect of showing the total cost. It should be reported as a percent of operating costs or revenue or on a per-employee basis to show realistic comparisons with other organizations. All the direct employee-related costs are included in the human capital measure.
Human capital costs are sometimes associated with other functions that may not normally be captured in the HR budget. For example, finance and accounting may have transaction costs such as payroll; IT may be involved in the administrative issues of processing benefits claims or web-based activities; security may be involved in some of the safety-related issues; and property may be involved in providing facilities such as cafeterias and fitness centers. Identifying and capturing all the costs are important to show the total human capital investment and make realistic comparisons. It should be noted that the cost of maintaining office space and equipment for employees is not included. This cost is usually reported as tangible assets or operating expenses. Employee travel falls in the same category.
The third grouping is by function, which is important to compare the efficiency of the various parts of the HR organization. HR expenses are those normally found in the HR budget, and the grouping is organized by traditional functions:
• Recruiting and selection
• Talent development (including orientation and socialization)
• Compensation, which includes direct compensation, bonuses, and deferred compensation
• Benefits, which includes all benefits and the costs to the company as well as external providers
• Employee relations, which includes labor relations for organized groups
• Compliance and fair employment, which cover legal issues including employee complaints, discrimination, and sexual harassment complaints, along with a variety of other compliance-related issues
• Safety, health, wellness, and fitness
The fourth group is not normally reported but is becoming an important issue: showing the costs of various HR processes. As HR programs are launched or modified, it is helpful to understand the relative costs of the different steps to develop and implement them. Beginning with analysis and assessment, these categories include the typical program development phases and end with measurement, evaluation, and analytics. Reporting these as a percentage of the total cost of HR provides insight into the relative investment in these processes in similar organizations. In recent years, there has been growth in costs as a percent of total HR in the initial analysis and assessment to ensure that a new program or project is needed and that it is aligned with the business. The same is true in measurement, evaluation, and analytics because of the need to show the contribution of the HR program.
The fifth group shows some selected HR costs that need to be reported and perhaps compared with other organizations. They represent employee-related cost variables and are measures that can be quite expensive and must be managed. Proactively, these costs also represent values of important measures that can be improved with new or modified HR initiatives. These are invaluable data items when an organization attempts to calculate the ROI in human capital programs. Perhaps the most expensive measure in this group is the cost of involuntary employee turnover as described in this chapter. Accident and safety costs are important for manufacturing and construction industries. Healthcare costs are becoming increasingly critical for organizations providing healthcare for employees. Preventive programs are often put in place to eliminate these costs whenever possible.
The Elusive Best Practice
Inherently, the benchmarking process is designed to show what others accomplish or experience. The concept of the best practice is often an elusive goal because, in reality, many benchmarking projects involve participants that just happen to be in the same industry, in the same setting, or willing to participate in the study. They may or may not represent a best practice. Even determining the best practice can prove elusive. How is “best practice” defined? What is the basis of determining best practice? Who decides what is or is not best practice? How credible are the data reflecting the best practices? These are important questions to consider when observing and using benchmark data.
Best practice is even more elusive when the concept of human capital cost or investment enters into the equation. Is a best practice the lowest investment? Not necessarily, because there is a perceived linkage between investing in human capital and subsequent organizational success: the larger the investment, the more successful the organization. In this case, the highest level of investment may be the appropriate choice to follow. But does a large investment in human capital infer best practice? Investment and cost must be explored from the perception of the outcomes and payoff. The investment in human capital should be examined in terms of its efficiency. For example, how has an organization been able to accomplish an impressive target at a cost lower than others? The concept of best practice must be clearly understood when benchmarking data are presented or when designing a custom process.
Benchmarking Sources
The sources for benchmarking involve two issues. The first challenge is to understand the sources that currently exist for benchmarking studies. Here, the principal organizations are needed for benchmarking studies involving credible data. Table 3.6 shows some of the benchmarking sources that offer HR data across most of the United States as well as some international data. Although no one source provides all the data listed in Table 3.5, this list represents a cross-section of organizations developing some type of human capital data. When data are not available, it is important to find a suitable source with which to partner to develop a custom-designed benchmarking study. This issue is described in the next section.
Table 3.6. Current benchmarking sources.
• Saratoga Institute/PWC: http://www.pwc.com
• Institute for Corporate Productivity (I4CP): http://www.i4cp.com
• American Productivity and Quality Center: http://www.apqc.org
• Society of Human Resource Management: http://www.shrm.org
• The Conference Board: http://www.conference-board.org
• Corporate Executive Board (Corporate Leadership Council): http://www.executiveboard.com
• American Management Association: http://www.amanet.org
• Mercer: http://www.mercer.com
• Towers Watson: http://www.towerswatson.com
• Aon Hewitt: http://www.aonhewitt.com
• ROI Institute: http://www.roiinstitute.net
For large organizations operating outside the local or regional area, it becomes more difficult to make comparisons—not all areas are the same, and there are huge geographic differences in the quality and quantity of the talent in the labor markets from which organizations must select employees. Certain areas have more effective systems and facilities for developing capable, top-quality employees.
Collecting national data presents a twofold dilemma. First, it is difficult to make comparisons because of geographic differences, unless the data are provided by region. (Consider, for example, the differences in human capital costs in New York City and Nashville, Tennessee.) The second issue is the limited sources available to provide credible data. It is even more difficult to benchmark at the international level. A replication process is necessary for benchmarking in each country. When there are differences in the practices of the countries, making comparisons to organizations located in another country becomes fruitless. If a particular employee benefit or HR program is implemented in one country, should it be included in other countries as well? These are dilemmas of operating globally, which make benchmarking data on a global basis unreliable. Still, attempts are made to benchmark each country through national surveys. A few of the organizations listed in Table 3.6 provide international data from the participating units in those countries.
Creating a Custom Benchmarking Project
Because of the concerns about the quality and availability of these data, some CHROs develop their own customized benchmarking for human capital measurement. Although this appears unnecessary and is expensive, it may be the only way to match the organization’s interests and needs to comparable organizations. Incidentally, if more organizations developed their own benchmarking studies, there would be more available data from the various partners. Figure 3.1 shows a seven-phase benchmarking process that can be used to develop a custom-designed benchmarking project. Each phase is briefly described next.
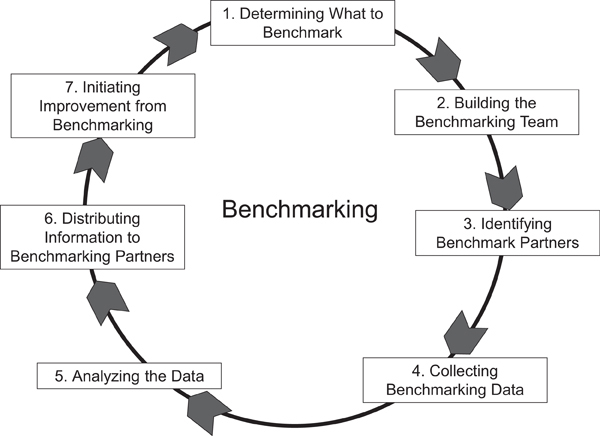
Determining What to Benchmark
The first step is to identify precisely what type of information is needed from benchmarking. This step deserves much attention because of the tendency to explore more areas than are feasible or necessary. Because of the time involved in securing the information, the problem with information availability, and the difficulty in finding suitable partners, benchmarking initiatives must remain within prescribed boundaries. Attempts to collect data that are generally unavailable or difficult to obtain are usually unsuccessful. Also, a lengthy request can be overwhelming, making it difficult to obtain information from a benchmarking partner. The items included in Table 3.5 detail the human capital investment categories. In addition to these, other non-cost-related measures may be sought. These include information such as absenteeism and turnover rates, time to fill jobs, hours of training per year, and so on.
Building the Benchmarking Team
This phase is designed to ensure that an effective internal benchmarking team is in place. An effective team makes the difference between success and failure; it should be carefully selected and prepared to achieve the desired response. Ideally, the team should include the HR executive, several HR specialists representing the different HR functional areas, and a few non-HR managers and executives.
Although an individual could perform the tasks for the project, the team approach is recommended based on the volume of work alone. However, using a team approach also increases ownership of the process and enhances the credibility of the final product. Indeed, the team approach helps ensure that benchmarking results are understood throughout the organization.
Identifying Benchmarking Partners
Identifying benchmarking partners for the project is one of the most important parts of the process. Data can only be useful if collected from respected organizations. It is important to identify those organizations considered to follow best practices or be most successful according to some predetermined set of criteria. The targets may be competitors or noncompetitors in the same industry. Organizations in the same geographic area may be important because of concerns about local HR issues. Partnering with organizations sharing the same kind of structure (i.e., national, international, decentralized) may also be desirable. The best organization to benchmark against may actually be outside of the industry, and every attempt should be made to find partners who have an outstanding reputation in the area being benchmarked. It is important to think creatively.
A variety of sources can help categorize organizations and identify needed data. Table 3.7 shows some of the sources available for locating potential benchmarking partners. There are challenges: Some of the best organizations do not publish data about their successes, they are sometimes reluctant to make professional presentations, they may not apply for human capital awards, and they may not participate in an organization where the information is readily available. These limitations notwithstanding, it is possible to identify candidates that can make great benchmarking partners.
Table 3.7. Finding the organizations.
• Previous award winners
• Governments
• Academic resources and databases
• Consultants
• Business information services
• Business newspapers and magazines
• Technical journals
• Vendors/suppliers
• Business school faculty
• Professional societies
• Trade associations
• Internal sources
• Directories and references
• Customers
Collecting Benchmarking Data
The first issue in this phase is to collect internal data. The data-collection process, including the use of estimates, should be thoroughly tested within the organization to gain additional insight into the process. This provides a way to check the flow of data, quality of data collected, interpretation of data, and potential problem areas. If there are problems with internal information, other organizations will have problems delivering the data as well.
Next, the data are collected from the partners. Data-collection arrangements should be negotiated in advance with organizations agreeing to participate. Typically, a detailed questionnaire is mailed and a telephone interview is conducted to explain all the questions, review the definitions, and address all concerns and issues. If feasible and appropriate, an on-site visit is conducted to capture high-quality data.
Analyzing the Data
After data are collected, they must be tabulated, organized, analyzed, and interpreted. Data are typically organized in a spreadsheet that lists the organizations and the various headings for capturing the data. Spreadsheet analysis is appropriate for tabulating much data, which can be formatted for presentation at a later date.
Distributing Information to Benchmarking Partners
If it is not perceived as adding value within the sponsoring organizations, developing and distributing a report for all benchmarking partners can easily be omitted. However, if the benchmarking partnership is to be a positive, long-term relationship, information distribution must be handled with utmost care. Benchmarking partners require a report containing useful information that can be used internally to improve their processes. The quality of the report promised often creates the eagerness to become involved in the project. The contents of a typical benchmarking report are as follows:
• An executive summary, which presents a brief conclusion from the survey data and provides a brief description of the overall process
• A statement of the purposes of the project with details on the objectives
• A listing of all participants
• A summary of benchmarked items
• A description of the methods for collecting and analyzing the data
• An outline of the overall results and conclusions that shows what the data may mean to the organization
• A description of the strengths within the group that attempts to determine best practices for each of the items benchmarked
• A request for this procedure to be a continuous process with potential future plans
Initiating Improvement from Benchmarking
The final, and probably most critical, phase in the benchmarking process is implementing the improvements the process has shown as necessary. Until the improvements are implemented, there is no return on the often extensive effort that goes into the benchmarking process. When implemented, the return can be great.
Initiating improvement involves three important issues: performance gaps, action plans, and an internal report.
1. Calculating the performance gap means looking at the difference between the desired (benchmarked) value and the current value. The difference translates into a gap that needs to be closed by improving a specific process.
2. Formulating the action plan involves selecting the appropriate actions to resolve the problem or improve the process and then detailing a series of steps that must be implemented over a predetermined period of time to complete these actions.
3. The final part of initiating improvement is writing a report for the internal customers in the sponsoring organization—the individual(s) for whom the process was initiated. This report shows the gaps found and the actions needed to close them. Updates of this report provide a view of the continued success being made.
Advantages and Disadvantages
The benchmarking process is not without its share of problems, consequences, and issues. Benchmarking must be approached as a learning process, not necessarily a process to duplicate or replicate accomplishments of others. Each organization is different. What is needed in one organization may not be the same in another. Also, benchmarking is time consuming when a custom-designed benchmarking project is developed. It requires discipline to keep the project on schedule, within budget, and on track to drive continuous process improvement.
Determining what the best practices are is an elusive goal; benchmarking can create a misunderstanding that average data taken from a group willing to participate in a study represents best practices. Gathering national and international data is a difficult issue that often limits benchmarking as a global tool. Finally, benchmarking is not a quick fix; it is a long-term improvement process. Table 3.8 shows some of the myths about benchmarking that cause the process to be misused or misunderstood.4
Table 3.8. Benchmarking myths.
• The only way to benchmark is against direct product competitors.
• Benchmarks are only quantitative, financially based statistics.
• Benchmarking investigations are focused solely on operations showing a performance gap.
• Benchmarking needs to be done occasionally and can be accomplished quickly.
• There is a single company somewhere, mostly like my firm only much better, which follows “the best practice.”
• Staff organizations cannot be benchmarked.
• Benchmarking is a target-setting stretch exercise.
• Benchmarking can most effectively be accomplished through third-party consultants.
• It is not obvious what should be benchmarked for each business unit.
• Processes do not need to be benchmarked.
• Internal benchmarking between departments and divisions has only minimal benefits.
• There is no benefit in qualitative benchmarking.
• Benchmarking is comparing an organization to the dominant industry firm and emulating the firm six months later.
Source: Updated and adapted from R. C. Camp. Benchmarking: The Search for Industry Best Practices that Leads to Superior Performance Milwaukee, WI: ASQC Quality Press, 1989.
Benchmarking has many advantages, satisfies a variety of needs, and is used for several important purposes. It is extremely helpful in the strategic planning of the HR function and for determining the desired investment level. Information and measures derived from the process can enable HR executives to help the organization meet its strategic objectives. It is also useful in identifying trends and critical issues for human capital management. Measures from benchmarking can become the standard of excellence for an activity, function, system, practice, program, or specific initiative. It has become an important measurement and evaluation tool, as well as a routine management tool. Benchmarking also allows the organization to compare certain product features and benefits with others. To be successful, several qualities must be fostered when developing a custom project.
• A strong commitment to benchmarking from management
• A clear HR understanding of present practices as a basis for comparison to best practices
• A willingness to change HR practices based on benchmark findings
• A realization that competition is constantly changing and there is a need to stay ahead of the trend
• A willingness to share information with benchmark partners
• The involvement of a small number of organizations that are recognized leaders in HR
• An adherence to the benchmarking phases
• A commitment to a continuous benchmarking effort for long-term improvement
With this approach, executives use benchmarking to determine the desired level of investment in human capital and the mix of human resources programs and activities to pursue or improve. Benchmarking has been used routinely for more than two decades and is a mainstream management tool, used by many HR executives to set the human capital investment level. It can be used as the primary way to determine the human capital investment, or it can supplement other strategies.
Invest Until It Hurts
While some organizations invest at the same level as other organizations, many operate under the premise that more is better. They overinvest in human resources. The results of such an approach can be both disappointing and disastrous. A few CHROs do this intentionally; others do it unknowingly. Either way, this is a strategy that deserves serious attention. With this strategy, CHROs invest in programs and services beyond what is needed to meet the goals and mission of the organization. Executives implement almost every human resources program they see and teach every new idea that comes over the horizon.
Some advocates suggest that overinvesting in employees is not an important issue—the more you invest, the more successful the organization. However, others will argue that overinvesting occurs regularly and is unnecessarily burdening organizations with excessive operating costs. Overinvesting puts pressure on others to follow suit, thus creating an artificial new benchmark. Investing until it hurts is not usually a deliberate strategy—executives are simply unaware that the increase in spending is not adding value.
Signs of Overinvesting
An example of overinvesting is an automotive company located in North America. This firm, with headquarters outside the United States, spent almost $4 million on a wellness and fitness center for its North American employees. The rationale for investing in this center was to increase the attraction and retention of employees. The executives wanted to maintain high job-satisfaction levels and thought that the wellness and fitness center would help accomplish this goal. In addition, they thought that a fitness center would be an excellent way to contain or lower healthcare costs. Some executives believed it would even reduce absenteeism and job-related accidents.
When these measures were examined after the center opened, the results were far from what one would expect:
• Job satisfaction levels were extremely high—beyond what was expected or perhaps could even be achieved in most organizations.
• Attraction was not an issue. Just a rumor that there might be additional jobs on the assembly line would create an overwhelming amount of applications in the HR department. (At one time, as many as ten thousand people applied after an announcement that two hundred jobs would be added in the plant.)
• Retention was not an issue. The company was experiencing less than 3 percent annual turnover—too low by some standards. Unless there is significant growth, a turnover level that low is unhealthy. Lower turnover probably could not be achieved, even if a variety of solutions were implemented. Low turnover was a product of satisfied employees, a superior benefits package, and wages that were double the average in the area. If attraction and retention improvement was the motive, the wellness and fitness center was a futile investment.
• Healthcare costs were below average for the manufacturing industry in the area. With the implementation of the wellness and fitness center, the costs were contained but not reduced; the cost differential was very small—only enough to cover a fraction of the cost of maintaining the wellness and fitness center.
• The manufacturing facility enjoyed one of the best safety records in manufacturing. Because there was not an accident problem to begin with, there was no reduction in accidents since the center was developed.
• Absenteeism was not an issue and did not change significantly with the implementation of the wellness and fitness center.
Thus, from the return on investment prospective, the wellness and fitness center failed to add value. This is a classic case of overinvesting—adding a benefit or service that does not add value to the organization yet adds significant costs.
A few years back, dot-coms littered the landscape with examples of overinvesting, as company after company lavished their employees with benefits, perks, programs, and opportunities to buy their loyalty, motivate them to high levels of achievement, and retain them at all costs. One interesting organization investing heavily in human capital is SAS Institute, based in Cary, North Carolina. In less than four decades, SAS has evolved into a world leader in intelligence software services, with more than thirteen thousand employees, offices in three countries, and annual revenues of more than $3 billion. Jim Goodnight, the cofounder and CEO, has a reputation for showering his employees with perks. For example, employees work only thirty-five hours per week. Sick days are unlimited and can be used for tending to ailing family members. Company specialists can arrange expert help for aging parents. Benefits are extended to domestic partners. Employees at headquarters can take their preschool children to one of four daycare centers (two on-site, two off-site). Each of the twenty-four buildings on this 250-acre campus has a break room on every floor stocked with refreshments and snacks. Employees can choose between four cafes and work off their meals in a 54,000-square-foot gym, complete with free personal trainers, an Olympic-size swimming pool, aerobics classes, and a dance studio. A soccer field, tennis courts, and a putting green round out the sports amenities.
Is all this necessary? Some would characterize this as going beyond what is needed to build a motivated, committed, and engaged workforce. Supporters suggest that this is the primary reason for their low turnover of less than 3 percent; however, according to internal executives including the HR executive, no analyses have been conducted to connect these perks to a specific retention amount.
SAS routinely appears in Fortune magazine as one of the “100 Best Companies to Work For.” One publication characterized Goodnight as “extravagant.”5 In Fortune’s analysis, “This software maker is the closest thing to the worker’s Utopia in America,”6 highlighting the on-site childcare, health center with physicians and dentists, massage therapists, hair salon, roof-top garden, solar farm, and a profit-sharing program as well. Goodnight credits the success of the company to the gung ho, dedicated workforce. Through a variety of perks and benefits, he attempts to make the employees’ lives easier and believes they will give their all to work. As a private organization, SAS is not subject to the scrutiny of Wall Street analysts. If that were the case, the employee benefit structure might be different.
Is investing in human capital to this extent a good thing? Some will argue that you cannot overinvest in human capital and that the more you provide employees, the better. Others would argue that each time a new program, project, or benefit is added—particularly one that becomes a permanent fixture—operating costs are added that will eventually place a burden on the company. At what point is there diminishing return on investing in human capital?
Forces Driving This Strategy
Several forces operate together to cause overinvesting. Some of these are realistic challenges; others are mythical. During the 1990s, retention became the main battle cry. The labor market was tight, skilled employees were scarce, and organizations would do almost anything to keep employees or attract new ones. This often led to investing excessively in signing bonuses, expensive benefits packages, and a variety of perks, well beyond what would be necessary or acceptable in many situations. Offering all types of benefits and opportunities was designed to keep turnover low and was considered necessary for business survival. However, many organizations—even industries—were able to maintain low turnover without having to resort to this strategy.
This placed a heavy burden on employers, which, at the time, seemed reasonable—they could afford it. When economic climate changed and they could no longer afford it, executives had to remove these perks. The result was a disgruntled workforce and increased turnover, the situation they were trying to avoid in the first place. This is a vicious cycle that can only be avoided by careful planning, with more focus on creating a workplace that is challenging and motivating, with exciting opportunities, instead of a place where employees are pampered and paid excessively. Part of the problem is that many executives believe that retention is primarily related to pay, when it is not.
Investing until it hurts is not always a deliberate strategy. Executives may be unaware that the increase in spending is not adding value, as the automotive case study illustrates. In many cases, companies add benefits, services, and perks without anticipating the full impact of these investments. The two most vulnerable areas are retirement plans and healthcare benefits. In the 1970s, some companies began to switch from defined benefit plans to defined contribution plans, shifting the investment risk to the employees. Many organizations still provide traditional defined benefit pension plans, however, which have proven to be extremely costly and difficult to change. Failure to make the switch has caused some firms to not only have excessive costs but even move into bankruptcy.
For the most part, executives did not anticipate the tremendous changes that lead to the burden of retirement. First, there is the investment risk of the pension plan. When you maintain defined benefit plans, it becomes more costly for employers than anticipated, particularly in a recession. Second, employees are living much longer, thus retirement costs are increasing. Third, employers are often much more generous because they think short-term rather than long-term as they provide benefits and negotiate lucrative labor contracts.
These organizations are unwilling or unable to conduct the proper initial analysis to see if benefits are needed. Analysis will indicate if the benefits are the right solution to a particular problem. Without the analysis, programs are conducted when they are not needed, wasting money.
Finally, some organizations overinvest because they can afford to do so. They are very profitable, enjoying high margins and ample growth, and want to share the wealth with employees through benefits, perks, and bonuses. During the 1990s, many high-tech companies made tremendous amounts of money. A number of them overinvested because they felt they could afford it. When the economy turned, the companies could not sustain some of these expenditures and benefits.
Concerns
Obviously, overinvesting is not a recommended strategy. There are many problems depicted in this section that are the byproducts of overinvesting, which can burden not only the company but also the industry. The most significant disadvantage of overinvestment is the less-than-optimal financial performance. By definition, overinvesting is investing more than necessary to meet the objectives of the organization. The relationship between investing in human capital and financial performance is depicted in Figure 3.2. As the figure shows, a certain level of investment yields additional financial results, but there is evidence of a point of diminishing return, where the added benefits peak and then drop as investments continue. As indicated, the “overinvesting” area reflects no increased financial performance for additional investments. Then there is a point reached where the actual performance goes down. This is excessive investing, which can eventually erode performance in the organization, particularly in industries where the human capital expense is an extraordinarily high percentage of the total operating cost. The knowledge industry is a good example, where the impact on the bottom line is severe when companies overinvest in human capital.

Invest as Long as There Is a Payoff
Some organizations prefer to invest in people when there is evidence that the investment is providing benefits. They often compare monetary benefits of learning programs with the costs of learning. This strategy is becoming more popular following the increased interest in accountability, particularly with the use of ROI as a business-evaluation tool. With this strategy, all HR programs are evaluated, and a few key programs are evaluated at the ROI level—that is, ROI is calculated the same way as it would be for an investment in buildings or equipment. The practices at Costco, Trader Joe’s, and Quiktrip, detailed in the opening stories of this chapter, are excellent examples of investing more because of the payoff results.
The ROI Strategy
This ROI strategy focuses on implementing a comprehensive measurement and evaluation process for expenditures in an organization. This involves the possibility of capturing up to seven types of data in the value chain, as shown in Figure 3.3.7 Using this philosophy, only a small number of programs are examined in terms of ROI, whereas every program is evaluated with reaction data. When business impact and ROI are determined for a program, one or more techniques are utilized to isolate the impact of the program on the business data. Chapter 14 provides more detail on this approach to accountability.

Figure 3.3. Business impact and ROI from an HR program.
Source: Adapted from Jack J. and Patricia P. Phillips. Proving the Value of HR: How and Why to Measure ROI, 2nd ed. Alexandria, VA: Society for Human Resource Management, 2012.
Organizations adopting this strategy will evaluate each HR program at some level, following the value chain. Table 3.9 shows the percentage of HR programs evaluated at each of the five levels of outcome each year for Scripps Health, a successful not-for-profit healthcare organization with 13,000 employees.
Table 3.9. Evaluation targets for Scripps.
|
Level of evaluation |
Percent of HR programs evaluated at this level |
|
Level 1—Reaction |
100 |
|
Level 2—Learning |
50 |
|
Level 3—Application |
30 |
|
Level 4—Business Results |
10 |
|
Level 5—ROI |
5 |
Forces Driving Change
Although the trend toward additional accountability has been increasing over the last decade, there are several reasons this strategy is critical at this time. In the last few years, CHROs have had to demonstrate the value their programs add to their organizations. They have also had to develop the skill to communicate with other managers—in the language of business—the human resources contribution to the financial bottom line. In a world in which financial results are carefully measured, a failure to measure HR policy and practice implementation dooms this function to second-class status, oversight, neglect, and potential failure. It has become apparent that CHROs need to be able to evaluate—in financial terms—the costs and benefits of different strategies and individual practices.
The increasing cost of human resources is another driving force. As will be discussed throughout this book, investment in HR is quite large and growing. As budgets continue to grow—often outpacing other parts of the organization—the costs alone are requiring some executives to question the value. Consequently, these executives are often requesting or suggesting that the impact of human resources programs be determined or forecast. In some cases, the ROI is required at budget-review time. Production managers, for example, propose investments in new technology and incorporate into their proposals the projected increases in productivity and resultant decreases in unit-production cost. HR professionals must compete for scarce organizational resources in the same language as their colleagues and present credible information on the relative costs and benefits of interventions.
More CHROs are managing the human resources function as a business. These executives have operational experience and, in some cases, financial experience. They recognize that HR should add value to the organization, and consequently, these executives are implementing a variety of measurement tools, even in the hard-to-measure areas. These tools have gradually become more quantitative and less qualitative. ROI is now being applied in human resources just as it is in technology, quality, and product development. A decade ago, it was rare to use ROI in this area. Now, business-minded HR executives are attempting to show value in ways that top executives want to see. Top executives view human resources in a different way than they have in previous years and are no longer willing to accept HR programs, projects, and initiatives on faith. This is not to suggest that they do not have a commitment to human resources, but now they see that measurement is possible—and ROI is feasible—and they want to see more value.
Advantages and Disadvantages
The ROI methodology has several important advantages. With it, the human resources staff and the client will know the specific contribution of a program in a language the client understands. Measuring ROI is one of the most convincing ways to earn the respect and support of the senior management team—not only for a particular program but for the human resources function in general. The client who requests and authorizes a learning program or project will have a complete set of data to show the overall success of the process.
Because a variety of feedback data are collected during the program implementation, the comprehensive analysis provides data to drive changes in processes and make adjustments during implementation. Throughout the cycle of program design, development, and implementation, the entire team of stakeholders focuses on results. If a program is not effective, and the results are not materializing, the ROI methodology will prompt modifications. On rare occasions, the program may have to be halted if it is not adding the appropriate value.
This methodology is not suitable for every program. It has some very important barriers to success. The ROI methodology adds additional costs and time to the HR budget, but not a significant amount—probably no more than 3–5 percent of the total direct human resources budget. The additional investment in ROI should be offset by the results achieved from implementation. However, this barrier often stops many ROI implementations early in the process. Many staff members may not have the basic skills necessary to apply the ROI methodology within their scope of responsibilities. The typical human resources program does not focus on results but on qualitative feedback data. It is necessary to shift HR policy and practice from an activity-based approach to a results-based approach. Some staff members do not pursue ROI because they perceive the methodology as producing results that reflect on their individual performance. If it is negative, they fear that their program may be cancelled. They fail to see ROI as a process-improvement tool.
Human Capital Strategy Implications
This particular topic is rarely discussed in human capital strategy planning documents, yet as this chapter has detailed, without a clear-cut strategy for human capital investment, the investment levels can be influenced by all types of assumptions, philosophies, and processes, some of them dysfunctional and not adding value. There is a tendency for organizations to use benchmarking as a way to set their investment level. There is also growing interest in investing as long as there is a positive payoff. This requires a comprehensive measurement system to show the value of human capital and the results. Specifically, the human capital strategy should address these three requirements:
• Define the way in which the investment levels are set for major job groups.
• If benchmarking is used, outline the strategy for benchmarking in terms of comparison groups or customized projects.
• Invest as long as there is a payoff, defining the particular way in which human capital is valued.
..................Content has been hidden....................
You can't read the all page of ebook, please click here login for view all page.