
Leveraging Human Capital Analytics for Site Selection: Monster and Enterprise Rent-A-Car
Jesse Harriott, Jeffrey Quinn, and Marie Artim
Enterprise Rent-A-Car, owned and operated by Enterprise Holdings since 2009, approached Monster Worldwide in 2007 to help in the decision-making process of where to locate a new customer contact center. Enterprise had considered dozens of various locations, and the company believed that Monster’s real-time labor market information could help it determine the most effective city to locate the new center. The following reviews Enterprise’s business situation, as well as Monster’s analytical framework that was used to inform Enterprise’s decision. This led ultimately to the selection of the site (here referred to as “Market A”). The performance outcomes of Enterprise’s Market A contact center are also discussed.
Enterprise Holdings
Enterprise Holdings, through its subsidiaries, owns and operates more than 1 million cars and trucks, including the largest fleet of passenger vehicles in the world today, under the Alamo Rent A Car, Enterprise Rent-A-Car, and National Car Rental brands. As North America’s largest and most comprehensive car rental company, Enterprise Holdings also operates a network of more than 8,000 car rental locations in neighborhoods and at airports worldwide, and leads the industry with more than a third of all airport business in the United States and Canada.
Enterprise Holdings is headquartered in St. Louis, Missouri. Ranked no. 21 on the Forbes Top 500 Private Companies in America list, Enterprise Holdings is the only investment-grade company in the car rental industry. In addition, Enterprise Holdings is part of a global strategic alliance with Europcar, creating the world’s largest car rental network. Other Enterprise business lines include Enterprise Fleet Management, Enterprise Commercial Trucks, Enterprise Car Sales, and WeCar car sharing.
The company is run by chairman and CEO Andrew Taylor, whose father, Jack Taylor, founded Enterprise Rent-A-Car in 1957, based on the simple philosophy: “Take care of your customers and employees first, and profits will follow.” Enterprise’s business model today is a direct result of Jack Taylor’s simple but powerful belief, and especially how that belief relates to customer satisfaction, employee development, fleet growth, and profitability.
Enterprise Rent-A-Car has been recognized for its well-developed management training program. BusinessWeek has ranked Enterprise as a “Best Place to Launch a Career” for four consecutive years. And College Grad.com and Black Collegian magazine have consistently named Enterprise as a top college recruiter. Additionally, Enterprise believes almost exclusively in promoting from within—another attribute that has contributed to its good reputation among recent college graduates. Management trainees typically receive one or more promotions during their first year, then become an assistant branch manager and eventually a branch manager in their first few years.
A cornerstone to Enterprise’s continued success has been its commitment to superior customer service. This commitment includes its contact center operations, and therefore much effort and research went into the decision to locate Enterprise’s new facility.
Monster’s Analytical Framework
Monster has a global footprint that reaches over sixty countries and over 80 million people each month. In the United States, visitors to Monster.com perform over 150 million job searches in a month and upload over 40,000 resumes per day. The profile of talent using the Monster site runs the gamut, with everybody from scientists to blue-collar workers searching for local jobs around the globe. Enterprise had worked with Monster for many years as a recruiting partner, and had recently started working with Monster as a source of human capital analytics. Therefore, when Enterprise was evaluating sites for the contact center, it contacted Monster for assistance.
Because of the vast amount of activity on Monster, much valuable insight can be gained from the data Monster collects on its site. Therefore, Monster created a separate division, Monster Intelligence, to analyze this information for customers. One of the products of this initiative is the Monster Employment Index, a monthly snapshot of online recruitment activity across a large representative selection of online career outlets, reflecting millions of employer job opportunities each month. The Monster Employment Index has data going back to 2003 in the United States and 2005 in Europe and Canada. The first such index of its kind, it is now used by many economists, companies, and major government agencies to track online recruiting trends by local market and occupation.
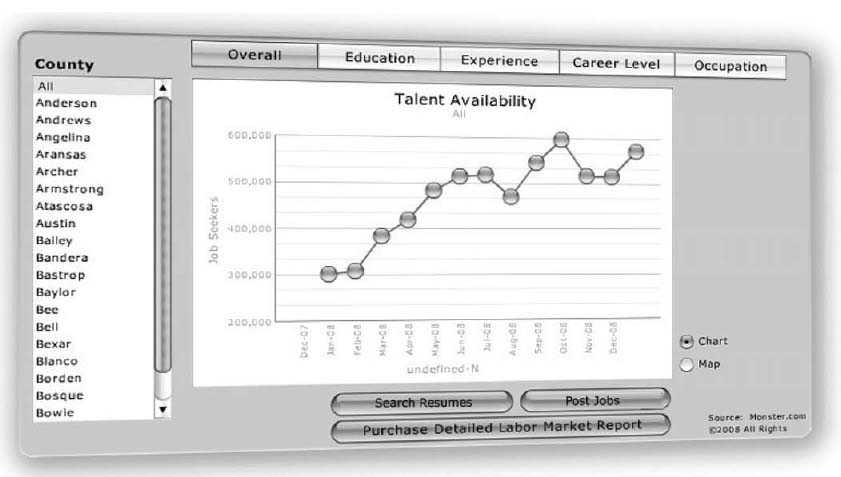
Monster also helps government leaders, business executives, and the economic and workforce development communities make fact-based decisions through its Monster Intelligence offerings. Monster customers use Monster’s Real-Time Labor Intelligence services to make fact-based human capital decisions, attract and develop new industries, leverage regional skill sets to put dislocated workers back to work faster, and anticipate emerging jobs and industry trends. Monster Intelligence does this through its research reports, data subscriptions, and custom engagements. Figure 8.1 is an example of Monster data.
In order to assist Enterprise with its site selection, Monster proposed a multipronged analytical framework that included the following steps. These steps, however, can be applied to any business situation that involves staff site selection. The analytical framework is discussed first, and then Enterprise’s specific situation is detailed.
The Business Need and the Capabilities Required
The initial step in any workforce planning–related exercise is to identify the business need being addressed and the capabilities and/or occupations that will help satisfy that business need. This step can take many forms, but at the most basic level it involves specifying the types of occupations likely to have the skills required to build the needed capabilities in the organization. Once those occupations have been identified, then a broad occupational overview for each is provided that includes:
Figure 8.1. Sample latent availability chart.
![]() Typical candidate profiles for this occupation
Typical candidate profiles for this occupation
![]() Sector-specific information that impacts hiring (e.g., increased outsourcing, technology advances, generational makeup of the workforce)
Sector-specific information that impacts hiring (e.g., increased outsourcing, technology advances, generational makeup of the workforce)
A Short List of Possible Site Locations
In order to analyze options efficiently, it is recommended that an organization identify three to six locations that will then be analyzed in detail to make a site recommendation. This is best done with a mix of qualitative and quantitative factors. Qualitative factors include things such as:
![]() The location of current company facilities and offices
The location of current company facilities and offices
![]() Locations that provide the company with a competitive or business-development advantage
Locations that provide the company with a competitive or business-development advantage
![]() Ease and/or cost of site location
Ease and/or cost of site location
![]() A company culture that fits with a location
A company culture that fits with a location
![]() Infrastructure (e.g., universities, public transportation, commercial real estate, airports)
Infrastructure (e.g., universities, public transportation, commercial real estate, airports)
![]() Local business and economic development incentives
Local business and economic development incentives
A short list of locations can also be created by identifying quantitative factors for each location and then sorting through them on the basis of those factors. Quantitative factors that can be used to rank locations in order of priority include:
![]() Unemployment rate
Unemployment rate
![]() Payroll change
Payroll change
![]() Rate of economic growth
Rate of economic growth
![]() Concentration of desired occupations in each market
Concentration of desired occupations in each market
![]() Typical annual salary of desired occupation
Typical annual salary of desired occupation
This type of location sorting should be used only as a preliminary step to focus in on markets that might be of interest for the organization. A much deeper analysis of each market will be needed in order to ascertain whether it represents an ideal location for the recruitment of talent.
Available Talent
After three to six locations have been selected for consideration, the next step is to evaluate and compare the talent pool across the locations. This is done in several ways.
![]() Calculate the talent density for each critical occupation. Talent density is defined as the total number of people working in an occupation in a location, divided by the total workforce for that location, then multiplied by 100. This figure is used to understand, all other things being equal, how difficult it would be for a company to recruit talent in one location compared to another location. The time series trend of this metric should also be examined to understand whether market conditions are changing for the better or for the worse.
Calculate the talent density for each critical occupation. Talent density is defined as the total number of people working in an occupation in a location, divided by the total workforce for that location, then multiplied by 100. This figure is used to understand, all other things being equal, how difficult it would be for a company to recruit talent in one location compared to another location. The time series trend of this metric should also be examined to understand whether market conditions are changing for the better or for the worse.
![]() Compare a national job search index for each critical occupation to a local job search index for each occupation. The job search index is calculated by taking the total number of job searches by occupation and by location, divided by the total for that location, then multiplied by 100. This metric is a direct measure of job-seeking activity and is an indicator of how likely a person with a particular occupation in a specific location is to apply for a job opening.
Compare a national job search index for each critical occupation to a local job search index for each occupation. The job search index is calculated by taking the total number of job searches by occupation and by location, divided by the total for that location, then multiplied by 100. This metric is a direct measure of job-seeking activity and is an indicator of how likely a person with a particular occupation in a specific location is to apply for a job opening.
![]() Prepare a talent profile for each critical occupation. In the course of evaluating a local market, it is important to understand the profile of the people your company would potentially be recruiting. In some cases, it is advisable to do a quick survey with talent in the local market to understand matters important to your company or to the recruitment processes. Factors to profile include:
Prepare a talent profile for each critical occupation. In the course of evaluating a local market, it is important to understand the profile of the people your company would potentially be recruiting. In some cases, it is advisable to do a quick survey with talent in the local market to understand matters important to your company or to the recruitment processes. Factors to profile include:
![]() Mobility of talent (e.g., willingness to relocate)
Mobility of talent (e.g., willingness to relocate)
![]() Full-time versus part-time or contract workers
Full-time versus part-time or contract workers
![]() Career level
Career level
![]() Education level
Education level
![]() Media habits and job-seeking behavior of talent
Media habits and job-seeking behavior of talent
![]() Salary requirements
Salary requirements
The Demand for Talent
In the same way that it is important to evaluate the supply of talent, it is equally important to evaluate the demand for talent. The demand for talent represents the amount of competition your company will experience should it choose to enter the local market. Therefore, knowing the demand trend is critical to understanding how successful a major recruiting initiative will be in each market. To do this:
![]() Evaluate posting trends over time for each critical occupation in order to understand whether demand for talent is slowing or intensifying.
Evaluate posting trends over time for each critical occupation in order to understand whether demand for talent is slowing or intensifying.
![]() Calculate the talent demand index for each occupation. The talent demand index is a calculation of the number of job postings over the total number in the occupation workforce, multiplied by 100. This metric should be compared to the national average, in existing corporate locations, as well as evaluated over time to understand whether the local market is in a state of transition.
Calculate the talent demand index for each occupation. The talent demand index is a calculation of the number of job postings over the total number in the occupation workforce, multiplied by 100. This metric should be compared to the national average, in existing corporate locations, as well as evaluated over time to understand whether the local market is in a state of transition.
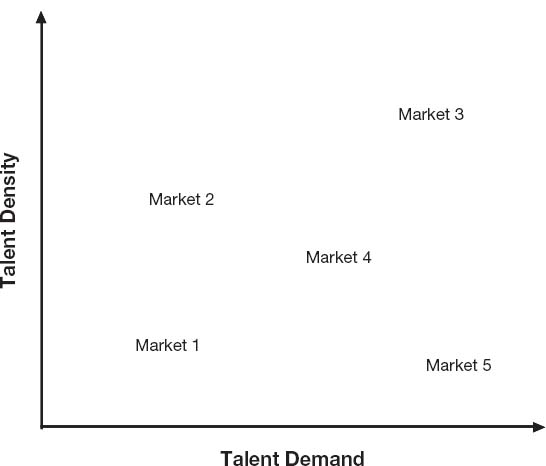
![]() Consider supply versus demand. Look at the labor conditions for each of the markets by plotting the markets in a graph similar to that shown in Figure 8.2, showing a simple talent-market plot. This will help you identify the relative competition for talent in each market.
Consider supply versus demand. Look at the labor conditions for each of the markets by plotting the markets in a graph similar to that shown in Figure 8.2, showing a simple talent-market plot. This will help you identify the relative competition for talent in each market.
The Economic Situation
It is helpful to summarize the economic conditions for each market as an aid in understanding the economic backdrop for each proposed site. Include the following in each market summary:
![]() Unemployment and payroll trends
Unemployment and payroll trends
![]() Major industries and employers of the region
Major industries and employers of the region
![]() Rate of economic growth or decline in the market
Rate of economic growth or decline in the market
![]() Basic demographics of the workforce
Basic demographics of the workforce
![]() Economic incentives for companies to locate in the region
Economic incentives for companies to locate in the region
![]() Cost of facilities/office space in the market
Cost of facilities/office space in the market
The Competition
An important step is to evaluate the potential competitors for talent in each market. This should be done in several ways.
![]() Use job-posting trends to identify your close competitors’ presence and recruitment activities in each location being considered.
Use job-posting trends to identify your close competitors’ presence and recruitment activities in each location being considered.
Figure 8.2. Talent density and demand by market.
![]() Identify which industries hire the most for the occupations your company will recruit to fill. Identify and profile top companies in each location being considered.
Identify which industries hire the most for the occupations your company will recruit to fill. Identify and profile top companies in each location being considered.
The Enterprise Analysis
Monster followed the analytical framework just outlined to provide actionable insight using real-time and historical data to support Enter-prise’s decision on where to locate its contact center. The first step was to identify the business need and capabilities required. That is, the new contact center would need to handle more than 10,000 reservations and customer-service calls per day. The services provided from this new center would include reservations assistance and customer support. Working with the Enterprise team, Monster identified the most critical occupations, including various career levels (e.g., entry-level, managers, directors) of customer-service representatives.
As the next step, Enterprise selected a short list of four possible site locations. For purposes of the case study, we call them Markets A, B, C, and D. Although Enterprise had narrowed the locations under consideration internally, the Enterprise team requested that Monster take an external view and compare these locations to other markets across the United States to ensure that all possibilities were evaluated and that no favorable location was overlooked.
When evaluating locations, it is important to understand the supply of talent to ensure that there is reasonable availability of people with the skills your company needs. As outlined in the analytical framework, Monster considered many metrics when reviewing the talent pool in each location. At the time of the analysis, Monster analyzed millions of candidates who would help fill Enterprise’s needs and uncovered the following:
![]() There were more than 3.5 million customer-service resumes in the Monster database, with an average of over 99,000 new resumes being added each month. This equated to about 177 customer-service resumes for each job posting on Monster.
There were more than 3.5 million customer-service resumes in the Monster database, with an average of over 99,000 new resumes being added each month. This equated to about 177 customer-service resumes for each job posting on Monster.
![]() On average, there were over 4.3 million customer-service job searches each month, and there were over 2 million job-search agents sent to candidates looking for similar jobs. Over 84 percent of these job-search agents were received daily via e-mail.
On average, there were over 4.3 million customer-service job searches each month, and there were over 2 million job-search agents sent to candidates looking for similar jobs. Over 84 percent of these job-search agents were received daily via e-mail.
Although Enterprise had identified four target locations, Monster provided information on other markets that had the most talent to support Enterprise’s hiring needs. That is, Monster reviewed the top locations with customer-service candidates listed on Monster and also the top locations with the largest year-over-year growth in customer-service resumes (see Figure 8.3). Monster also evaluated growth metrics for over 200 locations, allowing for market-to-market comparisons.
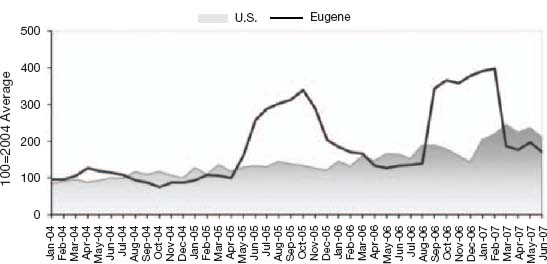
At the time of the analysis, there were nearly 3,000 customer-service resumes registered on Monster in Market A. But new resumes posted on Monster in Market A had slowed at the time of the analysis, dipping 10 percent compared to the same period the year prior (see Figure 8.4). Yet, on average, there were over 290 resumes per job posting in Market A, creating a solid supply opportunity for Enterprise. When compared to the national benchmark, Market A’s ratio of resumes per posting was very favorable, which led to further consideration of Market A as Enterprise’s new contact center.
In many cases, Monster evaluates additional talent-related metrics to assess a market for clients. Some of these additional talent-related factors include:
Figure 8.3. Top five customer-service resume locations, percentage change.
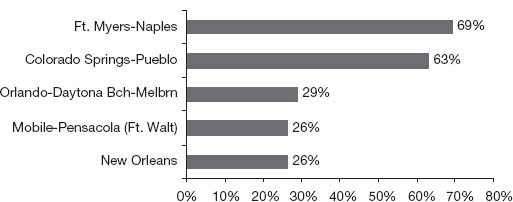
Source: Monster internal data.
![]() Desired Salary. For example, if a key occupation in one market has a median salary of $27,000 and an alternative market has a median salary of $44,500, the company could use this information to forecast its operating expenses.
Desired Salary. For example, if a key occupation in one market has a median salary of $27,000 and an alternative market has a median salary of $44,500, the company could use this information to forecast its operating expenses.
![]() Flexibility in Scheduling. The percentage of workers who desire a temporary, part-time, or full-time opportunity may differ significantly from market to market. If a company wishes to leverage a flexible work-force as part of its staffing strategy, this may be an important factor.
Flexibility in Scheduling. The percentage of workers who desire a temporary, part-time, or full-time opportunity may differ significantly from market to market. If a company wishes to leverage a flexible work-force as part of its staffing strategy, this may be an important factor.
Figure 8.4. Top resumes on Monster, 2004–2007.

Source: Monster internal data.
Monster assessed the demand for talent in each potential market. For example, it ranked over 200 markets based on the number of resumes per job posting and conducted additional analyses of the top twenty locations for 2007 with the highest resumes per job posting within the area of customer service and call centers (see Figure 8.5). The resumes per posting ratio is a critical metric to aid in understanding the demand for customer-service workers in different markets compared to a national benchmark. A high number of resumes per job posting indicates an abundant labor supply, thus a surplus of interested candidates.
Although the four markets on Enterprise’s short list did not fall within the top twenty markets nationally, Market A was ranked in the top 25 percent of the over 200 markets in terms of resumes per posting. Overall job postings on Monster in Market A had grown 12 percent over the same period a year earlier (see Figure 8.6). However, customer-service job postings in Market A grew at an even greater 27 percent over the same period the year before (see Figure 8.7). While 27 percent growth might be cause for alarm, the rate of job postings to labor supply was low compared to other markets. This lower level of demand for customer-service representatives, along with other talent-related factors, reinforced the standing of Market A as a top consideration.
Figure 8.5. Locations with highest resumes per posting, customer service and call center.

Source: Monster internal data, 2007.
Figure 8.6. Job postings on Monster, 2004–2007.
Source: Monster internal data.
Figure 8.7. Customer service and call center job postings on Monster, 2004–2007.
Source: Monster internal data.
Monster also analyzed the current economic trends related to customer-service and call-center occupations that could impact hiring for these critical occupations. Below are some key takeaways from the analysis at a national level, as well as for the key markets that were under consideration:
![]() As an industry, dedicated call centers had experienced a dip in employment over the past ten years. The last recession (2000–2002) hastened the automation and offshoring of traditional call-center services by a large contingent of American companies.
As an industry, dedicated call centers had experienced a dip in employment over the past ten years. The last recession (2000–2002) hastened the automation and offshoring of traditional call-center services by a large contingent of American companies.
![]() By the end of 2004, there were approximately 2.1 million customer-service representatives employed in the United States, which was 1.5 percent of the overall workforce.
By the end of 2004, there were approximately 2.1 million customer-service representatives employed in the United States, which was 1.5 percent of the overall workforce.
![]() Projected employment growth between 2004 and 2014 for the customer-service occupation was 23 percent greater than the average of all occupations (see Figure 8.8).
Projected employment growth between 2004 and 2014 for the customer-service occupation was 23 percent greater than the average of all occupations (see Figure 8.8).
![]() The state of Arizona had the highest concentration of customer-service representatives—2.7 percent of total state employment.
The state of Arizona had the highest concentration of customer-service representatives—2.7 percent of total state employment.
![]() Market D had the highest job growth, indicating a strong local economy where new job opportunities were being created at a rapid pace.
Market D had the highest job growth, indicating a strong local economy where new job opportunities were being created at a rapid pace.
![]() Market A’s metropolitan area jobless rate had decreased to 4.7 percent in May 2007, down from 5.1 percent a year earlier (see Figure 8.9). These numbers were considerably more favorable for recruiting compared to other markets under consideration. For example, at the time of the analysis, the Market D metropolitan area jobless rate was 3.0 percent.
Market A’s metropolitan area jobless rate had decreased to 4.7 percent in May 2007, down from 5.1 percent a year earlier (see Figure 8.9). These numbers were considerably more favorable for recruiting compared to other markets under consideration. For example, at the time of the analysis, the Market D metropolitan area jobless rate was 3.0 percent.
Figure 8.8. Call center employment, 1997–2007.
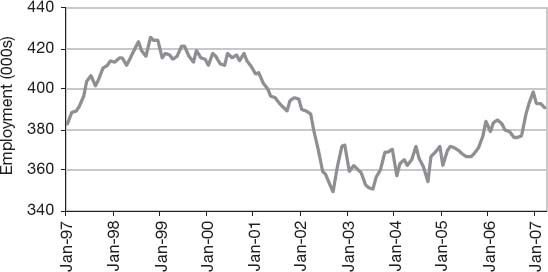
Source: Bureau of Labor Statistics, BLS.gov.
![]() Market A was the weakest of the four markets short-listed by Enterprise in terms of job creation. Payroll in Market A grew 1.1 percent year over year in May 2007, which was slower than the U.S. rate as a whole (see Figure 8.10).
Market A was the weakest of the four markets short-listed by Enterprise in terms of job creation. Payroll in Market A grew 1.1 percent year over year in May 2007, which was slower than the U.S. rate as a whole (see Figure 8.10).
Monster also looked at the competition for customer-service talent. It identified companies that had existing call centers or were in the process of opening up such facilities in the considered markets. For example, Market E and Market F (which were within fifty miles of Market D) had become home to over 200 new customer-service centers. The competition and cost for talent in these markets were much higher than in other markets, and this would be a key influencer in Enterprise’s decision. The favorable competitive situation in Market A, combined with many other factors, provided support for the recommendation that Enterprise select Market A as the location for its new customer contact center.
The Outcome
As a result of the thoughtful consideration of many factors, Enterprise selected Market A for its contact center. Enterprise chose that market for several reasons, including a strong labor supply relative to demand. Enterprise also found Market A to be a good site because of its proximity to a university, which provides a consistent source of educated and skilled employees who have flexible schedules and need part-time opportunities. “The workforce here is great,” said a local contact center director. “We’re so lucky to be in a city where we have access to a skilled, educated work-force.”
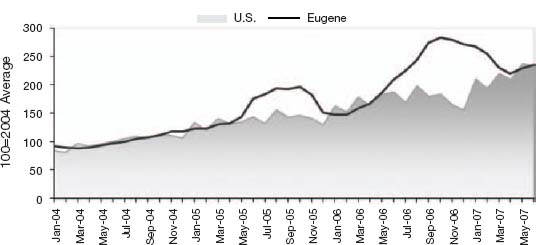
Figure 8.9. Unemployment rate, U.S. vs. Eugene-Springfield, Oregon.
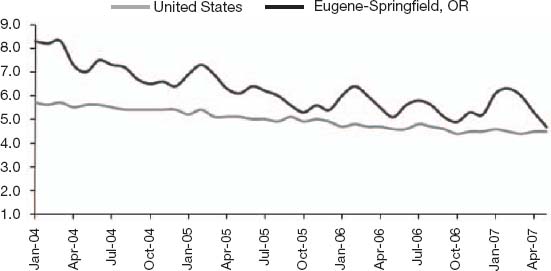
Source: Bureau of Labor Statistics, BLS.gov.
Figure 8.10. Growth in payroll employment, U.S. vs. Eugene-Springfield, Oregon.
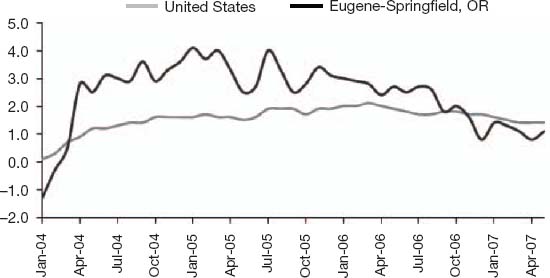
Source: Bureau of Labor Statistics, BLS.gov.
Enterprise chose a downtown location because of its business-friendly environment, great building, and accessibility to public transportation. The contact center brings hundreds of people to work downtown, which means that more people are spending money in the downtown area and encouraging further development in the process.
As far as the recruitment strategy to staff this new branch, Enterprise focused on a workforce with a slightly different profile from its other call centers. To supplement its primarily full-time team, Enterprise worked with the university to make opportunities available that were flexible and appealing to the students. Having access to an educated, flexible work-force allows Enterprise to maintain balanced coverage at the contact center without having to outsource—a practice that is typical in this industry.
The contact center began taking calls for Enterprise in April 2008. Employees at the new center now handle more than 10,000 reservations and customer-service calls a day for Enterprise, National, and Alamo. The performance of the contact center has been outstanding, with high customer-resolution rates and high employee and customer satisfaction. The care and diligence that Enterprise exercised in analyzing all of the factors in selecting a site led to a successful site implementation and resulted in a desirable business outcome.