
Chapter 1
Light and Photometry
"Streaming Lights" by Caitlin Shannon, 2007. Biomedical Photographic Communications student. Rochester Institute of Technology
Ithink George Eastman said it best, “Light makes photography. Embrace light. Admire it. Love it. But above all, know light. Know it for all you are worth, and you will know the key to photography.” So it is here we will start, with light and photometry.
The Nature of Light
Light is defined as the radiant energy that our visual system, our eyes, is sensitive to and depends upon for the sensation of vision.
Light is fundamental to photography. The function of photographic materials and digital sensors is to capture light and record the patterns it creates. The equipment we use to create images are lamps to produce light, exposure meters and color temperature meters, to measure and characterize the light and lenses, shutters, apertures and filters to control light. The study of photography must begin with understanding light.
The importance of light is obvious. Light has been the object of an enormous number of experiments and studies over many centuries. Isaac Newton was one of the first persons to make significant headway in understanding the nature of light. In the seventeenth century, Newton performed a series of experiments and proposed that light is emitted from a source in straight lines as a stream of particles.
This theory was called the corpuscular theory.
Light travels about 25,000 miles in 1/10 of a second. Sound would require about 33 hours to travel the same distance.
Any photographer knows that light bends when it passes from one medium to another, and that light passing through a very small aperture tends to spread out. These facts are not easily explained by the corpuscular theory. As a result, Christian Huygens proposed the wave theory, which stated that light and similar forms of electromagnetic radiation are transmitted as a waveform in some media. In the nineteenth century, Thomas Young performed a number of experiments that also supported the wave theory of light. The wave theory satisfactorily explained many of the phenomena associated with light that the corpuscular theory did not, but it still did not explain all of them.
One of the more notable unexplained effects is the behavior of black-body radiation. Blackbody radiation is radiation produced by a body that absorbs all the radiation that strikes it, and emits radiation by incandescence, depending on its temperature. In 1900, Max Planck suggested the hypothesis of the “quantization of energy” to explain the behavior of blackbody radiation. This theory states that the only possible energies that can be possessed by a ray of light are integral multiples of a quantum of energy.
In 1905, Albert Einstein proposed a return to the corpuscular theory of light with light consisting of photons, each photon containing a quantum of energy. These suggestions, along with others, gradually developed into what is known today as Quantum Theory or Quantum Electrodynamics. This theory combines aspects of the corpuscular and wave theories, and satisfactorily explains all of the known behavior of light.
Unfortunately, this theory is difficult to conceptualize, and can be rigorously explained only by the use of sophisticated mathematics. As a result, the corpuscular and wave theories are still used to some extent where simple explanations of the behavior of light are required.
Light Waves
If we accept the idea that light moves as a wave function, it is necessary to determine the nature of the waves and the relationship of light to other forms of radiation. Actually, light is a fractional part of a wide range of radiant energy that exists in the universe, all of which can be thought of as traveling in waves. These forms of energy travel at the tremendous speed of approximately 186,000 miles (3 × 10⁸ meters) per second. They differ only in wavelength and frequency of vibration. These waves have been shown to vibrate at right angles to their path of travel. The distance from the crest of one wave to the crest of the next is termed the wavelength represented by the Greek letter lambda (λ). Figure 1-1 illustrates this concept. The number of waves passing a given point in a second is called the frequency of vibration; the symbol f is used to specify it. The wavelength multiplied by the frequency of vibration equals the speed or velocity (symbol v) of the radiation. Thus, λ X f = v.

Figure 1-1 A simple form of a light wave, illustrated in a longitudinal cross section. In reality, the wave is vibrating in all possible right angles to the direction of travel. The second wave has a wavelength one-half that of the first and, therefore, a frequency twice as great.
Since the wavelength of radiant energy can be determined with far greater accuracy than the frequency, it is common practice to specify a particular type of radiation by its wavelength. Because of the extreme shortness of the wavelengths encountered with light sources, the most frequently employed unit of measure is the nanometer (nm), which is equal to one-billionth of a meter. A somewhat less commonly used measure is the Angstrom (Å), which is equal in distance to 1/10 of a nanometer (e.g., 400 nm equals 4,000 A). Table 1-1 summarizes these measurement concepts.
The Electromagnetic Spectrum
When the various forms of radiant energy are placed along a scale of wavelengths, the resulting continuum is called the electromagnetic spectrum. Although each form of radiant energy differs from its neighbors by an extremely small amount, it is useful to divide this spectrum into the generalized categories shown in Figure 1-2. All radiations are believed to be the result of electromagnetic oscillations. In the case of radio waves, the wavelengths are extremely long, being on the order of 1010 nm, and are the result of long electrical oscillations. The fact that such energy permeates our environment can easily be demonstrated by turning on a radio or television receiver in any part of the technologically developed world. This form of radiant energy is not believed to have any direct effect upon the human body. Radio waves are customarily characterized by their frequency, expressed in hertz (cycles per second).
| Unit | Symbol | Length |
| Meter | m | 3.218 ft. (38.6 in.) |
| Centimeter | cm | 0.01 m (10-2 m) |
| Millimeter | mm | 0.001 m (10-3 m) |
| Micrometer | µ (mu) | 0.000001 m (10-6 m) |
| Micron | µ (mu) | 0.000001 m (10-6 m) |
| Nanometer | nm | 0.000000001 m (10-9 m) |
| Millimicron | mµ | 0.000000001 m (10-9 m) |
| Angstrom | Å | 0.0000000001 m (10-10 m) |
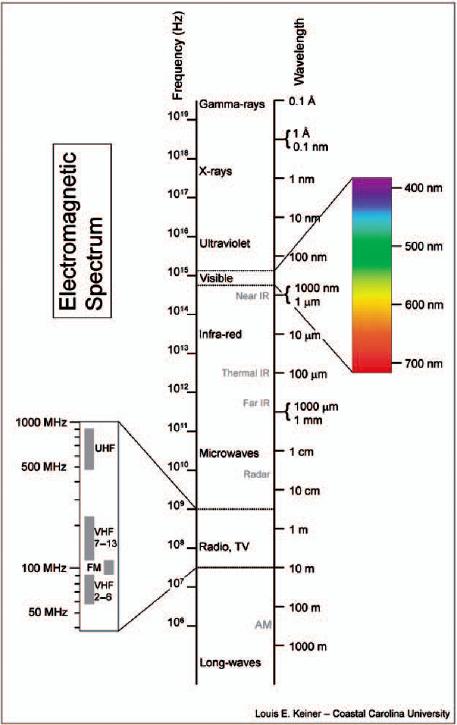
Figure 1-2 The electromagnetic spectrum.
The temperature of 273° C is referred to as absolute zero or 0 Kelvin (K), after Lord Kelvin, who first proposed such a scale.
The portion of the electromagnetic spectrum that we sense as heat is called the infrared region. The origin of this type of radiant energy, which is shorter in wavelength than radio waves, is believed to be the excitation of electrons by thermal disturbance. When these electrons absorb energy from their surroundings, they are placed in an elevated state of activity. When they suddenly return to their normal state, electromagnetic radiation is given off. It has been shown that any object at a temperature greater than -273° C will give off this type of radiation. Thus, all the objects we come into contact with give off some infrared energy. In general, the hotter an object, the more total energy it produces and the shorter the peak wavelength.
Although the terms UV light and black light are commonly seen in print, UV radiation is a more appropriate term.
If an object is heated to a high enough temperature, the wavelength of the energy emitted will become short enough to stimulate the retina of the human eye and cause the sensation of vision. It is this region of the electromagnetic spectrum that is termed light. Notice that it occupies only a narrow section of the spectrum between approximately 380 and 720 nm. Because the sensitivity of the human visual system is so low at these limits, 400 and 700 nm are generally considered to be more realistic values. Objects with very high temperatures produce ultraviolet energy, which is shorter than 400 nm in wavelength.
Light occupies a very small part of the electromagnetic spectrum generally from 400 to 700 nm.
To produce radiant energy shorter in wavelength than about 10 nm requires that fast-moving electrons bombard the object. When these rapidly moving electrons strike the object, the sudden stopping produces extremely short wave energy called X-radiation, or more commonly, X-rays. Still-shorter wavelengths can be produced if the electron bombardment intensifies, as occurs in a cyclotron. In addition, when radioactive material decomposes, it emits energy shorter in wavelength than X-rays. In these two cases, the energy is referred to as gamma rays, which are usually 0.000001 nm (10-6 nm) in wavelength and shorter. These forms of electromagnetic energy are the most energetic, penetrating radiation known.
Thus it can be seen that the wave theory of radiant energy provides a most useful system for classifying all the known forms of radiation.
The Visible Spectrum
The wavelengths of energy referred to as light are located near the middle of the electromagnetic spectrum. It is important to note that the location of this region is solely dictated by the response characteristics of the human eye. In fact, the international standard definition states: “Light is the aspect of radiant energy of which a human observer is aware through the visual sensations that arrive from the stimulation of the retina of the eye.” Simply stated, light is the energy that permits us to see. By definition, all light is visible, and for this reason the word visible is an unnecessary (and perhaps confusing) adjective in the common expression visible light. This definition also may be interpreted to mean that energy that is not visible cannot and should not be called light. Thus it is proper to speak of ultraviolet radiation and infrared radiation, not ultraviolet light and infrared light. The popular use of such phrases as black light and invisible light to describe such radiation makes it impossible to determine what type of energy is being described and should be avoided.
To understand more about light, it is necessary to become familiar with the way the human eye responds to it. Figure 1-3 represents the photopic luminosity function of the human eye as defined by the International Commission on Illumination (CIE). The plot illustrates the sensitivity of the eye to different wavelengths (or colors) of light. These data indicate that the sensitivity of the eye drops to near zero at both 400 and 700 nm, thus specifying the limits within which radiant energy may be referred to as light. It also shows that the response of the eye is not uniform throughout the visible spectrum. Human vision is most sensitive to green light. If equal physical amounts of different colors of light are presented to an observer, the green portion of the spectrum would appear the brightest, and the blue and red parts would appear very dim. This is the reason that a green safelight is used when processing panchromatic film. Since the eye is most sensitive to green light, it takes less of it to provide adequate visibility in the darkroom than any other color of light.
The plot shown in Figure 1-3 has been accepted as an international standard response function for the measurement of light. Therefore, any meter intended for the measurement of light must possess a sensitivity function identical to it. Most photoelectric meters used in photography have response functions significantly different from the standard and are not properly called light meters, although the international standard curve can be approximated by the use of appropriate filters with some meters. (It is worth noting that the determination of the proper f-number and shutter speed for a given photographic situation does not require a meter with this response function. It is more important for the meter to match the sensitivity of the film or digital sensor being used than that of the human eye.)

Figure 1-3 The sensitivity curve of the human eye. The plot indicates the relative brightness of the energy at each wavelength.
When all of the wavelengths between 400 and 700 nm are presented to the eye in nearly equal amounts, the light is perceived as white. There is no absolute standard for white light because the human visual system easily adapts to changing conditions in order to obtain the perception of whiteness. For example, the amounts of red, green, and blue light in daylight are significantly different from those of tungsten light; however, both can be perceived as white due to physiological adaptation and the psychological phenomenon known as color constancy. (See Figure 1-4.) Thus our eyes easily adapt to any reasonably uniform amount of red, green, and blue light in the prevailing illumination. This means that our eyes are not reliable for judging the color quality of the prevailing illumination for the purposes of color photography.

Figure 1-4 Spectral power distributions of a tungsten and daylight light source.
If a beam of white light is allowed to pass through a glass prism as illustrated in Figure 1-5, the light is dispersed into a series of colors we call the visible spectrum. This separation of colors occurs because lights of varying wavelengths are bent by different amounts. The shorter-wavelength blue light is bent to a greater extent than the longer-wavelength green and red light. The result is a rainbow of colors that range from a deep violet to a deep red. Experiments indicate that human observers can distinguish nearly one hundred different spectrum colors. However, the visible spectrum is often arbitrarily divided into the seven colors listed in Figure 1-5.
To describe the properties of color photographic systems in simple terms, the spectrum is divided into just three regions: red, green, and blue. The color of the light may also be specified at a given wavelength, thereby defining a spectral color. Such colors are the purest possible because they are unaffected by mixture with light of other wavelengths. It is also possible to specify a certain region or color of the spectrum by the bandwidth of the wavelengths. For example, the red portion of the spectrum could be specified as the region from 600 to 700 nm.

Figure 1-5 The dispersion of white light into the visible spectrum.
Spectral Power Distributions
All forms of light can be identified by their spectral power distributions. If we accept that white light can be dispersed into the individual wavelengths of visible spectrum as illustrated in Figure 1-5, then it follows that it can also be measured at each of these wavelengths. When this is done the resulting measurement is called a spectral power distribution (SPD). An SPD is measured with a spectrophotometer, which measures a light source as a function of wavelength. Figure 1-3, seen previously, provides the SPD for a tungsten and a daylight light source. Notice that the tungsten light source is smooth and is referred to as a continuous light source. It simulates a blackbody radiator.
Planck’s equation (Eq. 1-1) can be used to determine the SPD of a black-body radiator at any temperature. As can be seen in the equation, all the terms are constant except for wavelength.
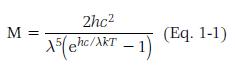
where h is Planck’s constant of 6.6262 · 10-34 J-s
c is the speed of light with a value of 2.9979 · 108 m/s
λ is the wavelength of energy in meters
k is Boltzmann’s constant of 1.3807 ·
10-23 J/K, and
T is the absolute temperature of the light source in degrees Kelvin.
Solid-Object Sources and the Heat-Light Relationship
Light is a form of energy that can only be produced from some other form of energy. The simplest and perhaps most common method is from heat energy, a process called incandescence. Whether the source is the filament in a tungsten lamp, a candle flame, or anything that has been heated until it glows, incandescence is always associated with heat. The amount and color of light produced by an incandescent source is directly related to the temperature to which it is heated. Consider, for example, an iron poker with one end placed in a fire. Holding the end of the poker in the fire, it is cold, but as it is left in the fire its temperature rises and it begins to feel warm. By increasing the temperature of the poker, we become aware of a change in its radiating properties through our sense of touch, although it looks the same. Soon the poker will become too hot to touch, and we will be able to sense its radiation as heat at a short distance. As the temperature is raised even higher, the poker reaches its point of incandescence and begins to emit a deep red glow. If the poker is allowed to get hotter still, the color of the light it produces will become more yellowish, and the light will become brighter. At extremely high temperatures, the end of the poker will look white, and ultimately blue, in addition to becoming still brighter. All of this illustrates that a solid object heated to its point of incandescence and higher will produce light that varies in color as a function of its temperature. When describing the temperature of such sources, it is common practice to employ the absolute or Kelvin scale because all objects emit some infrared energy at temperatures above absolute zero.
Two hundred years before Newton, Leonardo da Vinci discovered that white light contains different colors, but he identified only five colors.
All objects emit radiation at room temperature, but objects must be heated to a temperature of approximately 12,000° Fahrenheit before visible radiation is emitted.
The best solid-object radiator is a black body, as it absorbs all the energy that strikes it. All light sources are radiators, some of which are more efficient than others. Thus, since a perfectly black object would absorb and emit energy but not reflect it when heated, it would be the most efficient source. A blackbody source is achieved in practice by the design shown in Figure 1-6. An enclosure surrounded by a boiling material becomes the source. Since the interior surface of the object is darkened and everywhere concave, any light that enters will be absorbed, either immediately or after one or more reflections. Consequently the hole will appear perfectly black. As the walls of the oven are heated, they will emit radiant energy in all directions. The energy that escapes through the hole is called blackbody radiation. When such an experiment is performed and the blackbody is heated to a variety of temperatures, the characteristics of the radiant energy it produces change systematically, as shown in Figure 1-7. Each individual curve is often referred to as a spectral power distribution (SPD). An SPD provides the level of radiant power emitted by the source at each wavelength.

Figure 1-6 Cross section of a simple blackbody radiator consisting of an enclosure surrounded by boiling or molten material.

Figure 1-7 Spectral-energy curves for a blackbody at various temperatures.
Emissivity is the ratio of energy radiated by a material to the energy radiated by a blackbody at the same temperature.
As discussed previously, every object emits energy from its surface in the form of a spectrum of differing wavelengths and intensities when heated to temperatures greater than -273° C (absolute zero). The exact spectrum emitted by the object depends upon its absolute temperature and its emissivity (the ratio of energy radiated by a material to the energy radiated by a blackbody at the same temperature). Since the blackbody has perfect emissivity (ε=1), the temperature in degrees Kelvin becomes the only important factor. Figure 1-7 shows that as the temperature increases, each curve increases everywhere, indicating that the amount of energy at each wavelength increases. As the temperature increases, the peak output wavelength becomes shorter. The peak position shifts from the long-wavelength end of the infrared region toward the short-wavelength end of the ultraviolet region as the temperature increases. The portion of emitted energy that would be perceived as light is contained within the narrow band between the broken lines.
Solids emit continuous spectrums. Gases and vapors emit discontinuous spectrums.
We have enough knowledge to make some observations now. First, all objects we are likely to encounter are at temperatures greater than -273° C and are emitting some form of radiant energy, principally in the long-wave-length infrared region. For example, the human body at a temperature of 98.6° F (40° C, 313 K) emits infrared energy from 4000 to 20,000 nm, with the peak output at approximately 9600 nm. Second, most objects must be heated to a temperature of greater than 1000 K (727° C, 1340° F) in order to give off energy at wavelengths short enough to be sensed by the human eye. For example, iron begins to glow red when it is heated to a temperature of about 1200 K, and a typical household tungsten lamp operates at a filament temperature of nearly 3000 K. Both sources will emit large amounts of infrared energy in addition to the visible energy. Third, in order for a solid-object source to emit ultraviolet energy it must be heated to extremely high temperatures. Since tungsten steel melts at 3650 K, incandescent sources are not typically used when large amounts of ultraviolet energy are needed.
Vapor Sources and the Effect of Electrical Discharge
A fundamentally different method for producing light makes use of radiation emitted from gases when an electrical current is passed through them. Such sources are called discharge lamps and generally consist of a glass tube containing an inert gas, with an electrode at each end. An electrical current is passed through the gas to produce light and ultraviolet energy. This energy may be used directly or to excite phosphors coated on the inside of the glass tube, as in a fluorescent lamp.
The basic process involved in producing light is the same for all vapor lamps. The light emission from the vapor is caused by the transition of electrons from one energy state to another. When the electrical current is applied to the lamp, a free electron leaves one of the electrodes at high speed and collides with one of the valence electrons of the vapor atom. The electron from the vapor atom is bumped from its normal energy level to a higher one and exists for a short time in an excited state. After the collision, the free electron is deflected and moves in a new direction at reduced speed. However, it will excite several more electrons before it completes its path through the lamp. The excited electron eventually drops back to its former energy level and, while doing so, emits some electromagnetic radiation.
The radiation emitted may be at any of several wavelengths, depending primarily upon the properties of the vapor in the tube. Each type of vapor atom, when excited, gives off energy at wavelengths determined by its structure. Some gases emit radiation only at a few wavelengths, while others emit energy at many different wavelengths. These sources are said to show a discontinuous or line spectrum. For example, the spectrum of sodium vapor shows a bright yellow line near 600 nm, as shown in Figure 1-8, while mercury vapor produces energy at many different wavelengths, both in the ultraviolet region and in the visible region, as illustrated in Figure 1-9.

Figure 1-8 Spectral-energy distribution of a low-pressure sodium-vapor source. Such sources appear yellow.
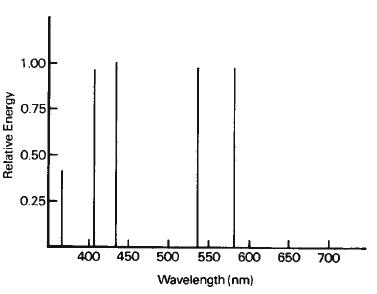
Figure 1-9 Spectral-energy distribution of a low-pressure mercury-vapor source. This source would appear violet.
The pressure under which the vapor is dispersed in the tube significantly affects the amount of energy that will be emitted. The terms low pressure and high pressure are often used to describe such lamps; low pressure indicates some small fraction of atmospheric pressure, while high pressure is applied to sources working above atmospheric pressure. High-pressure sodium-vapor lamps are often used for illuminating streets at night. Low-pressure sodium-vapor lamps are often used as safelights in photographic darkrooms when working with ortho-chromatic materials because they produce light in regions of the spectrum where the emulsion shows low sensitivity. High-pressure mercury-vapor sources are often used when making blueprints, while low-pressure mercury-vapor sources are used in greenhouses as plant lights because the ultraviolet energy they emit is beneficial to plant growth. It is important to note that the spectral characteristics of the radiation emitted by these sources depends primarily upon the properties of the vapor in the tube.
Perhaps the most commonly encountered vapor source is the fluorescent lamp. These are typically low-pressure mercury-vapor tubes that have phosphors coated on the inside of the glass envelope. When bombarded by the large amount of ultraviolet radiation emitted by the mercury vapor, these phosphors begin to glow and give off visible energy at all wavelengths in the visible spectrum. Thus, the light emitted by a fluorescent lamp is the result of both the discontinuous energy emitted by the vapor and the continuous energy emitted by the fluorescing phosphors.
There are many classes of phosphors that can be used for this purpose, with each phosphor emitting its own color of light. Figure 1-10 illustrates the spectral energy distribution for a typical cool white fluorescent lamp. The light that corresponds to the discontinuous line spectrum produced by the mercury vapor may not be apparent to a human observer because of the ability of the visual system to adapt to variations in the color balance of white light. Photographic films do not have this capability. Therefore, color transparencies made on daylight-type color film with daylight fluorescent illumination tend to have a greenish cast unless an appropriate filter is used.
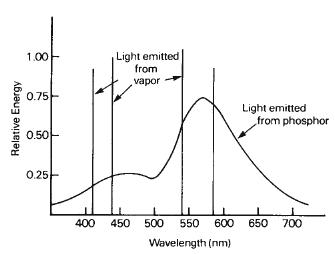
Figure 1-10 Spectral energy distribution of a cool white fluorescent lamp.
Luminescence/ Fluorescence/ Phosphorescence
Luminescence can be described as the emission of light from a substance that has not been heated or light caused by something other than incandescence. Luminescence is a form of cold body radiation, as it usually occurs at low temperatures. It is generally caused by the emission of photons from atoms by exciting them with energy of relatively short wavelengths. As the electrons return to a lower energy level, energy of longer wavelengths is released. The rate at which this occurs can be affected by the presence of an activator, which is made up of ionized atoms that trap, then release the electrons slowly for recombination. The exciting energy is usually in the ultraviolet region, but can be caused by energy in the visible and infrared regions. There are many forms of luminescence.
Chemiluminescence occurs as the result of a chemical reaction and is the emission of light without the emission of heat. A common example of che-miluminescence is found in forensics laboratories that use luminol to test for the presence of blood. The blood glows when it comes in contact with the iron in the luminol. When chemilumines-cence happens in a living organism it is called bioluminescense. Bioluminescence is the result of biochemical reactions and is typically seen in fireflies and glowworms. Galvanoluminescence is light produced by passing an electrical current through an electrolyte that has a submersed electrode made of an appropriate metal, such as aluminum. When vacuum-tube rectifiers were common, this was the “glow” seen when they were operating. Triboluminescence occurs when rubbing breaks the asymmetrical bonds in a crystal, crushing or breaking the material. Examples would be the grinding of sugar with a mortar and pestle or the sparks seen when biting into a Wint-O-Green Life Savers. Solid substances that luminesce are called phosphors. Photographers are most concerned with the luminescence that occurs as a result of excitation with ultraviolet energy and light.
Photoluminescence, which include fluorescence and phosphorescence, is caused by a chemical compound absorbing photons, which elevates it to a higher energy state, where the light photons are given off until the compound returns to its original energy state. The length of time this takes is typically around 10 nanoseconds.
Fluorescence is luminescent emission of electromagnetic radiation in the visible region that occurs during the time of excitation. Thus, phosphors that are radiated with ultraviolet energy fluoresce. When the excitation is stopped, the fluorescence ceases within about 10-8 seconds, but it sometimes continues for as long as 10-1 seconds, depending on the activator.
Phosphorescence is the emission occurring after the excitation has been stopped, and which continues for somewhat longer than 10-8 seconds up to several hours. The duration strongly depends on temperature. Phosphorescence is similar to fluorescence, but has a slower rate of decay. A common example of phosphorescence is glow-in-the- dark toys for children.
Brighteners in photographic papers fluoresce to produce whiter whites.
Some dyes fluoresce, including fluorescein, eosin, rhodamine, and a series of dyes (and other materials) that are used as brighteners in substances such as paper and cloth. Photographic papers may contain brighteners to give them cleaner and more brilliant whites. Most modern papers are treated with brighteners, a distinguishing characteristic when comparing modern prints to those made thirty or forty years ago, without brighteners. The occurrence of bright-eners in fabrics and similar materials can present problems in color photography when the ultraviolet component of electronic flash energy (or other light sources) causes them to fluoresce, most often in the blue region of the spectrum. This has a strong effect on the reproduced color of the material, often rendering it blue or cyan when the other materials in the scene have been reproduced satisfactorily in the photograph. The effect is minimized or eliminated by the use of an ultraviolet-absorbing filter over the electronic flash, or other source, to prevent it from exciting the fluorescing dyes or pigments in the material. An ultraviolet filter over the camera lens in this case would not correct for the fluorescence.
Brighteners in clothing, paper products, hair rinses, etc., can adversely affect the color of the objects in color photographs.
Fluorescent lamps excite gas molecules within the tube by means of electrons, to produce energy of discrete wavelengths, or lines, largely in the blue and ultraviolet regions (but this depends to a great extent on the gas elements in the tube). Some of this energy is absorbed by phosphors coated on the inside of the tube and is converted to longer-wavelength (visible) radiation. The color of the fluorescent emission is highly dependent on the phosphor material, and the activators incorporated in it.
Fluorescing screens are used extensively in radiography. In this application, they are called intensifying screens. They fluoresce when activated by the X-rays used for exposure, and the visible radiation from the screens is considerably more effective in exposing photographic emulsions than the X-rays themselves. The screens are placed in contact with both sides of the film, in the film holder, during exposure.
As color temperature increases, the color balance of the light shifts from reddish to bluish.
The Use of Color Temperature
Tungsten color film can be used in daylight by using a filter that converts daylight to tungsten-quality light.
Because the amount and color of radiation emitted by a solid-object source is very much temperature-dependent, the color of light being emitted from such a source can be completely specified by the Kelvin temperature (K) at which it is operating. Such a rating is referred to as the color temperature of the source. A color temperature may be assigned to any light source by matching it visually to a blackbody radiator. The temperature of the blackbody radiator is raised until the color of its light visually matches that from the lamp, and the Kelvin temperature of the black-body is then assigned as the color temperature of the lamp. Thus, the use of color temperature ratings in photography presumes that the lamp being described adheres to the same heat-to-light relationship as does the black-body radiator, meaning the plot of their spectral power distributions are continuous as is the blackbody radiation in Figure 1-7. For incandescent lamps, this presumption is correct. However, the color of light emitted by some sources, such as fluorescent lamps, has no relationship to the operating temperature. (See Figures 1-8 and 1-9.) In these cases, the term correlated color temperature (CCT) is used to indicate that the color of light emitted by a blackbody radiator of that temperature produces the closest visual match that can be made with the source in question. It is important to note here that a visual match of two sources does not ensure a photographic match. In fact, in most cases the photographic results will be different.
An orange 85B filter converts daylight to tungsten quality. A bluish 80A filter converts tungsten light to daylight quality.
Table 1-2 The color temperatures of some common light sources
| Source | Color Temperature ° K | Mired Value |
| Candle | 1800-1900 | 555-526 |
| Tungsten lamp | 2800 | 357 |
| CIE Tungsten illuminant or | 2856 | 350 |
| Illuminant A | ||
| 250-watt photographic lamp | 3200 | 312 |
| 250-watt studio flood lamp | 3400 | 294 |
| CIE Cool White Fluorescent | 4100 | 244 |
| Direct sunlight | 4500 | 222 |
| CIE D50 or horizon light | 5000 | 200 |
| Electronic flash | 5500-6000 | 182-166 |
| CIE D65 of noon daylight | 6500 | 154 |
| Sky light (overcast sky) | 8000 | 125 |
| North sky light | 15,000 (approximately) | 67 |
The color temperatures of a variety of light sources are given in Table 1-2. It is apparent that photographers are faced with a tremendous range of color temperatures, from the yellowish color of a candle at about 1800 K to the bluish appearance of north sky light, rated at 15,000 K. Notice that as color temperature increases, the color of light emitted from the source shifts from red to white to blue in appearance. For photographers to produce excellent photographs under widely varying illuminant conditions, color films are designed for use with different color temperatures, such as tungsten or daylight. The actual color temperature encountered from a lamp in practice can vary significantly as a result of reflector and diffuser characteristics, changes in the power supply, and the age of the bulb. Consequently, it is often necessary to measure the color temperature of the source with a color-temperature meter when using color films.
Modern color-temperature meters typically use three silicon photodiodes that are filtered for the red, green and blue sensitivities that approximate the sensitivity of color film. The meter will measure the amount of energy present in the three regions and determine the color temperature by finding the closest match to a blackbody curve. Meters will either provide a color temperature, a mired shift, or a Wratten filter number to achieve the desired color temperature. These meters are intended to be used with continuous spectral power distribution. However, when used with vapor sources that produce a discontinuous spectral power distribution, the results may be very misleading because of significant differences in the measured response compared to the blackbody curves.
When the color temperature of the light from a solid-object source does not match the response of the film, light-balancing filters must be used over the camera lens. If the color temperature is too high, a yellow filter over the camera lens will lower the color temperature of the light that the film receives. If the color temperature of the light is too low, a blue filter can be used to raise it. If the filters are desaturated in color, then the changes to color temperature will be relatively small, whereas saturated filters will give large changes in color temperature.
The filters necessary to properly correct the color of light from vapor sources, such as fluorescent lamps, must either be determined from the manufacturer's literature or from tests performed with the color film itself.
A mired is defined as 106/K.
When the color temperature of the light does not match the response of the camera's digital sensor, the photographer has several options. Most digital SLR cameras have several built-in white balance settings that correspond to specific color temperatures, such as sunny daylight, cloudy daylight, indoor incandescent, or indoor fluorescent. The photographer can choose the white balance setting that corresponds to the situation. This may or may not give satisfactory results. Consider indoor incandescent light. The published color temperature for an incandescent bulb in my living room is 2850 K and the incandescent setting on my camera is calibrated to 3000 K. This discrepancy may cause a color cast in the image. The second option that is available on many digital cameras is a custom white balance setting. The camera is aimed at an object in the scene that is white, and this is selected as the white balance for the image. Done correctly, this method will produce excellent results. The third option is to capture the image in raw format and color-correct the image later using editing software.
A mired shift is the mired value difference between two light sources.
A Wratten filter number is the common labeling system used for optical filters in photography.
The Mired Scale
10 Mireds = 1 Decamired.
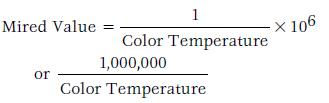
Although color temperature provides a useful scale for classifying the light from continuous-spectrum sources, it does have some limitations. For example, a 500 K change at the 3000 K level does not produce the same visual or photographic effect as a 500 K change at the 7000 K level. This is because there is a nonlinear relationship between changes in a source’s color temperature and the changes in the color of light it produces, which is illustrated in Figure 1-11.
Mired is an acronym for the term micro-reciprocal-degrees.
This awkwardness can be eliminated through use of the mired value. The mired value is the reciprocal of the color temperature and has a nearly linear relationship existing between this value and the effect. The reciprocal of color temperature would be quite small, so it is commonly multiplied by 1 million to obtain a number of an appropriate size. Therefore, to convert color temperatures to the mired scale, the following formula is used:
(Eq.1-2)
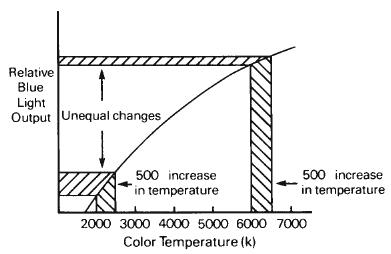
Figure 1-11 The relationship between color temperature and the relative amount of blue light being given off by a solid-object source.

Figure 1-12 The relationship between mireds and the relative amount of blue light given off by a solid-object source.
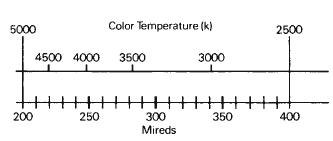
Figure 1-13 Comparison of color temperature and mired scale.
The term decamireds is sometimes used for convenience; each decamired contains 10 mireds. For example, the mired value for a color temperature of 12,5000 K is 80 mireds or 8 decamireds.
Figure 1-12 illustrates the relationship between changes on the mired scale and changes in the resulting effect. It shows that equal changes in the mired scale produce equal changes in the effect. The relationship between color temperature and mireds is illustrated in Figure 1-13, which indicates that the higher the color temperature, the lower the mired value. Consequently, bluish sources with very high color temperatures will have very low mired values, while reddish-appearing sources with low color temperatures will have high mired values.
The mired scale is most frequently used for color-compensating filters that are intended to correct the color of light from a source to match the response of color film. These filters are given a mired shift value (MSV). This value indicates the change in the color of the light that will result when using that filter. Bluish filters that are used to lower color temperature are given negative values while amber or yellow filters that raise color temperature are given positive values.
The equation used to determine the mired shift required, and hence the filters needed, to correct the color temperature of one light source (CT1) to the color temperature of a second light source (CT2) is:

(Eq.1-3)
For example, if it is desired to expose a daylight color film balanced for 5500 K with a tungsten lamp operating at 3000 K, a color correction filter will be necessary to obtain the proper color balance. The color temperatures are converted to mired values using Eq. 1-3, as shown below:

Thus, to correct this light source, a filter providing a mired shift of -151 would have to be used over the camera lens. The filter manufacturer's data sheet will provide the information necessary to determine the appropriate filter for this mired shift value. A major benefit of using the mired scale for designating filters is that a given mired change will have the same effect on the color of the light from solid-object sources at any color temperature.
The color-temperature meters discussed previously often read out directly in mired values, and the mired shift can be calculated from that.
Color-Rendering Index
Correlated color-temperature (CCT) specifications work quite well for describing the visual appearance of vapor and fluorescent sources. However, when considering the way an object's color appears under a specific light source, CCTs are often misleading. A color rendering index (CRI) was developed by the CIE to evaluate a light source's ability to accurately reproduce the perceived color of an object when compared to a standard light source. For light sources with a color temperature between 2000 and 5000 K, the standard is the blackbody radiator. For sources above 5000 K, the standard is D65.
A CRI value of 100 means there is no color difference between the light source being evaluated and the standard light source. By definition, a tungsten or incandescent light source has a CRI near 100, as the CRI was designed to evaluate continuous spectrum sources.
Daylight has a higher color temperature than tungsten light—and a lower mired value.
Since fluorescent lamps do not follow the energy-emission properties of a blackbody radiator, CCTs do not indicate the amount of energy being produced at each wavelength. For example, the spectral energy distributions for two fluorescent lamps of equal correlated color temperature (4200 K) are shown in Figure 1-14. Note that the lamp labeled Cool White Deluxe is producing more red light than the lamp labeled Cool White, which would result in widely different color rendering for some objects. For example, if a person's face were illuminated by these sources, the Cool White Deluxe lamp would provide more red light, resulting in a healthier, more natural skin-complexion appearance than that given by the Cool White lamp.

Figure 1-14 Spectral-energy distributions for two fluorescent lamps with same correlated color temperature (4200 K).
Determining the color rendering index, R, for any given light source requires that the spectral energy distribution and the correlated color temperature are known, so that an appropriate reference source can be selected. In this method, eight arbitrary Munsell color samples are used, and the CIE chromaticities under the given source are calculated. A similar set of calculations under the selected reference source will give eight different CIE chromaticities. The differences between the two sets of data indicate the color shift of the given light source in relation to the reference source. The eight differences are then averaged to arrive at the color-rendering index, R.
The Munsell color system is a color space that specifies color based on their hue, value, and chroma.
The R value is based upon an arbitrary scale that places a specific warm white fluorescent lamp with a correlated color temperature of 3000 K at R = 50 and the reference source at R = 100. The reference source always has an R equal to 100. Thus, the higher the R value for a given source, the more closely object colors will appear to their counterparts under the reference source, and, therefore, the better the color rendition. The color rendering indexes for a variety of fluorescent lamps are given in Table 1-3.
Table 1-3 The correlated color temperatures and color rendering indexes for a variety of fluorescent lamps
| Correlated Color | Color | |
| Lamp Name | Temperature | Rendering Index |
| Warm whi te | 3000 K | R = 53 |
| Warm whi te—deluxe | 2900 K | R = 75 |
| White | 3500 K | R = 60 |
| Cool white | 4200 K | R = 66 |
| Cool whi te—deluxe | 4200 K | R = 90 |
| Daylight | 7000 K | R = 80 |
Some limitations to this concept should be noted. First, since the calculated R value is obtained in relation to a reference source, two given sources can only be compared to each other if their reference sources are similar (within approximately 200 K). Second, since the R value is an average taken from eight different colors, it does not specify the performance of the source on a specific color. Third, the R value is based upon the visual appearance of the object colors and not their photographic appearance. Thus, a source can have a high R value (90 or greater) and not give desirable color reproduction in a color photograph.
The Polarization of Light
As discussed previously, light, like other forms of radiation in the electromagnetic spectrum, is believed to move in a wave motion. The vibrations of these waves occur in all directions at right angles to the path of travel, as illustrated by the light beam to the left of the filter in Figure 1-15. This is described as an unpolarized light beam. However, the wave can be made to vibrate in one direction only, and when this occurs, the light is said to be polarized. The light beam on the right of the filter in Figure 1-15 illustrates this condition. Such polarization of light occurs naturally in a number of ways described below.
1.Light emitted from a portion of clear blue sky, at right angles to a line connecting the viewer (or camera) and the sun, is highly polarized. The scattering of the light rays is caused by very small particles in the atmosphere such as dust and molecules of water vapor and other gases. As the angle decreases, the effect also decreases, as illustrated in Figure 1-16. Thus, a portion of the light blue sky encountered in typical outdoor scenes is polarized.
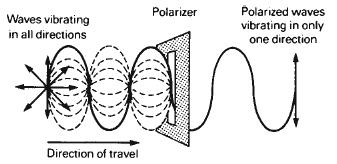
Figure 1-15 The polarization of light.
2.Light becomes polarized when it is reflected from a flat, glossy, non-metallic surface, such as glass, water, and shiny plastics. This effect is maximized at an angle whose tangent is equal to the refractive index of the reflecting material; this is known as the Brewster angle. For common surfaces, such as glass and water, this angle is approximately 55° from the perpendicular (35° from the surface) and is illustrated in Figure 1-17.
3.Light becomes polarized when it is transmitted through certain natural crystals or commercially manufactured polarizing filters. Among the substances having the ability to polarize light are the dichroic crystals, particularly the mineral tourmaline. When a beam of unpolarized light passes through a thin slab of tourmaline, it becomes polarized. This property can be demonstrated by rotating a second slab of tourmaline across the direction of polarization, as illustrated in Figure 1-18. When the second slab is rotated to a position of 90° from that of the first, no light will be transmitted through the second filter. Commercially available polarizing filters are made from dicrylic substances whose chemical composition calls for the grouping of parallel molecular chains within the filter. This is the nature of the filters illustrated in Figures 1-15 through 1-19.

Figure 1-16 The polarization of sky light.

Figure 1-17 The polarization of light reflected from a glossy surface.
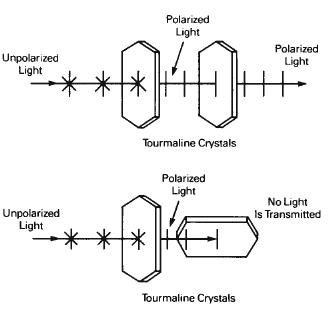
Figure 1-18 The polarizing effect of a tourmaline crystal.
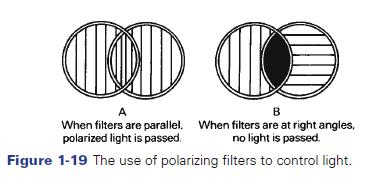
Figure 1-19 The use of polarizing filters to control light

Figure 1-20 A polarizing filter was used to take the photograph on the right. The sky is significantly darker. (Photographs provided by Professor Stephen J. Diehl, Rochester Institute of Technology)
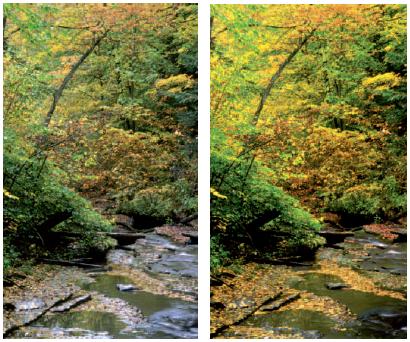
Figure 1-21 A polarizing filter was used to take the photograph on the right. The colors in the image are more saturated by removing glare with a polarizing filter . (Photographs provided by Professor Stephen J. Diehl, Rochester Institute of Technology)
Polarized light will become depolarized when it strikes a scattering medium. This most frequently occurs when the light is reflected from a matte surface, such as a sheet of white blotting paper. It can also be depolarized upon transmission through a translucent material, such as a sheet of matte acetate.
The phenomenon of polarized light provides the photographer with a very useful tool for controlling light. For example, a polarizing filter will absorb light that is in one plane of polarization. If the plane of polarization of the filter and the plane of polarization of the light are the same, the maximum amount of light will be transmitted. However, if they are at right angles to each other, no light will pass, as shown in Figure 1-19. At angles between these two, varying amounts of light will be transmitted, allowing for the useful control of light. Thus, polarizing filters can be thought of as variable neutral density filters. Figure 1-20 illustrates the effect that a polarizing filter has on blue sky. The effect on the sky can be dramatic as shown. Figure 1-21 shows the use of a polarizing filter to reduce the glare off the tree and dramatically enhance the colors in the image.
Practical Sources of Light and their Properties
Thus far, the discussion of light has centered on methods of production, properties, and measurement. At this point, we will consider some practical sources of light commonly encountered by the photographer.
Daylight
Daylight is usually composed of at least two different sources of light: (1) direct sunlight, which is modulated by the earth's atmosphere, and (2) blue sky light, which is the light reflected from the atmosphere. Additional light may also reach the subject by reflection from objects. The nature of daylight at any given time depends upon the geographical location, the season of the year, the time of day, the current weather conditions, and the surroundings. When the sky is clear, the amount of direct sunlight is at a maximum, which is about 88% of the total light on the ground, producing a lighting ratio of approximately 8:1. The ratio decreases as the amount of overcast increases.
The high temperature of the sun produces sunlight, and its energy distribution outside the earth's atmosphere closely approximates that of a blackbody source at 6500 K. In passing through the earth's atmosphere, a considerable amount of this light is lost, particularly in the blue region, and the color temperature of the sunlight plus the skylight varies between 5000 and 6000 K on the ground during the middle of the day. Daylight-type color films are balanced for a color temperature of 5500 K. Variations in color temperature with the time of day are illustrated in Figures 1-22 and 1-23. Color-compensating filters can be used on the camera lens when the color temperature of the daylight does not match that for which color film was manufactured or custom white balancing can be used for digital cameras. The use of color temperature to describe the appearance of daylight is not completely appropriate, however, since the energy-output characteristics of daylight only approximate those of a blackbody radiator.
Skylight is blue because the small particles in the atmosphere selectively scatter light, especially the short wavelengths, away from the direction of travel of the sunlight and toward the observers below. This effect is known as Rayleigh scattering, and varies inversely with the fourth power of the wavelength. Thus the scattering at 400 nm is 9.4 times that at 700 nm. The color temperature of blue skylight ranges between 10,000 and 20,000 K.
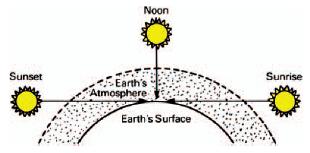
Figure 1-22 The relationship between position of the sun and the length of the sunlight's path of travel through the earth's atmosphere.

Figure 1-23 The variation in color temperature of light with time of day at the surface of the earth (no cloud cover).
Tungsten-Filament Lamps
Incandescent lamps emit light when the tungsten-filament wire reaches a high temperature as the result of its resistance to the passage of electricity— thus, electricity is converted to heat which is converted to light. The upper temperature limit for this type of source is 3650 K, the melting temperature of tungsten. Color temperature is an appropriate measure of the color quality of the light emitted by tungsten-filament lamps, and it ranges from approximately 2700 K for 15-watt household lightbulbs to 3400 K for photoflood lamps, which have a relatively short life of 10 hours or less.

Figure 1-24 Relative spectral-energy distributions for three incandescent sources.
The color temperature of daylight is considered to be 5500 K.
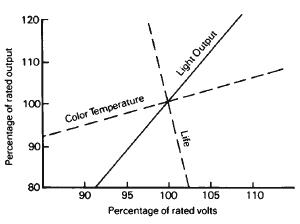
Figure 1-25 The variation in light output, color temperature, and life of a tungsten lamp at different voltages.
Heating a tungsten filament to the temperature required to produce daylight-quality light would cause the filament to melt.
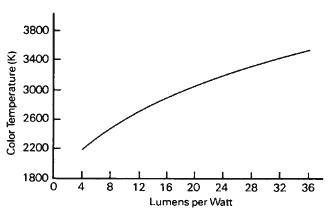
Figure 1-26 The average relationship between luminous efficiency and color temperature of tungsten filament lamps.
5000 K fluorescent lamps are recommended for transparency illuminators and print viewers.

Figure 1-27 Typical lamp depreciation for a conventional tungsten lamp and a tungsten-halogen lamp.
Photographic studio lamps rated at 3200 K have approximately 10 times the life expectancy since lamp life depends primarily upon the rate at which tungsten evaporates from the filament, which in turn varies with the temperature. (See Figures 1-24, 1-25, and 1-26.)
Tungsten-Halogen Lamps
Tungsten-halogen lamps, sometimes referred to as quartz-iodine lamps, differ from conventional tungsten lamps in that iodine is added to the gas in the tube and the envelope is made from quartz or other high-temperature glass. The iodine combines with the tungsten that evaporates from the filament, but the high temperature of the filament produces a decomposition that re-deposits tungsten on the filament, thereby increasing the life of the filament and preventing the deposit of tungsten on the envelope. Figure 1-27 illustrates the loss in total light output for conventional tungsten lamps and tungsten-halogen lamps during their operating lives.
Fluorescent Lamps
Fluorescent lamps produce light by establishing an arc between two electrodes in an atmosphere of very low-pressure mercury vapor contained in a glass tube. This low-pressure discharge produces ultraviolet radiation at specific wavelengths that excite crystals of phosphors lining the wall of the tube. Phosphors such as calcium tungstate have the ability to absorb ultraviolet energy and to re-radiate this energy as light. The color of light emitted by a fluorescent tube depends largely on the mixture of fluorescent materials used in the phosphor coating.
The light that reaches the eye or camera from such a lamp, therefore, consists of the light given off by these fluorescent compounds plus such part of the light from the mercury vapor that gets through them without being absorbed. The result is a continuous spectrum produced by the fluorescent material, superimposed upon the line spectrum of energy produced through the electrical discharge of the mercury vapor. The spectral-energy distributions for three of the more commonly encountered fluorescent lamps are illustrated in Figure 1-28.
Fluorescent lamps with a correlated color temperature of 5000 K (such as the General Electric Chroma 50®) are believed to give a better match to daylight and are now specified in ANSI standards for transparency illuminators and viewers. Fluorescent lamps find widespread use because they generate very little heat and are less expensive to operate (that is, they have higher luminous efficiency) than tungsten lamps. Additionally, they are low luminance sources, because they possess larger surface areas than do tungsten lamps. The result is that these lamps have less glare and produce more diffuse illumination. Fluorescent lamps are nearly always used for commercial lighting and, consequently, photographers working under such light conditions should be familiar with their characteristics.

Figure 1-28 Spectral-energy distributions of three different fluorescent lamps.
The luminous efficiency of fluorescent lamps is generally higher than that of tungsten sources, ranging between 40 and 60 lumens/watt, making them more economical to operate. Additionally, the average life of a fluorescent lamp is approximately 5,000 hours, which is nearly five times longer than that of a conventional tungsten lamp.
Luminous efficacy is a property of a light source that indicates the portion of the emitted electromagnetic radiation that is usable for human vision.
High-Intensity Discharge Lamps
Similar in operation to fluorescent lamps, high-intensity discharge lamps produce light by passing an arc between two electrodes that are only a few inches apart. The electrodes are located in opposite ends of a small sealed transparent or translucent tube.
Camera filtration is recommended when making color photographs with discharge-lamp light sources.
Also contained within the tube is a chemical atmosphere of sodium and/ or mercury. The arc of electricity spanning the gap between the electrodes generates heat and pressure much greater than in fluorescent lamps, and for this reason these lamps are also referred to as high-pressure discharge sources. The heat and pressure thus generated are great enough to vaporize the atoms of the various metallic elements contained in the tube. This vaporization causes the atoms to emit electromagnetic energy in the visible region. Since the physical size of the tube is small, it allows for the construction of optical sources that have excellent beam control. Such sources are frequently employed for nighttime illumination of sports stadiums, highways, exteriors of buildings, and the interiors of large industrial facilities.
As in the operation of low-pressure discharge sources (i.e., fluorescent lamps), high-intensity discharge lamps produce spikes of energy at specific wavelengths. These peaks are the result of specific jumps of the electrons within the atomic structure of the metallic elements. Energy is emitted in peaks located in different positions of the visible spectrum for each element. Thus these lamps do not have a true color temperature, since they are not temperature dependent for the color of light emitted. The three most commonly encountered high-intensity discharge sources are mercury, metal halide, and sodium. (See Figures 1-29, 1-30, and 1-31.)
Since their introduction in the 1950s, high-intensity discharge sources have steadily increased in use. Mercury-vapor lamps were the first lamps of this type available. Although their efficiency was high (17 to 46 lm/W) compared to tungsten, their color-rendering ability was poor. Today, the metal halide (54 to 92 lm/W) and sodium lamps (59 to 106 lm/W) are preferred for both efficiency and improved color rendering. However, these sources pose the same problems photographically as do fluorescent lamps. The use of color temperature and the mired scale is entirely inappropriate for these sources. When using films under these sources, the user will have to experiment to find the proper filtration. Digital cameras have proven to be easier to use to manage these issues, as custom white balance settings will take care of this problem.

Figure 1-29 Spectral-energy distribution of a high-intensity mercury discharge source with the name DeLuxe White®.

Figure 1-30 Spectral-energy distribution of a high-intensity metal halide discharge source, the General Electric Multi-Vapor® lamp.
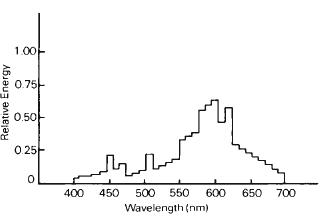
Figure 1-31 Spectral-energy distribution of a high-intensity sodium-vapor discharge source, the General Electric Lucalox®.
Electronic Flash
An electronic-flash lamp consists of a glass or quartz tube that is filled with an inert gas such as xenon and has electrodes placed at either end. When a high-voltage current from the discharge of a capacitor passes between the electrodes, the gases glow, producing a brilliant flash of light. The total time of operation is exceedingly short, with the longest times being on the order of 1/500th second and the shortest times approaching 1/100,000th second. The time-light curve for a typical electronic flash unit is shown in Figure 1-32. The effective flash duration is typically measured between one-third peak power points, and the area contained under the curve between these limits represents nearly 90% of the total light produced. If this number is measured in lumen seconds, the light being emitted in all directions is considered. A more revealing measurement is the number of effective beam-candle-power seconds, which is a measurement of the light output at the beam position of the lamp.
The spectral-energy distribution of these sources shows a line spectrum, the exact nature of which is determined by the type of gas dispersed in the tube. Although the gas gives a line spectrum, there are so many lines and they are so well distributed throughout the visible spectrum that no serious error is involved in considering the spectrum to be continuous, as shown in Figure 1-33. The spectrum from the gas in these tubes approaches incandescence because of the high-current density at the time of discharge. The resulting light has a correlated color temperature of approximately 6000 K, which is conveniently close to the 5500 K level at which daylight color films are designed to operate. A color-correction filter built into the lens of the flash unit often compensates for the small difference in color temperature. If no such filter exists in the source, a color-correction filter can be used over the camera lens to avoid a bluish cast in the color images.

Figure 1-32 Light output curve of an electronic flash unit.
The color temperature of most electronic-flash units is close to that of photographic daylight.

Figure 1-33 Relative spectral-energy distribution of a typical xenon-filled electronic flash unit.
The total light output for an electronic-flash unit depends upon the design of the flash lamp and reflector, the voltage, and the capacity of the capacitor. In the early days of electronic flash photography, the exposure was controlled by setting the f-number at the number obtained by dividing a guide number by the flash-to-subject distance. Electronic flash meters are now commonly used, and many portable electronic flash units have built-in sensors that monitor the light reflected from the subject and quench the flash when sufficient light falls on the subject to produce the desired exposure effect.
Electronic flash units have proven to be a most useful source of light for photographers. Their consistency in color output, quantity of light output from flash to flash, and the extremely short duration of the flash are all reasons for the widespread use of these sources.
Lasers
The word laser is an acronym for light amplification by stimulated emission of radiation. A laser is an electronic-optical device that produces coherent radiation. Hughes Research Laboratories demonstrated the first operational laser in May of 1960. Since then lasers have grown to become a multibillion-dollar industry with applications in optical storage devices such as compact disc and DVD players, scanners for bar code readers, laser pointers, metal cutting, and inscribing patterns such as letters on computer keyboards. There are also medical applications such as laser eye surgery and in the science for spectroscopy and other applications.
Laser is an acronym for Light Amplification by Stimulated Emission of Radiation.
A laser will emit light in a monochromatic (a single wavelength) narrow low-divergence beam. Lasers consist of gain medium inside an optical cavity that can receive an energy supply to the gain medium. The gain medium is a material such as a gas, liquid, solid, or free electrons that are of the required optical property. The simplest design of the cavity will consist of two mirrors arranged so the light will bounce back and forth passing through the gain medium each time. For light to be emitted from the laser one of the mirrors is partially transparent.
When the light travels though the gain medium its power is increased or amplified. This is a process by which a photon of light stimulates an excited atom to emit a second photon that is at the same frequency and moves in the same direction as the initiating wave. This concept is sometimes referred to as optical pumping, which is the process whereby matter is raised from a lower to a higher energy state.
For example, the potential energy of water is raised when it is pumped from an underground well to a storage tank on top of a tower. There are many forms of matter that can be elevated or pumped, from one energy level to a higher one, by optical methods. The atoms of some substances will absorb photons of light and when doing so increase their energy level. These excited atoms do not remain in the higher energy state but fall randomly and spontaneously to their lower or ground state. When this occurs, the stimulated atom emits a photon of light. Therefore, the gain medium amplifies the light waves by means of the stimulated emission process. Energy must be pumped into the laser medium to make it active. One way to supply this pumped energy is with light from an external source such as a flash tube.
Figure 1-34 illustrates the basic properties of a ruby laser. A ruby crystal rod has parallel polished ends which are mirrored surfaces. One end is only partially silvered and acts as a window for the light to escape. Energy is supplied to the ruby crystal by a powerful electronic flash tube, which serves to pump the atoms of the crystal to a higher energy state. They exist at this level for a few millionths of a second before dropping to their ground level, resulting in the emission of a photon of light as shown in Figure 1-34A. Although many of these photons will pass out of the crystal walls and be lost, eventually one photon will move directly along the rod and be reflected from the polished ends, passing back and forth along the rod until it encounters an atom in the excited elevated state, as shown in Figure 1-34B. As it strikes this excited mirrored atom, the atom radiates its photon in exact phase with the photon that struck it. This second photon will, in turn, stimulate another atom and, in this cascade process, continue to fill the rod with inphase radiation that is oscillating back and forth between the mirrored ends of the rod. A portion of this radiation is emitted through the partially silvered end of the rod and becomes the laser beam (see Figure 1-34C).

Figure 1-34 Basic operation of a ruby laser (the principle of "optical pumping").

Figure 1-35 Non-coherent and coherent light waves.
The entire process occurs within a few thousandths of a second, and as the flash tube fires again, the process repeats itself. The result is an intense monochromatic beam of light that can be focused to a tiny spot. Lasers emit light waves that are in phase with each other, and are described as being coherent. Conventional light sources radiate light of varying wavelengths in and out of phase with each other, which is described as non-coherent light. This concept is illustrated in Figure 1-35. It is this high degree of coherence that makes laser light different from that of all other sources.
The Language of Light
The intelligent selection and application of light sources require a familiarity with the units of light measurement.
Photometry is the branch of physics dealing with the measurement of the strength of light emitted by a source or the light falling on, transmitted by, or reflected from a surface. From the early 1900s, when the science of light measurement was first seriously undertaken, candles were used as the standard sources of light. Consequently, many of the definitions and units of measurement are based on the candle. However, since 1940 the international standard unit for light sources is based on the light emitted by 1 square centimeter of a blackbody radiator heated to the temperature of solidification of platinum, providing a standard that is more exactly reproducible. This standard unit of light is called the candela. The difference in light emitted by this new standard and the old standard candle is less than 2%.
Candela is a unit of measurement of the intensity of a light source.
The Measurement of Intensity
Intensity (sometimes called luminous intensity) is a measure of the rate at which the source emits light in a given direction. Initially, the intensity of a source was determined by comparison to the old standard candle, with the result expressed as candlepower. Thus a 50-candlepower source was one that emitted light equivalent to the amount of light that would come from 50 of the standard candles. The correct unit now is the candela. One candela is defined as one-sixtieth the light from a 1 square centimeter blackbody heated to the freezing temperature of platinum. However, the term candlepower is still often used to describe intensity.
One candela is defined as one-sixtieth the light from a 1 square centimeter blackbody heated to the freezing temperature of platinum.
Practical sources of light such as tungsten lamps and fluorescent tubes always vary in their intensity with direction, and therefore no single measurement of intensity can completely describe such sources. Perhaps the easiest way to understand the concept of intensity is to think of a ballshaped lawn sprinkler with many holes through which the water can flow. The intensity of such a source would be similar to the rate at which water was being emitted through one of those holes in a specific direction. Such information would be of limited value since it would not describe the variation in intensities around the ball or the total amount of water being emitted by the sprinkler.
Since the intensity of a real source changes with direction, it is desirable to learn about the distribution of intensities. Such information is usually provided by the lamp manufacturer in the form of a two-dimensional graph based on polar coordinates, an example of which is shown in Figure 1-36. In this graph, intensity is plotted against the angle on special paper, called polar-coordinate graph paper that is constructed like a protractor with the angles marked around the margins and each angle having a marked value in candelas. The zero angle is head-on to the lamp, with the intensity in this direction known as the beam intensity (candlepower). From such a graph the intensity at any desired angle can be found.
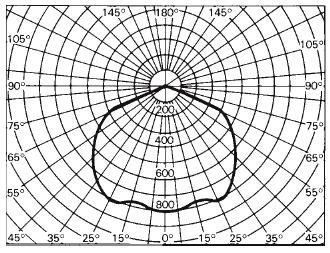
Figure 1-36 Polar-coordinate plot of intensities for a lamp-reflector combination.
For the lamp-reflector combination illustrated in Figure 1-36, the beam intensity is approximately 800 candelas. This intensity is nearly uniform, within 25° on either side of the beam position, indicating that this lamp-reflector combination provides nearly uniform illumination over a 50° angle of projection. At 65° off the beam position, the intensity drops to nearly 400 candelas. The same lamp equipped with a more narrowly curved reflector would produce a distribution of intensities much narrower than what is shown in Figure 1-36. Therefore, such polar-coordinate plots give fundamental information about the nature of the light that will be emitted.
When the intensity of a source is reported as a single value, there are three ways in which this value can be obtained, as illustrated in Figure 1-37. In the simplest case, the intensity in only one direction is measured and the value reported as a single candela value. When a number of readings are taken at uniform intervals on a horizontal plane around the source and then averaged, the result is the mean horizontal intensity (candlepower) of the light source. Instead of taking a large number of individual readings, this result is obtained in ordinary practice by rotating the source rapidly upon its vertical axis while a single reading is made. The intensity of light in all directions can be determined by measuring intensities at uniform intervals around the light source. An average of these readings would give the mean spherical intensity (candle-power) of the illuminant. It should be noted that this value is related to the total light output of the lamp. In each of these cases, the intensity is determined through comparison to a standard lamp at a variety of distances.

Figure 1-37 The measurement of intensity.
The Measurement of Flux
Flux (sometimes called luminous flux) is the rate at which a source emits light in all directions. The flux of a source is usually calculated from measurements of intensity and is closely related to the measurement of mean spherical intensity previously discussed. The unit of measurement is the lumen. Since flux involves the output of light in all possible directions, the lumen therefore involves a threedimensional concept.
The lumen may be defined as the amount of light falling on a surface 1 square foot in area, every point of which is 1 foot from a uniform source of 1 candela (candlepower). The relationship between the candela and the lumen is illustrated in Figure 1-38. If the opening indicated by A, B, C, D is 1 square foot of the surface area of a sphere of 1-foot radius, the light escaping will be 1 lumen. If the area of this opening is doubled, the light escaping will be 2 lumens.

Figure 1-38 The relationship between candelas and lumens.
Illuminance meters are calibrated in foot-candles and/or meter-candles (lux).
Since the total surface area of a sphere with a 1-foot radius is 12.57 square feet (that is, 4πr), a uniform 1-candela source of light emits a total of 12.57 lumens. Thus a source of 10 mean spherical candelas emits 125.7 lumens. Since an area of 1 square foot on the surface of a sphere of 1-foot radius subtends a unit solid angle (that is, one steradian) at the center of the sphere, the lumen may also be defined as the amount of light emitted in a unit solid angle by a source having an average intensity of 1 candela throughout the solid angle. Therefore, when considering a point source that emits light equally in all directions, there will be 12.57 (4π) lumens of flux for every candela of intensity.
The illuminance at a distance of one meter from a one-candela source is one meter-candle. At a distance of one foot, the illuminance is one foot-candle (or 10.76 metercandles).

Figure 1-39 The relationship between intensity and illuminance for a constant distance of one foot.
The Measurement of Illuminance
Let us consider a light source the cause of illumination, which is the effect or result. Since candelas and lumens are both a measure of the cause, they apply only to the light source and not the effect obtained. Illuminance is defined as the light incident upon a surface. For the measurement of illumination, a unit known as the footcan-dle is often used.
A footcandle represents the illumination at a point on a surface that is 1 foot distant from, and perpendicular to, the light rays from a one-candela source. For example, if the light source in Figure 1-39 has an intensity of 1 candela, the illuminance at point A, which is 1 foot distant from the source, will be equal to 1 footcandle. The illuminance at points B and C will be less because they are at greater distances than 1 foot. Therefore, an illuminance reading applies only to the particular point where the measurement is made. By averaging the number of footcandles at a number of points, the average illumination of any surface can be obtained. This is often done when evaluating the evenness of illumination on an enlarger easel or on a copy stand.
The footcandle is the unit of measure most closely associated with the everyday use of light. To get an idea of how much light 1 footcandle is, hold a lit candle one foot from a printed page in a darkroom. The result is approximately 1 footcandle of illumination. A full moon on a clear night gives approximately 0.02 footcandle; a well-lit street gives approximately 5 footcandles; a well-lit classroom has nearly 50 footcandles of illumination; in daylight in open shade there are approximately 1,500 footcandles of illumination, and in direct sunlight approximately 12,000 footcandles. To photograph a moonlit scene at an ISO speed of 100 would require an exposure of about 10 seconds at f/2, plus any additional exposure required to compensate for the reciprocity effect resulting from the long exposure time.
Referring again to Figure 1-38, it is evident that the surface A, B, C, D fulfills the conditions for a surface illuminated to a level of 1 footcandle. Every point on this square foot of surface is perpendicular to the rays of a 1-candela source that is 1 foot distant. This illustrates an important relationship between lumens and footcandles. A lumen is the light flux spread over 1 square foot of area that will illuminate that area to a level of 1 footcan-dle. Therefore, 1 footcandle is equal to 1 lumen per square foot. This relation forms the basis of a simplified method of lighting design known as the lumen method. When the number of square feet to be lighted is known and the desired level of illumination determined, it is simple to determine the number of lumens that must be provided on the working plane.

Figure 1-40 The relationship between intensity and illuminance for a constant intensity and varying source-to-surface distances (inverse square law).
One footcandle equals 10.76 metercandles.
With a 1-candela source, as shown in Figure 1-40, the level of illumination on point A, which is 1 foot distant, is 1 footcandle. However, if plane A is removed and the same beam of light is allowed to pass on to plane B, which is 2 feet away, this same beam of light would now cover an area four times that of plane A. The average illumination on plane B would be one-quarter as great as that on plane A, which would be equal to one-quarter of a footcandle. In the same fashion, if the beam of light is allowed to fall upon plane C, which is 3 feet away from the source, it will be spread over an area nine times as great as plane A, and so on.
One footcandle is equal to one lumen per square foot.
Thus, illumination falls off (decreases) not in proportion to the distance but in proportion to the square of the distance. This relationship is known as the inverse-square law. It should be emphasized that this law is based on a point source of light from which the light rays diverge as shown in Figure 1-40. In practice, it applies with close approximation when the diameter of the light source is not greater than approximately one-tenth the distance to the illuminated surface. The formula for the inverse square law is as follows:
Table 1-4 Standard illuminance levels for viewing reflection prints and luminance levels for viewing transparencies
| ANSI PH2.30-1988 | |
| Comparison viewing/critical appraisal | 2200 ± 470 lux |
| Display, judging, and routine inspection | 800 ± 200 lux |
| Transparency viewing | 1400 ± 30 0 cd/m2 |
| ISO 3364:2000 | |
| Monitor White Point D65 | 75-100 cd/m2 |
| Ambient Light | shall be less than 65 cd/m2 |
| should be less than 32-65 cd/m2 |

(E1.1-4)
Some galleries display color prints at a low light level of only 12 footcandles (about 130 lux) to minimize fading, which protects the colors but degrades the perception of color.
where E is the illuminance in foot-candles, I is the intensity of the source in candelas, and d is the distance of the surface from the source in feet. Illuminance measurements can be used to determine the intensity (expressed as candelas) of a source by solving the above equation for I as follows:
(Eq.1-5)
The inverse-square law does not apply to luminance, which does not change with viewing or measurement distance.
An alternative unit to measure illuminance in photography is the metercan-dle. The definition of a metercandle is similar to that of a footcandle, except the distance from the source, S, to the point A in Figure 1-39 is 1 meter. (One metercandle is the amount of light falling on a surface at a point 1 meter from a 1-candela source.
The concept of luminance applies to light sources, reflecting surfaces, and transmitting surfaces.
A meter is larger than a foot, so the inverse square law governs the relationship between a metercandle and a footcandle. There are approximately 3.28 feet in 1 meter, and therefore 1 metercandle would be equal to 1 divided by 3.282, which equals 1/10.76, or 0.0929 footcandle. Therefore, 1 footcandle is equal to 10.76 metercandles. The term metercandle is becoming less frequently used; the preferred name is now lux. One lux is equal to 1 meter-candle. In the photographic literature the lux (metercandle) measure of illuminance is more common than the footcandle.
When exhibiting reflection prints, the level of illumination can have a significant effect upon their appearance. Consequently, a number of standard conditions have been specified for viewing purposes and are summarized in Table 1-4. The variety of levels suggested is due in part to the differing visual tasks being performed. For example, the viewing of prints for comparison purposes requires a higher level of discrimination and, therefore, a higher illuminance level than does the viewing of a pictorial display. Further, since print judging and display involve subjective opinions, it should not be surprising that a variety of standards exist.
The Measurement of Luminance
Luminance can be defined as the rate at which the unit area of a source emits light in a specific direction. If a source is not a point source but has an appreciable size (as all real sources do), it is less useful to describe the intensity of such a source than to specify its luminance. Luminance is derived from intensity measurements, which are then related to the projected surface of the source.
Luminance is expressed in candelas per unit area (candelas per square foot, candelas per square inch, candelas per square centimeter, depending upon the size of the surface area being considered). For example, Figure 1-41 shows a frosted tungsten lamp with an intensity of 100 candelas in the direction of point A. This lamp has a projected area in that direction of 5 square inches. The luminance in that direction would then be 100 candelas divided by 5 square inches, equal to 20 candelas per square inch.
Luminance is the photometric quantity that relates closely to the perceptual concept of brightness. The term brightness is used exclusively to describe the appearance of a source and, therefore, cannot be directly measured.
Generally, as the luminance of a source increases, so does the brightness of that source. If two 60-watt tungsten lamps are placed side by side, and one lamp is frosted while the other is clear, the clear lamp looks much brighter than the frosted lamp. If both bulbs are consuming the same amount of electrical energy and they both are using a tungsten filament, the intensities of the two lamps would be the same. However, the luminance of the clear bulb will be much greater since the projected area of the filament is much smaller than the projected area of the glass envelope on the frosted lamp. From this example it should be evident that knowledge only of the intensities of the sources would be very misleading, while knowledge of the luminance of the sources relates more directly to the perception of brightness of the sources. Consequently, luminance data for real sources are always preferred over intensity data when the visual appearance of the source is desired.
The concept of luminance applies to reflecting and transmitting surfaces as well as to light sources, since it makes no difference whether the surface being considered is originating the light or merely reflecting or transmitting the light. In this respect, if all of the light falling on a perfectly diffusing surface were reradiated by the surface, the luminance would be numerically equal to the illuminance. This does not happen, since real surfaces never reflect 100% of the light that strikes them. For this reason, it is necessary to determine the reflection factor of the surface, which is the ratio of the reflected light to the incident light. The following formula may be used:
(Eq.1-6)

Figure 1-41 The concept of luminance.
Appling this formula to a perfectly diffusing surface, luminance equals illuminance multiplied by the reflection factor.
The most commonly used unit of luminance when considering reflecting surfaces is candelas per square foot, and the formula is:
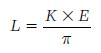
(Eq.1-7)
where L is the surface luminance in candelas per square foot, E is foot-candles incident on the surface, and K is the reflection factor of the surface. As shown in Figure 1-42, the product of the reflectance and the illuminance must be divided by n (3.14), since the light is actually being emitted into a hemisphere of unit (1-foot) radius, and IT is the ratio of the radius to the surface area of the hemisphere (IT = A/(2r)2). For example, if a perfectly diffusing surface with 18% reflectance is being illuminated with 100 foot-candles of light, the luminance of that surface is found by multiplying 0.18 by 100 divided by 3.14, which equals 5.73 candelas per square foot.

Figure 1-42 A perfectly diffusing surface; sometimes referred to as a lambertian surface.
Table 1-5 Illuminance-luminance conversions (examples based on 18 percent reflectance neutral test card)
| Illuminance to Luminance |
| Luminance = Illuminance X reflectance |
| 1. Footlambert = footcandle X reflectance |
| Luminance = 1.0 footcandle X 0.18 = 0.18 footlambert |
| 2. Apostilb = metercandle X reflectance |
| Luminance = 1.0 metercandle X 0.18 = 0.18 apostilb |
| 3. Candela per square foot = footcandle X reflectance/π |
| Luminance = 1.0 footcandle X 0.18 = 0.18/3.1416 = 0.057 C/ft.2 |
| 4. Candela per square meter = metercandle X reflectance/π |
| Luminance = 1.0 metercandle X 0.18 = 0.18/3.1416 = 0.057 C/m2 |
| Luminance to Illuminance |
| Illuminance = luminance/reflectance |
| 1. Footcandle = footlambert/reflectance |
| Illuminance = 1.0 footlambert/0.18 = 5.56 footcandles |
| 2. Metercandle = apostilb/reflectance |
| Illuminance = 1.0 apostilb/0.18 = 5.56 metercandles |
| 3. Footcandle = candela per square foot X π/reflectance |
| Illuminance = 1.0 candela/ft.2 X 3.1416/0.18 = 1745 footcandles |
| 4. Metercandle = candela per square meter X π/reflectance |
| Illuminance = 1.0 candela/m2 X 3.1416/0.18 = 1745 metercandles |
Notes:
1.A perfectly diffusely reflecting surface (100 percent) illuminated by 1 footcandle (1 lumen per square foot) will reflect 1 footlambert (1 lumen per square foot or 1/π candela per square foot).
2.Metric: A perfectly diffusely reflecting surface (100 percent) illuminated by 1 metercandle (1 lumen per square meter or 1 lux) will reflect 1 apostilb (1 lumen per square meter or 1/π candela per square meter).
To avoid the necessity of dividing by n all the time, the concept of a foot-lambert was invented. The footlambert is defined as 1 divided by n candelas per square foot. Thus the above relationship reduces to:
(Eq.1-8)
where L is now expressed in foot-lamberts. The footlambert is actually defined as the luminance of a 100% reflecting surface illuminated by 1 footcandle of light. Therefore, the luminance of the gray card described previously would be found by multiplying 0.18 × 100 footcandles, which equals 18 footlamberts. Although the calculations are simpler for footlam-berts, many modern photoelectric meters read the luminance directly in candelas per square foot, and therefore this is the more commonly used unit of measurement in photography. (These examples assume that the illuminated surfaces are perfectly diffusing or reflecting equally in all directions. This is approximately true for matte surfaces. However, shiny surfaces give highly directional reflections and do not follow these formulas.)
The concept of luminance is particularly useful in photography since it provides a way of describing the light reflected from the surfaces of the subject being photographed. Whenever a reflected-light meter reading is made, it is a luminance measurement. Luminance measurements have the unique characteristic of being independent of the distance over which the measurement is made. For an example, if a hand-held meter with a 50° angle of view is used to measure the reflected light from a surface, the luminance obtained will be identical to that taken with a spot-meter on the same area at the camera position. The reason for this independence is that as the amount of light being measured from the original area decreases with increasing distance, the projected surface area included in the angle of view increases in direct proportion. Thus, the number of candelas per square foot will remain the same. This assumes, of course, a clear atmosphere exists between the meter and the surface area being measured, which is usually the case. The various conversions of illuminance data to luminance data are summarized in Table 1-5.
Reflected-light exposure meters measure luminance. Incident-light exposure meters measure illuminance.
The photometric concepts discussed above are often employed to describe the properties and characteristics of all types of light sources. Table 1-6 summarizes the basic light terms and presents typical values for comparison purposes. It is obvious from this table that light sources can be described in a wide variety of ways. It is important to understand the differences in order to obtain appropriate information.
Conversion tables make it easier to compare different units of measurement of light.
Table 1-6 Ten basic light terms with typical examples of each
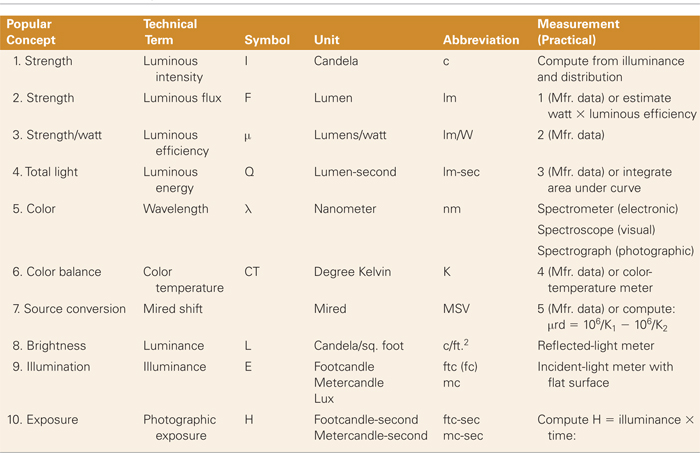
Note: Concepts 1–8 apply to light sources. Concept 8, Luminance, also applies to reflected and transmitted light. Concepts 9–10, Illuminance and Photographic exposure, apply to light falling on a surface.
REVIEW QUESTIONS
- Diffraction of light that passes through small opening is more easily explained with the …
- wave theory
- quantum theory
- The maximum sensitivity of the human eye, with moderate to high levels of luminance, is at a wavelength of approximately …
- 500 nm
- 550 nm
- 600 nm
- 650 nm
- 700 nm
- The seven hues that can be identified in the spectrum of white light by most people with normal color vision are
- blue, blue-green, green, yellow-green, yellow, orange, red
- violet, blue, green, yellow, yellow-orange, orange, red
- violet, blue, blue-green, green, yellow, orange, red
- blue, green, red, cyan, magenta, yellow, white
- As the temperature of a blackbody increases, the wavelength at which the peak output of radiation occurs …
- becomes smaller
- remains constant
- becomes larger
- A color temperature rating of 3200 K for a studio lamp signifies that …
- the temperature of the tungsten filament is 3200 K
- the spectral energy of the light emitted matches that of a blackbody at a temperature of 3200 K
- the light emitted visually matches that emitted by a blackbody at a temperature of 3200 K
- The higher the color temperature of a light source, the …
- bluer the light
- redder the light
- The maximum amount of polarized light in light reflected from nonmetallic surfaces occurs at an angle to the surface of approximately
- 25 degrees
- 35 degrees
- 45 degrees
- 55 degrees
- An advantage tungsten-halogen lamps have over conventional tungsten lamps is that the tungsten-halogen lamps …
- remain more constant in light output with use
- operate at a lower temperature
- are less expensive to purchase
- produce light of daylight quality
- The correlated color temperature of unfiltered electronic flash lamps is approximately …
- 3200 K
- 5000 K
- 5500 K
- 6000K
- A distinctive feature of laser light is that it …
- is plane polarized
- contains an equal amount of all wavelengths in the visible part of the spectrum
- consists of waves that are all in phase
- travels at twice the speed of ordinary light
- cannot penetrate ordinary window glass
- The candela, as a unit of measurement, is based on the light emitted by …
- a candle
- a candela
- melted platinum
- a heated blackbody
- The illuminance at a distance of 1 foot from a light source with a luminous intensity of 10 candelas is …
- 1 footcandle
- 10 footcandles
- 100 footcandles
- 126 footcandles
- 200 footcandles
- The term lux is a synonym for …
- footcandle
- metercandle
- The concept of luminance applies to …
- light sources only
- reflecting surfaces only
- both light sources and reflecting surfaces
- When the luminance of a surface of uniform tone is measured with a spot exposure meter, the luminance will vary …
- directly with the meter to surface distance
- inversely with the meter to surface distance
- directly with the meter to surface distance squared
- inversely with the meter to surface distance squared
- none of the above