Introduction
In This Introduction
What You Will Learn from This Book
What Is New in Excel 2016’s Pivot Tables
Skills Required to Use This Book
Sample Files Used in This Book
The pivot table is the single most powerful command in all of Excel. Pivot tables came along during the 1990s, when Microsoft and Lotus were locked in a bitter battle for dominance of the spreadsheet market. The race to continually add enhanced features to their respective products during the mid-1990s led to many incredible features, but none as powerful as the pivot table.
With a pivot table, you can transform one million rows of transactional data into a summary report in seconds. If you can drag a mouse, you can create a pivot table. In addition to quickly summarizing and calculating data, pivot tables enable you to change your analysis on the fly by simply moving fields from one area of a report to another.
No other tool in Excel gives you the flexibility and analytical power of a pivot table.
What You Will Learn from This Book
It is widely agreed that close to 60% of Excel users leave 80% of Excel untouched. That is, most users do not tap into the full potential of Excel’s built-in utilities. Of these utilities, the most prolific by far is the pivot table. Despite the fact that pivot tables have been a cornerstone of Excel for almost 20 years, they remain one of the most underutilized tools in the entire Microsoft Office suite.
Having picked up this book, you are savvy enough to have heard of pivot tables—and you have perhaps even used them on occasion. You have a sense that pivot tables provide a power that you are not using, and you want to learn how to leverage that power to increase your productivity quickly.
Within the first two chapters, you will be able to create basic pivot tables, increase your productivity, and produce reports in minutes instead of hours. Within the first seven chapters, you will be able to output complex pivot reports with drill-down capabilities and accompanying charts. By the end of the book, you will be able to build a dynamic pivot table reporting system.
What Is New in Excel 2016’s Pivot Tables
Luckily, Microsoft continues to invest heavily in business intelligence (BI), and pivot tables are the front end that let you access the new features. Some of the features added to Excel 2016 pivot tables include the following:
![]() Pivot tables now provide auto grouping for date or time columns. If you add a date column to the Rows or Columns area, Excel will automatically group the data up to Months and collapse to Months. If the data spans more than one year, Excel will add Quarters and Years as well. If you add a time column, Excel will automatically group to Seconds, Minutes, and Hours and collapse to show only the top level.
Pivot tables now provide auto grouping for date or time columns. If you add a date column to the Rows or Columns area, Excel will automatically group the data up to Months and collapse to Months. If the data spans more than one year, Excel will add Quarters and Years as well. If you add a time column, Excel will automatically group to Seconds, Minutes, and Hours and collapse to show only the top level.
![]() Pivot charts offer expand and collapse buttons. If you add two or more fields to the Axis or Legend area of a pivot table, you can use the + and - icons on the pivot chart to zoom in and out on the hierarchy.
Pivot charts offer expand and collapse buttons. If you add two or more fields to the Axis or Legend area of a pivot table, you can use the + and - icons on the pivot chart to zoom in and out on the hierarchy.
![]() Slicers now offer a Multi-Select icon to allow you to choose multiple items without using the Ctrl key. This feature was added for touchscreens.
Slicers now offer a Multi-Select icon to allow you to choose multiple items without using the Ctrl key. This feature was added for touchscreens.
![]() If your data has a geographic field such as for addresses or postal codes, you can build a pivot table on a map by using the 3D Maps icon on the Insert tab.
If your data has a geographic field such as for addresses or postal codes, you can build a pivot table on a map by using the 3D Maps icon on the Insert tab.
![]() If you need to import data for a pivot table, the Power Query tools found under Data, Get & Transform will assist you in cleaning and shaping that data.
If you need to import data for a pivot table, the Power Query tools found under Data, Get & Transform will assist you in cleaning and shaping that data.
![]() Power Pivot has an automatic feature for creating a calendar table.
Power Pivot has an automatic feature for creating a calendar table.
![]() If you select Insert PivotTable from a blank cell, and if there is a Data Model in the workbook, Excel will offer to build the pivot table from the model.
If you select Insert PivotTable from a blank cell, and if there is a Data Model in the workbook, Excel will offer to build the pivot table from the model.
![]() Power Pivot’s Auto-Detect Relationships dialog offers a Manage Relationships button that allows you to review or correct any relationship that was detected.
Power Pivot’s Auto-Detect Relationships dialog offers a Manage Relationships button that allows you to review or correct any relationship that was detected.
If you skipped right over Excel 2013, you may not know about some of the new features it introduced. Here are some of the best ones:
![]() Beginning with 2013, Excel offers thumbnails for 10 recommended pivot tables when you choose Insert, Recommended Pivot Tables. If you are not sure how best to summarize your data, you’ll find plenty of inspiration in this dialog.
Beginning with 2013, Excel offers thumbnails for 10 recommended pivot tables when you choose Insert, Recommended Pivot Tables. If you are not sure how best to summarize your data, you’ll find plenty of inspiration in this dialog.
![]() A timeline slicer enables you to easily filter a pivot table by month, quarter, or year.
A timeline slicer enables you to easily filter a pivot table by month, quarter, or year.
![]() Excel 2013 introduced the Data Model as a way to build a pivot table from two tables. This is for the versions of Excel that do not offer Power Pivot.
Excel 2013 introduced the Data Model as a way to build a pivot table from two tables. This is for the versions of Excel that do not offer Power Pivot.
![]() People using Office Professional Plus, Office 365 Pro Plus, or other high-end editions can enable the Power Pivot add-in. Power Pivot provides drag-and-drop functionality to link tables, worksheets, SQL Server, and more. Power Pivot adds better calculated fields.
People using Office Professional Plus, Office 365 Pro Plus, or other high-end editions can enable the Power Pivot add-in. Power Pivot provides drag-and-drop functionality to link tables, worksheets, SQL Server, and more. Power Pivot adds better calculated fields.
![]() Power View enables you to animate pivot tables in an ad hoc query tool.
Power View enables you to animate pivot tables in an ad hoc query tool.
Skills Required to Use This Book
This book is a comprehensive enough reference for hard-core analysts yet relevant to casual users of Excel. The bulk of the book covers how to use pivot tables in the Excel user interface. Chapter 10, “Mashing Up Data with Power Pivot,” delves into the Power Pivot window. Chapter 14, “Advanced Pivot Table Tips and Techniques,” describes how to create pivot tables in Excel’s powerful VBA macro language. Any user who has a firm grasp of basics such as preparing data, copying, pasting, and entering simple formulas should not have a problem understanding the concepts in this book.
Case Study: Life Before Pivot Tables
Say that your manager asks you to create a one-page summary of a sales database. He would like to see total revenue by region and product. Suppose you do not know how to use pivot tables. You will have to use dozens of keystrokes or mouse clicks to complete this task.
First, you have to build the outline of the report:
1. Copy the Product column to a blank section of the worksheet.
2. Select Data, Remove Duplicates to eliminate the duplicates.
3. Delete the Product heading.
4. Copy the unique list of products and then use Paste Special Transpose to turn the list sideways.
5. Delete the vertical list of products.
6. Copy the Region column to a blank section of the worksheet.
7. Select Data, Remove Duplicates to remove the duplicates.
8. Delete the Region heading.
9. Cut and paste the products so they appear left of and below the regions.
At this point, with 27 mouse clicks or keystrokes, you’ve built the shell of the final report, but there are no numbers inside yet (see Figure I.1).

Next, you need to build the relatively new SUMIFS function to total the revenue for the intersection of a region and product. As shown in Figure I.2, the formula =SUMIFS($G$2:$G$564,$C$2:$C$564,L$1,$B$2:$B$564,$K2) does the trick. It takes 52 characters plus the Enter key to finish the formula, but I managed to enter the formula in 36 clicks or keystrokes by using some clever navigation tricks I’ve learned over the years.

Figure I.2 If this were the year 2006, the SUMIFS function would have been an uglier SUMPRODUCT function.
If you are adept at using the fill handle, you need just two more mouse drags to copy the formula to the rest of the table.
Enter the heading Total for the total row and for the total column. You can do this in nine keystrokes if you type the first heading, press Ctrl+Enter to stay in the same cell and then use Copy, select the cell for the second heading, and use Paste.
If you select K1:P6 and press Alt+Equals, you can add the total formulas in three keystrokes.
With this method, which takes 77 clicks or keystrokes, you end up with a nice summary report, as shown in Figure I.3. If you could pull this off in 5 or 10 minutes, you would probably be fairly proud of your Excel prowess; there are some good tricks among those 77 operations.

You hand the report to your manager. Within a few minutes, he comes back with one of the following requests, which will certainly cause a lot of rework:
![]() Could you put products down the side and regions across the top?
Could you put products down the side and regions across the top?
![]() Could you show me the same report for only the manufacturing customers?
Could you show me the same report for only the manufacturing customers?
![]() Could you show profit instead of revenue?
Could you show profit instead of revenue?
![]() Could you copy this report for each of the customers?
Could you copy this report for each of the customers?
Invention of the Pivot Table
When the actual pivot table was invented is in dispute. The Excel team coined the term pivot table, which appeared in Excel in 1993. However, the concept was not new. Pito Salas and his team at Lotus were working on the pivot table concept in 1986 and released Lotus Improv in 1991. Before then, Javelin offered functionality similar to that of pivot tables.
The core concept behind a pivot table is that the data, formulas, and data views are stored separately. Each column has a name, and you can group and rearrange the data by dragging field names to various positions on the report.
Case Study: Life After Pivot Tables
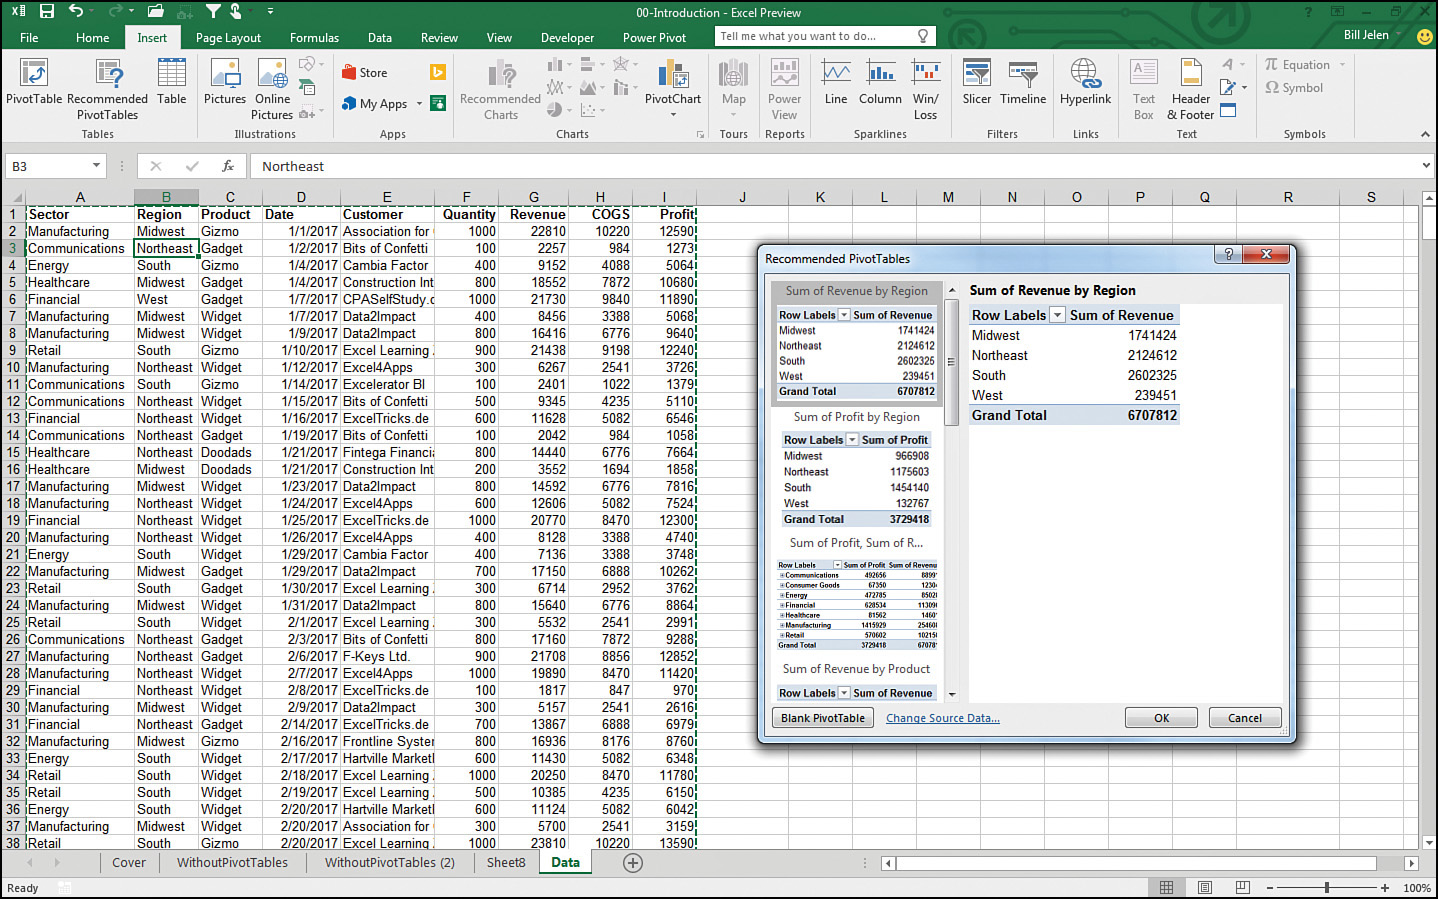
Say that you’re tired of working so hard to remake reports every time your manager wants a change. You’re in luck: You can produce the same report as in the last case study but using a pivot table. Excel 2016 offers you 10 thumbnails of recommended pivot tables to get you close to the goal. Follow these steps:
1. Click the Insert tab of the ribbon.
2. Click Recommended PivotTables. The first recommended item is Revenue by Region (see Figure I.4).
3. Click OK to accept the first pivot table.
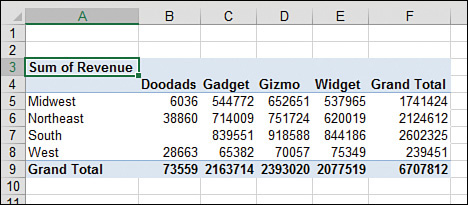
4. Drag the Product field from the PivotTable Fields list to the Columns area (see Figure I.5).

5. Unselect Field Headers on the right side of the ribbon.
With just five clicks of the mouse, you have the report shown in Figure I.6.
In addition, when your manager comes back with a request like the ones near the end of the prior case study, you can easily use the pivot table makes to make the changes. Here’s a quick overview of the changes you’ll learn to make in the chapters that follow:
![]() Could you put products down the side and regions across the top? (This change will take you 10 seconds: Drag Product to Rows and Region to Columns.)
Could you put products down the side and regions across the top? (This change will take you 10 seconds: Drag Product to Rows and Region to Columns.)
![]() Could you show me the same report for only the manufacturing customers? (15 seconds: Select Insert Slicer, Sector; click OK; click Manufacturing.)
Could you show me the same report for only the manufacturing customers? (15 seconds: Select Insert Slicer, Sector; click OK; click Manufacturing.)
![]() Could you show profit instead of revenue? (10 seconds: Uncheck Revenue, check Profit.)
Could you show profit instead of revenue? (10 seconds: Uncheck Revenue, check Profit.)
![]() Could you copy this report for each of the customers? (30 seconds: Move Customer to Report Filter, open the tiny drop-down next to the Options button, choose Show Report Filter Pages, click OK.)
Could you copy this report for each of the customers? (30 seconds: Move Customer to Report Filter, open the tiny drop-down next to the Options button, choose Show Report Filter Pages, click OK.)
Sample Files Used in This Book
All data files used throughout this book are available for download from www.mrexcel.com/pivotbookdata2016.html. You will find one Excel workbook per chapter and should be able to achieve exactly the same results shown in the figures in this book by starting with the raw data on the Data worksheet. If you simply want to work with the final pivot table, you can find it in the workbook as well.
Conventions Used in This Book
This book follows certain conventions:
![]()
Monospace—Code and messages you see onscreen appear in a monospace font.
![]() Bold—Text you type appears in a bold font.
Bold—Text you type appears in a bold font.
![]() Italic—New and important terms appear in italics.
Italic—New and important terms appear in italics.
![]() Initial Caps—Tab names, dialog names, and dialog elements are presented with initial capital letters so you can identify them easily.
Initial Caps—Tab names, dialog names, and dialog elements are presented with initial capital letters so you can identify them easily.
Referring to Ribbon Commands
When the active cell is inside a pivot table, two new tabs appear on the ribbon. In the help files, Microsoft calls these tabs “PivotTable Tools | Analyze” and “PivotTable Tools | Design.” For convenience, this book refers to these elements as the Analyze tab and the Design tab, respectively. The Slicer feature has a ribbon tab that Microsoft calls “Slicer Tools | Options.” This book refers to this as the Slicer tab. Excel 2013 introduced the “Timeline Tools | Options” tab. This book calls this the Timeline tab.
In some cases, the ribbon icon leads to a drop-down with additional choices. In these cases, the book lists the hierarchy of ribbon, icon, menu choice, and submenu choice. For example, Figure I.7 shows what you would select if the book said “select Design, Report Layout, Repeat All Item Labels.”
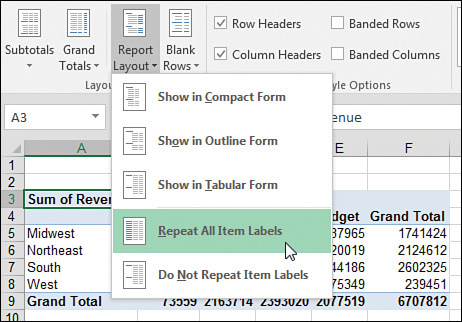
Figure I.7 For shorthand, instructions might say to select Design, Report Layout, Repeat All Item Labels.
Special Elements
This book contains the following special elements:
Notes provide additional information outside the main thread of the chapter discussion that might be useful for you to know.
Tip
Tips provide quick workarounds and time-saving techniques to help you do your work more efficiently.
Caution
Cautions warn you about potential pitfalls you might encounter. Pay attention to cautions because they alert you to problems that could cause you hours of frustration.