Sol-Gel Route for the Development of Smart Green Conversion Coatings for Corrosion Protection of Metal Alloys
Atul Tiwari; L.H. Hihara Department of Mechanical Engineering, University of Hawaii at Manoa, Honolulu, Hawaii, USA
Abstract
The development of coatings through sustainable routes is needed for the modern industrial sector. The process parameters and chemical ingredients should be wisely chosen to meet the demand of environmental friendly synthetic technologies. In this chapter, the authors have demonstrated the adaptability of using the sol-gel route for the development of eco-friendly (green) silicone coating compositions containing titanium nanoparticles. The developed coating composition was characterized with Fourier Transform Infrared (FTIR), Raman, Nuclear Magnetic Resonance (NMR), and X-ray Photoelectron spectroscopies. The thermal stability of the material was determined using thermogravimetric analysis (TGA). The surface morphology of the coatings was studied with scanning electron microscopy (SEM), transmission electron microscopy (TEM), and atomic force microscopy (AFM). The corrosion resistance and impervious barrier properties of the Green Conversion Coating (GCC) were evaluated by a series of laboratory and outdoor corrosive atmosphere exposure experiments.
Acknowledgment
The patented SiloXel coating (GCC) was developed under US Army sponsored project (DAAE30-03-C-1071). Later, this project was supported by the Office of Naval Research (N00014-09-1-1056) and Office of Secretary of Defense (FA8501-HAW-001 and W9132T-09-2-0022). The authors are grateful for the support from the US Marine Corps (USMC) Corrosion Prevention and Control Program, and the Department of Energy, Oak Ridge National Laboratory (Contract #4000106469) for the project entitled “Pacific Rim Corrosion Assessment and Mitigation Program (PacRimCAMP).” The authors are particularly grateful to Matthew Koch of the USMC; Andrew Sheetz and Forrest Pilgrim of the Naval Surface Warfare Center, Carderock Division; and J. Allen Haynes, Timothy Vane, and Steven Pawel of ORNL.
10.1 Introduction
Coatings constitute an indispensable class of materials that have enjoyed high commercial success. A wide variety of coatings is available to meet the demands of consumers. The global coating market is forecasted to increase at a compound annual growth rate of 5.46% and will reach an estimated value of $107 billion in year 2017.1 Most coatings compositions are developed with chemical ingredients that are relatively nontoxic. However, recent regulations posted by Environmental Protection Agency (EPA) in the United States and Registration, Evaluation, Authorization and Restriction of Chemicals (REACH) in Europe, have forced coating formulators to adopt alternate development methodologies using nonregulated environmentally benign chemicals.2–4 Current developments in eco-friendly coatings (also known as green coatings) have gained significant attention.5 The word “green chemistry” was coined by Paul Anastas in 1991 and has now become a synonym for environmental friendly chemical synthesis. The development of green coating compositions can be achieved by following the principles of green chemistry6:
■ Use of less toxic chemical monomers
■ Synthesis of less hazardous chemicals
■ Synthetic routes to prevent waste
■ Use of safer solvents
■ Reduction of chemical derivates
■ Limited utilization of auxiliary substances
■ Optimization of the process for energy efficiency
■ Use of catalysts
■ Incorporation of renewable materials
■ Biodegradable without release of hostile byproducts
■ Safer chemical routes to prevent hazardous accidents
■ Development of analytical methodologies to allow the real-time-in process monitoring
The practice of green chemistry and development of green coatings is still in its infancy. Academic institutions and the industrial sector are working on developing new synthetic routes for the creation of safer environmental friendly coatings. This chapter describes a coating composition that embraces the above stated 12 principles of green chemistry. The composition was developed through the sol-gel route with chemical components that were carefully selected to synthesize a thin impervious barrier on a metal surface. The first section of this chapter describes the smart green chemistry that is adopted to develop the Green Conversion Coating (GCC). In the second section, the GCC material has been characterized using various analytical techniques to insure the integrity of the chemical structure. Finally, in the third section, the corrosion barrier properties of a GCC layer ~ 5 μm applied to various aluminum alloys have been examined and compared with two other commercial conversion coatings.
10.2 Development of Smart Chemistry
The green quasi-ceramic coating was prepared by following a patented method briefly described as follows7: A mixture of silanes was prepared by reacting calculated quantities of methyltriacetoxysilane (MTAS), methyltrimethoxysilane (MTMS), and tetramethoxysilane (TMS) in a reactor vessel followed by sonication and an addition of isopropanol. In a second reactor, a calculated quantity of sodium bicarbonate was dissolved in a known volume of water. The water was constantly stirred while sodium salt was added and then stirred every 2 h. The content of the second reactor was added to the content of the first and then sonicated for 30 min. In a third reactor, the calculated quantity of tetraethoxy titanium (TET) was sonicated in isopropanol for 30 min and added to the solution obtained in the above steps. A known quantity of isopropanol (IPA), diethyl ether, and dibutyltindilaurate (DBTDL) were mixed separately in a reaction vessel and added to the solution obtained in the above steps. The entire solution was left for 30 min in ambient conditions before using it as a green coating precursor material.
It is well known that one or mixture of more than one alkoxysilane when dried on a surface could form a coating-like structure.8 However, proper selection of chemical components is crucial to meet the desired properties. In the GCC composition, the first added silane was MTAS, which was selected for the following reasons: In order for a material to form stable coating on metal surface such as aluminum, permanent covalent bond formation with the available hydroxyl functionalities is critical. However, the hydroxyl functionality is not always readily available on the materials surface. The inert oxide layer over the metal surface does not allow the formation of permanent covalent bonding between the silicones and metal. It was, therefore, necessary to remove the inert oxide layer and expose the hydroxyl functionality for the covalent bond formation. However, the removal of the inert oxide layer and coating the metallic surface thereafter to construct permanent covalent bonds is nearly impossible as the rate of formation of the inert oxide layer is practically instantaneous.9 For GCC development, the advantage of the availability of hydrolysable acetate groups in MTAS was considered. Moreover, the methyl group in MTAS could play a pivotal role in promoting the facile release of acetate as acetic acid that could act as a catalyst during the hydrolysis of silanes as well as etching agent to remove the inert oxide layer. Therefore, acetate group could performs three functions; that is, catalyst, etching agent and buffering agent (discussed later).
The second added silane in the GCC was TMS which is a highly reactive silicone where the methoxy group can readily react and form covalent bonds with the hydroxyl functionalities that become available after the inert oxide layer is etched. Moreover, it can create a template for new crosslinking reactions. Therefore, TMS performs two functions; that is, attaching the exposed hydroxyl functionalities on the metal substrate and generation of template for the new crosslinking reactions.
The third added silane in GCC composition was MTMS, which has a ![]() CH3 hydrocarbon group in the coating composition to promote the release of
CH3 hydrocarbon group in the coating composition to promote the release of ![]() OCH3. Moreover, it was beneficial to have the hydrocarbon attached as pendant to silane and not in the backbone structure. The hydrocarbons are prone to UV-light degradation and, therefore, could affect the backbone chemistry upon UV light exposure. The methyl group used as pendant may effectively work as an “umbrella-shield” against the attack of water molecules. MTMS presumably could perform two functions; that is, supply enough pendant hydrocarbons to impart desired flexibility to the coating and act as a shield against water molecules.
OCH3. Moreover, it was beneficial to have the hydrocarbon attached as pendant to silane and not in the backbone structure. The hydrocarbons are prone to UV-light degradation and, therefore, could affect the backbone chemistry upon UV light exposure. The methyl group used as pendant may effectively work as an “umbrella-shield” against the attack of water molecules. MTMS presumably could perform two functions; that is, supply enough pendant hydrocarbons to impart desired flexibility to the coating and act as a shield against water molecules.
It should be clarified that while MTAS could supply all of the desired hydrocarbon content to the coating; its sole use would generate high amounts of acetic acid that could decrease the pH of the medium and corrode the metal surface during the coating application process. Hence, the use of MTMS was necessary to reduce the formation of excess acetic acid and to regulate the amount of hydrocarbon that remained in the coating. Too much hydrocarbon could lead to the formation of a semiporous network structure reducing the coating hardness (higher the hydrogen content less the hardness of the coating).10
It was discovered that an appropriate amount of three silanes was necessary to control the desired properties. Too much amount of MTAS will produce high amounts of acetic acid and could corrode the metal surface while too little amounts may not be sufficient to perform all three actions simultaneously as mentioned earlier. An abundance of TMS could lead to brittle coating structure due to elevated crosslinking density while low amounts may not be sufficient to capture the sufficient hydroxyl functionalities over the metal surface. High amounts of MTMS could increase the hydrocarbon content while, too little amount may not impart a sufficient amount of hydrocarbon.
Although the above three silanes were selected to perform specific functions to form a coating, there are more requirements to fulfill to ensure an impervious corrosion barrier coating will form. It is difficult to develop a coating formulation without knowing the characteristics of the metal substrate and its corrosion activity. Stated below is the brief chemistry that occurs when silanes are mixed in desired quantity in an appropriate nonanhydrous alcohol that contains traces of water molecules. When silanes are added to such a solvent and subjected to ultrasonic mixing, the energy from the ultrasonic treatment triggers the hydrolysis reaction of the silanes. However, there are not enough water molecules to complete the entire hydrolysis reaction, and activated sol is created.
A saturated aqueous solution of sodium bicarbonate (Na+ HCO3−) was added to the above-activated sol and ultrasonically agitated to trigger the hydrolysis reaction. The use of a saturated sodium bicarbonate solution was necessary to avoid the hydrolysis of entire acetoxy or alkoxy groups at this stage. In fact, it was vital to maximize the Na+ concentration in the solution. The acetate (CH3COO−) and Na+ ions in the solution along with the intermediate carbonic acid (H2CO3) perform a buffering action [(CH3COONa) + CH3COOH]. The presence of alcohol could facilitate the formation of carbonic acid intermediate. This in-situ generated buffer controls the pH of the solution when it’s needed at the time of coating application to neutralize the metal surface when large amounts of acetic acid are generated as the activated sol is hydrolyzed upon the exposure to humid air during curing. Additionally, in-situ-generated sodium acetate in the barrier coating acts as a barrier against the attack of the hydronium ions. This salt remains in the network for the entire service life span of the coating.
The water used in this case serves dual purposes; that is, it facilitates the formation of ionic species (Na+ HCO3−) and provides the medium for the extended hydrolysis reactions. TET was also used in the formulation to generate, on exposure to air in-situ, self-assembled nanoparticles of titanium dioxide (TiO2). These titanium dioxide nanoparticles are likely to actively contribute to the formation of backbone structure of the coating. TET was added in the formulation with the intention of imparting UV-light degradation protection and contributing to the cohesion and hardening of the coating structure. Additionally, incorporation of TET may prevent phase separation and agglomeration which usually occurs with the addition of preformed TiO2. TET was blended into alcohol (not anhydrous) to induce hydrolysis before adding to the silicone composition. TET, therefore, plays two crucial roles; that is, acting as a shield against UV-light and imparting hardness to the coating structure. However, an optimal amount of TET is required. Too much of TET adversely affected the curing and hardening process. The critical concentration of TET was determined after conducting a series of nanomechanical testing to determine the optimum hardness.
The DBTDL catalyst was dissolved in a mixture of alcohol and diethyl ether that was activated by ultrasonic mixing. The catalyst was necessary to induce the condensation reaction between different chemical moieties at ambient temperature. Diethyl ether was chosen as a cosolvent due to its extreme surface cleaning tendency.
The sequence of reacting chemical constituents discussed above is the deciding factor in achieving the desired barrier properties of the coating. The saturated aqueous solution of Na+ HCO3− was thoroughly blended into the silicone solution until the water molecules were preferably mixed or consumed in the solution. In the next step, the TET solution was added to the above-activated silane composition. Contrary to this, if TET is added to the silane solution before the addition of saturated solution of Na+ HCO3−, the entire solution will turn milky white and inferior coating properties will be obtained.
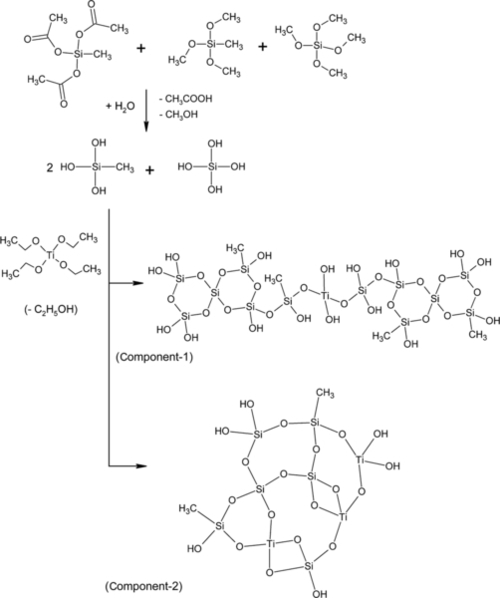
When coating formulation is applied to the metal surface, the free acetic acid etches the inert oxide layer. The inert oxide layer is solubilized in the coating formulation and acts as a component in the coating network. TMS attacks the hydroxyl functionalities that are made available on the metal surface as a result of etching the inert oxide layer. The methoxy group in TMS and MTMS hydrolyzes in the presence of acetic acid and reacts to form a three-dimensional network. Similarly, TET also hydrolyzes in the presence of ambient moisture and interacts with silanol in backbone formation. The generated acetic acid reacts with Na+ to form sodium acetate. The sodium acetate, free acetic acid, and carbonic acid create buffering action that controls the pH of the solution. This buffering action should last for the duration of the coating life. The catalyst facilitates the formation of the coating network in ambient conditions (Scheme 10.1).
10.3 Characterization Methodology
10.3.1 Spectroscopic analysis
The competing reactants with different activity coefficients could be possibly leading to an intermediate macromolecular mixture of varying chain lengths. However, the polymer chains in the mixture align during the curing/hardening stage, giving rise to a condensed three-dimensional network. The precursor monomers, the gel macromolecules, and crosslinked network should be studied at entire development stages to confirm the integrity of the desired structure. The following section describes various characterization studies conducted during the development of GCC.
10.3.1.1 FTIR analysis of cured coating and precursor to coatings
It is widely accepted that molecular packing arrangement in the hybrid material depends largely on the hardening kinetics.11 Also, that fast and uncontrolled evaporation of the solvent does not provide enough time for the polymer strands to align in a confined manner. Such curing process leads to defects such as cavities, pinholes, or holidays in the coating network. Corrosive electrolytes tend to diffuse through these holidays and reach the surface of the metal, leading to delamination and failure of the coating. A rapid curing kinetics or in-situ observations of the hardening mechanism using FTIR could help in determining the volume collapse or hardening route in the complex chemical network.12,13
Figure 10.1a displays 3D FTIR absorbance spectra as a function of time. The 3D FTIR spectra shown in Figure 10.1a displays the in-situ hardening phenomenon observation on the GCC gels. Spectra were recorded on liquid precursor to coating that was aged (in a sealed container) in ambient conditions for 24 h. The sharp peaks (not shown) due to evaporation of the volatile solvent appeared during the initial stages of the run. The peaks that appeared at ~ 2900 cm− 1 corresponded to the hydrocarbon portion in the coating formulation. More specifically, the peak that appeared in the spectra at 2920 cm− 1 corresponds to symmetric ![]() CH stretching while the peak that appeared at 2975 cm− 1 corresponds to asymmetric
CH stretching while the peak that appeared at 2975 cm− 1 corresponds to asymmetric ![]() CH stretching. These peaks were found consistently and independent of time in each spectrum, indicating that the hydrocarbon portion of the composition did not take part during the initial phases of the reaction. The peak at 1600 cm− 1 corresponds to the acid functionality12 (as a result of acetic acid formation), which appeared during the initial phase of the reaction and disappeared after 15 min. Most of the peaks appearing in the range of 500-1500 cm− 1 remained constant, except an additional peak that appeared at 1050 cm− 1, which corresponds to the SiOSi network formation.14,15 A sharp peak appearing at ~ 915 cm− 1 represented a combined contribution from TiOSi and silanol (SiOH) linkages.16,17
CH stretching. These peaks were found consistently and independent of time in each spectrum, indicating that the hydrocarbon portion of the composition did not take part during the initial phases of the reaction. The peak at 1600 cm− 1 corresponds to the acid functionality12 (as a result of acetic acid formation), which appeared during the initial phase of the reaction and disappeared after 15 min. Most of the peaks appearing in the range of 500-1500 cm− 1 remained constant, except an additional peak that appeared at 1050 cm− 1, which corresponds to the SiOSi network formation.14,15 A sharp peak appearing at ~ 915 cm− 1 represented a combined contribution from TiOSi and silanol (SiOH) linkages.16,17

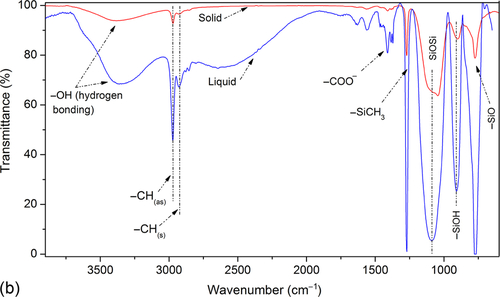
In Figure 10.1b, hump at 3400 cm− 1 indicates the presence of hydrogen bonding in the molecular structure. The intensity of hump decreases as material solidifies. The strong, sharp peak at 1271 cm− 1 is due to Si-OCH3 vibrations.18 The peak between 1000-1100 cm− 1 is due to Si-O-Si vibrations. The peak at 911 cm− 1 is due to an ![]() OH group produced as a result of the hydrolysis of alkoxysilanes. The peak at 911 cm− 1 was stronger in the gel stage but weaker in the solid stage, probably due to the consumption of the generated hydroxyl groups during the crosslinking and hardening phase. Another strong peak at 777 cm− 1 is due to the contribution from hydrocarbons in the quasi-ceramic structure.
OH group produced as a result of the hydrolysis of alkoxysilanes. The peak at 911 cm− 1 was stronger in the gel stage but weaker in the solid stage, probably due to the consumption of the generated hydroxyl groups during the crosslinking and hardening phase. Another strong peak at 777 cm− 1 is due to the contribution from hydrocarbons in the quasi-ceramic structure.
10.3.1.2 Raman analysis of cured coatings and precursor to coatings
To complement the FTIR analysis, Raman spectroscopy can be used to determine the organic as well as the inorganic components in the chemical structure. In gel stage (Figure 10.2), appearance of major peaks is due to hydrocarbon portion in the material. The contribution from carbonyl functionality at 1740 and 950 cm− 1 due to silanol can be visualized. In the solid state, the Raman spectrum show four main peaks between 450 and 3100 cm− 1. Two sharp peaks appearing at 2936 and 2902 cm− 1 correspond to the antisymmetric and symmetric CH2 hydrocarbon portions of the spectra.19,20 The relatively weak peak at 1400 cm− 1 again corresponds to hydrocarbon (CH2 bending/scissoring vibration)21 and another strong peak at ~ 1100 cm− 1 is due to the combined contribution from hydrocarbon and SiOSi backbone. A short hump was observed around 500 cm− 1, suggesting the presence of titanium in an amorphous phase.22,23

10.3.1.3 NMR analysis of cured coatings and precursor to coatings
NMR spectroscopy has been the backbone of organic materials characterization. It can precisely identify the reaction mechanism that may occur during the transition of liquid to gel to solid. Liquid precursor to GCC was analyzed with 13C and 29Si NMR. The 13C NMR analysis in Figure 10.3a shows three major peaks at 3.63 (![]() OCH3), 25.26 (
OCH3), 25.26 (![]() CH2), 30.51 (
CH2), 30.51 (![]() CH3), and 65.52 (
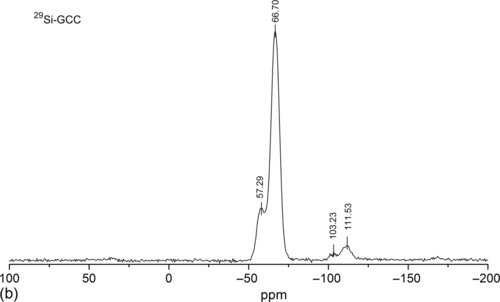
CH3), and 65.52 (![]() OCH2CH3) ppm.24 Similarly, 29Si spectrum (Figure 10.3b) displayed four peaks at − 51.29 (D), − 66.70 (T3), 103.26 (Q4), and 111.53 (Q4) ppm.25
OCH2CH3) ppm.24 Similarly, 29Si spectrum (Figure 10.3b) displayed four peaks at − 51.29 (D), − 66.70 (T3), 103.26 (Q4), and 111.53 (Q4) ppm.25

10.3.1.4 XPS analysis of cured coatings
The GCC-coated specimens were analyzed using XPS (Figure 10.4) to confirm the bonding chemistry with metal surface. Thin layer of GCC was coated on 7075 aluminum alloy (containing Al 87-91 wt.%, Cr 0.18-0.28 wt.%, Cu 1.2-2.0 wt.%, Fe 0.5 wt.%, Mg 2.1 wt.%, Mn 0.3 wt.%, Zn 5-6 wt.%, Si, Ti and others 0.8 wt.%) and dried for 30 days in ambient conditions. A surface survey scan in Figure 10.4a displays the presence of Si, O, Cu, Ti, Na, and Mg. Additionally, small concentrations of Mg (0.15 at.%) and Cu (0.03 at.%) were also seen in the spectrum that originate from the metal substrate. It is expected that coating may have been thin in the surveyed area, exposing the surface roughness peaks that contained copper in solid solution, in Guinier-Preston (GP) zones, or in precipitate. Another assumption is that a small amount of the alloy may have dissolved in the coating during the application process. Single peak occurred at 532 eV in the O1s deconvoluted spectra, which corresponds to oxygen attached to carbon. No peak was found for oxygen attached to silicone in O1s deconvolution, though silicone attached to oxygen was seen in the Si2p deconvolution at 102.5 eV. It appears that the O-Si peak was totally masked by the C-O (siloxane) peak in the O1s deconvolution. The atomic percentage of carbon was 31.84, a value higher than the atomic percentage of silicon (28.21 at.%). However, it was expected that the concentration of carbon in the final coat would be lower than that of silicon. A higher value of carbon suggested that a few of the alkyl groups on the silicones were still present after the hardening/curing process. This is similar to what was observed in FTIR spectrum.
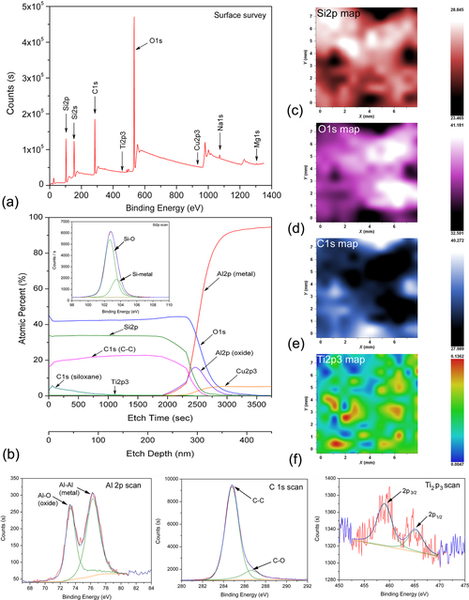
The depth profile (Figure 10.4b) and surface (Figure 10.4c–f) maps suggest that oxygen and silicone were uniformly distributed spatially and through the thickness of the coating. Carbon composition was not uniform in the coating, probably due to the presence of a small amount of unreacted alkoxysilanes. Results show that GCC can form stronger bonds with aluminum and its remnant oxide, but the bond strength of GCC to copper/intermetallics in GP zones or other precipitates that exist in aluminum alloys is still not clear.
The C-O peak (Figure 10.4h) at 287 eV suggested the presence of unreacted methoxy groups in the coating structure while another peak at 285 eV is probably due to C-Si linkage due to surfaced methyl groups.26 The deconvolution of Si2p curve shows two peaks (inset Figure 10.4b) in the deconvolution spectra. One peak occurred at 102.5 eV, corresponding to the SiOSi formation,peak which is generally found at 103 eV and has been shifted due to SiO2 formation.27 This peak at 103 eV suggested that some of the silicone macromolecules were detached from the backbone and had converted to silica.
Two different peaks of titanium were found in the Ti2p spectra (459.15 and 464.98 eV) obtained on the coating (Figure 10.4i). This Ti2p is a doublet separation between 2p1/2 and 2p3/2 peaks with a shift in 5.83 eV binding energy shift.28 It appears that either the rutile or the anatase form of TiO2 had formed as a result of hydrolysis and the subsequent conversion of the titanium compound.29 There is evidence to support that peak at 459.15 eV could have a contribution from Ti-Si linkage.30 This transformation suggests that a uniform distribution of TiO2 nanoparticles can be achieved by sol-gel route of synthesis.
During depth profiling, sodium appeared at 1072.06 eV as one of its salts was added in the coating composition. Silicon was found up through the depth of 400 nm in the coating while the aluminum oxide value peaked at 340 nm. These results suggest that GCC penetrated the inert oxide layer of aluminum and reached the interface of aluminum and oxide to form a bond with the aluminum metal. A silicon peak (as shown in the inset of Figure 10.4b) was recorded after sputtering etch depth of 280 nm, at a point where silicon (Si2p), aluminum oxide (Al2p), and aluminum metal (Al2p) existed together in a narrow domain.
10.3.2 Thermal analysis
10.3.2.1 Thermal analysis of liquid precursor to GCC in inert and air atmosphere
Thermogravimetric analysis was performed on the solid and liquid precursor solution of GCC (Figure 10.5) that contained volatile solvents similar to those reported elsewhere.31–33 The inset (Figure 10.5b) shows weight loss in liquid precursor to GCC as a function of temperature in inert and air atmosphere. The ordinate on the right axis shows derivatograms obtained in inert and air atmosphere.
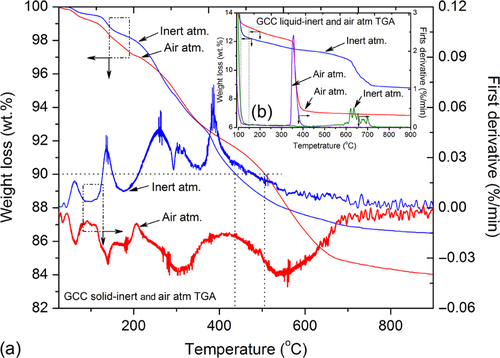
In an inert atmosphere (flowing nitrogen gas) the coating precursor (after the solvent evaporated) decomposed to 13 wt.% at 110 °C and residue at ultimate decomposition was 8.7 wt.%. Similarly, in oxidative pyrolytic atmosphere (flowing air), the precursor decomposed to 13 wt.% at 148 °C, while the residue at ultimate decomposition was 6.8 wt.%. The maximum rate of decomposition occurred at 630 °C in the inert atmosphere while at ~ 360 °C in the air atmosphere.
10.3.2.2 Thermal analysis of solid GCC in inert and air atmosphere
After heating to 100 °C, ~ 85% of volatile components including solvent and free and bound water evaporated from the precursor. After all the volatile components eluted, the precursor transformed to a solid mass and decomposed during the subsequent heating steps as the temperature increased. The left ordinate in Figure 10.5a shows weight loss in solid GCC as a function of temperature in inert and air atmosphere, while the right ordinate displays first derivative obtained as a result of decomposition of solid GCC in inert and air atmosphere. The 10 wt.% decomposition in an inert atmosphere occurred at 506 °C while at 438 °C in air atmosphere. The maximum rate of decomposition in air atmosphere occurred at ~ 205 °C with 16 wt.% residue at ultimate decomposition temperature while in an inert atmosphere, it occurred at 380 °C with 16.5 wt.% residue at ultimate decomposition temperature. Noticeable amounts of degradation incurred at ~ 350 °C in solid and liquid precursors to GCC both in the air and inert atmosphere. The FTIR-assisted evolved gas analysis suggested that at 350 °C crosslinked 3D backbone structure decomposes with the release of silane and associated methyl moiety. Multiple-step degradation patterns were observed in each case, suggesting that the coating network is composed of multicomponent structures.
10.3.3 Nanoindentation analysis
The GCC cures to form conversion coating on metal surfaces. Unlike traditional coatings, peeling of GCC out of substrate for mechanical analysis is not a viable option. The mechanical properties of GCC have to be determined using nanoindentation techniques.34
10.3.3.1 Estimation of hardness and modulus in GCC
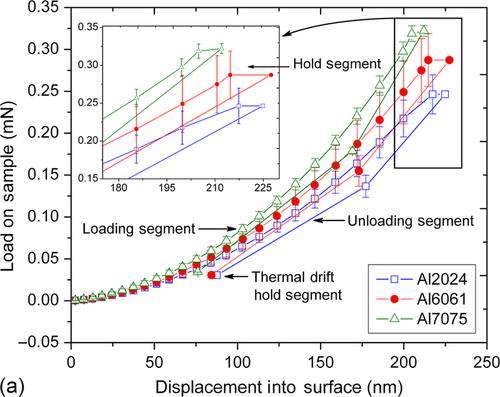
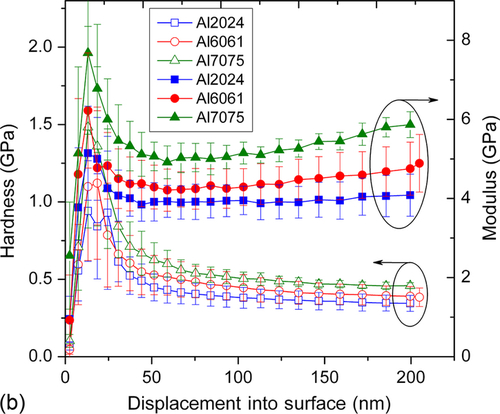
The hardness (H) and modulus (E) were determined by nanoindenter using Berkovich tip. The loading and unloading curves shown in Figure 10.6a demonstrated the elastic recovery of the coatings with negligible plastic deformation.35 A close observation of loading/unloading curves and standard deviation data suggests that the coating has a smooth surface morphology. The loading and unloading curves also indicated that residual deformation was low in each case, suggesting that the coating has elastic nature. There was no deviation or discontinuity in loading and unloading segments suggesting that coating did not delaminate during testing. The H and E values were plotted as a function of displacement into the coating on three different aluminum alloys in Figure 10.6b. The average H for GCC coated on 2024Al, 6061Al, and 7075Al were 0.42, 0.41, and 0.47 GPa, respectively, while the average E were 4.40, 4.51, and 5.45 GPa, respectively. These values are comparable to those obtained on other silicone ceramer coatings.11,36 Similar measurements were recorded on the uncoated aluminum alloys polished to mirror finish to compare the results obtained on the coating. The average H of 2024Al, 6061Al, and 7075Al were 1.87, 1.47, and 2.37 GPa, respectively, while the average E were 77, 76, and 78 GPa, respectively. The slight variation in mechanical properties of GCC shows that the coating may have been influenced by a small degree from the substrate mechanical properties or solubilized alloying elements from the substrate alloy. Note that mechanical properties of the coating are consistent with the substrate except in case of 6061Al where it showed higher standard deviation compared to the other two cases.


10.3.3.2 Estimation of adhesion through nanoscratch
Nanoscratch test using nanoindenter can help in determining the cohesive, as well as adhesive, modes of failure in coatings. The nanoscratch analysis using a nanoindenter could give an insight on adhesion, fracture, and wear characteristics of the material. Moreover, nanoscratch testing could also help in understating the near-surface strength of a material.37,38 When a coating is subjected to a scratch test, the indenter can pass through three key regimes in the material: elastic, plastic, and fracture. The fracture is followed by delamination and chipping off the coated surface. The estimation and application of the correct load required to study the above-mentioned deformations is extremely beneficial. The high load can fracture the coating upon contact, eliminating the appearance of the other two regimes. Therefore, maximum applied load, scratch velocity, and scratch distance are critical in determining the true parameters.
In a typical nanoscratch test, the indenter tip approaches the surface of the test sample at a rate of 30 nm/s. Surface contact was set according to a predetermined increase in measured stiffness, S. The load applied to the indenter was then increased to a small profiling load of 20 μN, and the original surface topography was scanned over the entire scratch path. When the indenter returned to the origin after the initial profiling scan, a preprofile was performed up to the location of the desired scratch position. The indenter was then ramp loaded while the translation stages moved the sample along the scratch path at a rate of 10 μm/s. When the scratch length criteria were met, the indenter was unloaded to the profiling load and a postprofile scan was performed to the same length as the preprofile scan. The pre- and postprofile segments were used to level the scratch cycle data. Once the postprofile was completed, the stages moved into position for the cross-profile segment and the cross-profile was initiated. The indenter was then withdrawn from the sample completely, and the sample was moved into position for the next experiment.
Figure 10.6c shows the penetration curve along with residual surface morphology as a function of the scratch distance on GCC. In this case, sample was scratched using Berkovich tip (face forward) with maximum load of 30 mN with scratch velocity of 10 μm/s until scratch distance of 500 μm. The original morphology of the coating was smooth with average roughness of ~ 40 nm. It appears from the penetration curve that the progressing load bearing the indenter tip pushed the coating and fractured at a critical load of ~ 17 mN after traveling a scratch distance of 385 μm. The depth at critical load was 1450 nm. Moreover, at critical load, the lateral force was 5.72 mN with a coefficient of friction of 0.34. Insignificant plastic deformation (3.6%) was observed in coating with pile-up height of 15 nm.
10.3.3.3 Wear analysis of GCC
Conventional wear analysis involves rubbing spherical head over coated surface and observing the damage after a predefined number of cycles. Nanoindenter head can be used alternatively to gain precise and in-depth information on the removal of material at the end of a predefined number of wear cycles. In a typical nanoindenter assisted wear test, the indenter tip approached the surface of the test sample at a rate of 10 nm/s. Surface contact was set according to a predetermined increase in measured stiffness, S. The load applied to the indenter was then increased to a small profiling load of 50 μm, and the original surface topography was scanned over the entire scratch path. When the indenter returned to the origin after the initial profiling scan, a preprofile was performed up to the location of the desired scratch position. The indenter was then loaded to 8 mN. This load was held constant while the translation stages moved the sample along the scratch path at a rate of 50 μm/s. When the scratch length criteria were met the indenter was unloaded to the profiling load and a postprofile scan was performed to the same length as the preprofile scan. The pre- and postprofile segments were used to level the scratch cycle data. Once the postprofile was completed the stages moved the sample back to the origin (location of preprofile). The indenter was loaded to the profiling load, and the residual topography of the wear track was recorded. This combination of wear cycle and profiling was repeated for 10 cycles. After the completion of the wear cycles, a cross-profile was performed. The indenter was then withdrawn entirely, and the sample was moved into position for the next experiment.
Figure 10.6d shows wear analysis on GCC coated over 6061Al surface. The original surface morphology displayed surface roughness of ~ 250 nm, while after the end of wear cycles surface roughness was ~ 450 nm. On observing average friction coefficient and average lateral force in each cycle, it was apparent that coating failure occurred after seven wear cycles, or the indenter head slides for 4200 μm. The maximum wear track deformation was ~ 550 μm2. The service lifetime of the coating can be predicted by selecting the appropriate testing indenter tip and test environment and approximate service load that the coating could experience.
10.3.4 Surface morphology
A quasi-ceramic or hybrid silicone coating with active hydroxyl functionalities condenses gradually over time, resulting in a dense three-dimensional structure. These high-density coating networks are difficult to study using conventional microscopic techniques.
10.3.4.1 Surface morphological analysis with FESEM
The GCC hardened in ambient conditions over 7075Al was examined with Field Emission Scanning Electron Microscopy (FESEM). Figure 10.7a shows condensed surface texture over GCC without any signs of defects or holidays in the area of the scan. Scratches were deliberately generated on the coated surface to visualize the morphology of the nanoparticles around the scratched regime. Certain regions in the coating were chipped off around the deliberate defect. Little phase contrast observed on the surface was probably due to the nonuniform distribution of the condensed quasi-ceramic sol particulates. An attempt to focus on individual quasi- ceramic particles returned with limited success due to the charging of the sample at an ultrahigh resolution.


To understand the assembly of these nanoparticulates, a cross-sectional FESEM analysis was conducted over ambient condition dried GCC-coated 7075Al surface. The FESEM image in Figure 10.7b shows two distinct layers of GCC. The estimated total thickness of GCC layer was 3 μm. The top layer was dense while the succeeding layers showed bundles—clusters of sol particulates. It appeared that these sol bundles condensed over time to result in dense surface morphology.
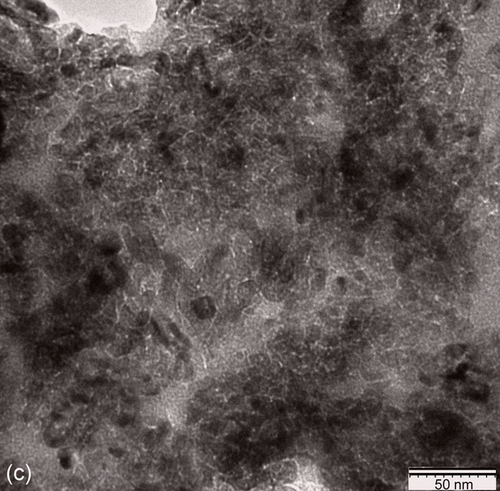
10.3.4.2 Surface morphological analysis with TEM
To visualize the bulk of GCC, Transmission Electron Microscopy (TEM) was conducted on solidified coating. The TEM image in Figure 10.7c displays the distribution of in-situ-generated titanium compound nanoparticulates in the GCC matrix. The average diameter of nanoparticles was ~ 15 nm and substantial agglomeration was observed in certain areas. At a higher magnification, a prominent sharp interface appeared between the nanoparticles.36 It is assumed that these nanoparticles were formed as a result of either the conversion of titanium ethoxide into TiO239 or the condensation into TiOTi macromers.40
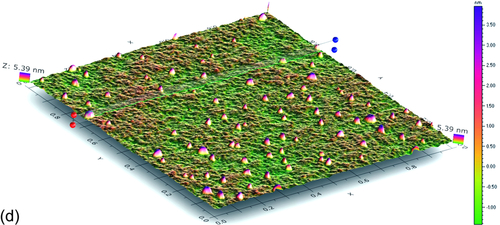
10.3.4.3 Surface morphological analysis with AFM
As mentioned earlier, thin transparent films and coatings are difficult to analyze with conventional microscopic techniques. The Atomic Force Microscopy (AFM) technique was adopted to investigate the surface morphology of the GCC hardened over a mirror shine polished 6061Al surface. A 3D AFM image of the surface roughness is shown in Figure 10.7d. The average particle size was ~ 70 nm while the average height of the heap (formed as a result of sol particulate confinement) was on the order of 225 nm. It is worth mentioning that titanium nanoparticles were in-situ generated during the reaction and drying processes in GCC. The titanium compound chemically bound with the organic functionalities available in the hybrid material. However, domains that contained titanium nanoparticles could be distinctly visualized in AFM. Notice that the surface roughness indicated here includes the roughness that already existed on the bare polished aluminum surface.11 A dense coating network without any signs of holidays was seen in the area under the scan.
10.4 Evaluation of Coating
The corrosion barrier properties of the coatings need to be tested in various simulated and natural corrosive environments. Moreover, the impervious barrier coatings should be tested along with the similar commercially available coatings. In most cases, for simulated corrosive environment tests, ASTM or other industry standards are adopted. In case of natural outdoor atmosphere exposure, results may vary from one place to another. Therefore, results from standard coating should be compared to the new coating. The following sections describe the studies on barrier properties of GCC compared to the other two industrial coatings, chromated (ADC) and nonchromated (ADNC). Due to the proprietary issues with the commercial coatings, these will be designated here with generic designations (i.e., ADC and ADNC).
To visualize the corrosion activity, specimens were imaged using either Video Image Enhanced Evaluation of Weathering (VIEEW) surface analyzer or optical photography. SEM was utilized for in-depth analysis of corroded areas. The scanning procedure was conducted prior to exposure to document the initial specimen condition, and after exposure to document subsequent damage resulting from exposure. The VIEEW system captures digital images of samples under direct and diffuse lighting schemes optimized by the user to highlight and enhance surface defects. Software is then used to process images and quantify damaged areas.
10.4.1 Laboratory experiments
10.4.1.1 Immersion tests
The metals coupons were pin-stamped, surface prepared, and dip-coated with GCC in the lab facilities (Figure 10.8) while the commercial coatings were applied by the third-party vendor in accordance with the coating manufacturer’s standard procedures. Coatings were cured in ambient conditions for at least two weeks.

10.4.1.1.1 Immersion in ASTM seawater and sodium sulfate solution
The immersion test was performed in simulated seawater as per ASTM. Aluminum alloys 2024, 5086, 6061, and 7075 were treated with GCC, ADC, and ADNC coatings. Coupons were scribed to test the corrosion behavior at the coating and scratch interface. Coupons were immersed in air-exposed electrolytes at 30 °C. Each beaker contained three similar coupons that were mounted on plastic holders. Figure 10.9a shows immersion setup for ASTM seawater and 0.5 M Na2SO4 solution. Figure 10.9b shows the coupons mounted on the plastic sample holders that were retrieved after the immersion experiment.
In general, uncoated coupons showed more severe corrosion damage than did coated coupons. The corrosion was severe on the back side of coated coupons compared to the front side, probably due to coating damage during the application and drying process. Figure 10.10a–d shows corrosion damage calculated from VIEEW image analysis for uncoated and coated coupons after 2 months and 6 months of immersion test in ASTM seawater and 0.5 M Na2SO4 solution respectively. In the case of coupons retrieved from ASTM seawater immersion, GCC displayed similar corrosion protection as ADC and outperformed ADNC-coated coupons. Also, 5086Al-coated coupons were better protected than the others. Similarly, in the case of coupons retrieved from Na2SO4 immersion, the GCC displayed comparable corrosion protection as ADC and outperformed ADNC-coated coupons. Moreover, 6061Al-coated coupons were significantly protected compared to other coupons.

10.4.1.2 Surface appearance investigations
10.4.1.2.1 Appearance after immersion in ASTM seawater
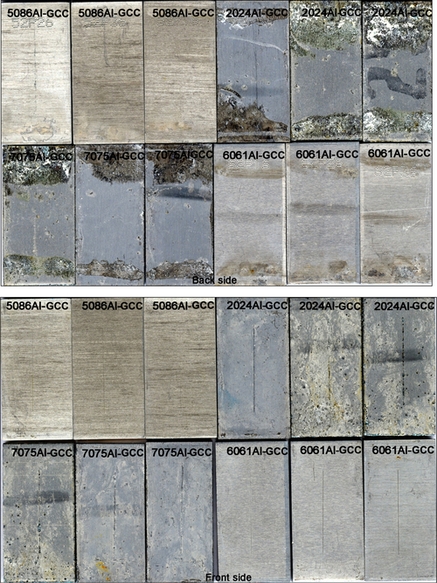
The uncoated and coated coupons were immersed in ASTM seawater and retrieved after the predetermined exposure period. The corroded coupons were cleaned and analyzed using VIEEW image analyzer. Figure 10.11a shows VIEEW scans of uncoated coupons. Three coupons for each alloy were scanned, but only one coupon from each set is shown here. The red color over the image represents the damage due to corrosion. The severe corrosion could be seen on the uncoated 2024Al and 7075Al coupons. Moderate corrosion was observed over the 5086Al and 6061Al coupons. Figure 10.11b shows VIEEW scans of GCC-coated coupons. The corrosion damage on the back side of the coupon is probably due to the loss of coating during the application and drying process. The coated coupons were generally protected from corrosion. The corrosion was observed in the region of deliberate scratch. No coating delamination was observed near the scribed regime.

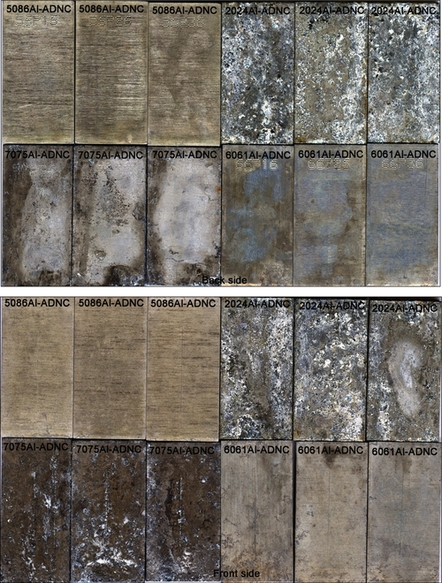
Figure 10.11c shows VIEEW scans of ADC-coated coupons. In this case, both the back and front sides of the coupon showed superior corrosion protection. However, corrosion was observed in the region of the deliberate scratch. Figure 10.11d shows VIEEW scans of ADNC-coated coupons. The back as well as front sides of the coupons were severely damaged due to corrosion, suggesting that the coating was not impervious and did not provide adequate protection to the metal surface.
10.4.1.2.2 Appearance after immersion in sodium sulfate solution
The uncoated and coated coupons were immersed in 0.5 M sodium sulfate solution and retrieved after the predetermined exposure period. The corroded coupons were cleaned and analyzed using the VIEEW image analyzer. Figure 10.12a shows VIEEW scans of uncoated coupons. A high degree of corrosion damage was observed on the back and front sides of the coupons. The severe corrosion could be seen on the uncoated 2024Al and 7075Al coupons. Moderate corrosion was observed on the 5086Al and 6061Al coupons. Figure 10.12b shows a VIEEW scan of the GCC-coated coupons. The back side of the coupon suffered severe corrosion damage while the front side of 5086Al and 6061Al were significantly protected. The front side of 2024Al and 7075Al coupons displayed moderate corrosion. The corrosion was observed in the region of the scribe, but no coating-substrate delamination was observed. Figure 10.12c shows VIEEW scans of ADC-coated coupons. The back side of the coupon displayed moderate corrosion while the front side of the coupons displayed superior corrosion protection except in few cases where the coating might have been damaged during the application process. Figure 10.12d shows VIEEW scans of ADNC-coated coupons. The backs as well as the front sides of the coupons were severely damaged due to corrosion, suggesting that the coating was not impervious enough to provide adequate protection to the metal surface.

10.4.1.2.3 Analysis of coupons retrieved after immersion test
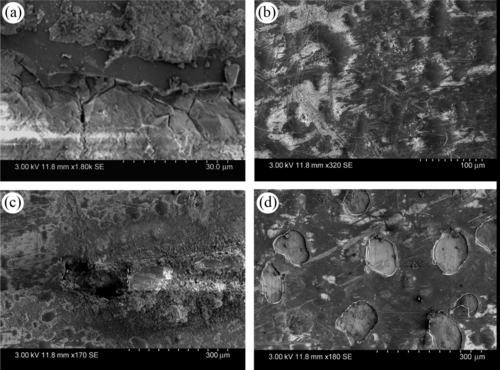
The corroded coupons that were retrieved after immersion test were studied under the SEM to understand the corrosion process in GCC-coated coupons. Figure 10.13a–d display the SEM images acquired over four different aluminum alloys.


In the case of GCC-coated 2024Al coupons (Figure 10.13a), the coating was moderately effective in preventing the corrosion on the substrate. Though scattered pinholes were observed, most of the surface was protected. No sign of coating delamination was observed in the area around the scratch. The corrosion products precipitated and crept out of the scratched region; the edges and corners of the coupons were not protected by the coating. In the case of GCC-coated 5086Al coupons (Figure 10.13b), the coating was impervious and protected the substrate. Little to no corrosion damage was observed in the region of the scan. Moderate corrosion activity was observed in the scratch, but no sign of coating delamination was seen. The edges and corners were significantly protected, and coating was well adhered to the metal surface.
In the case of GCC-coated 6061Al coupons (Figure 10.13c), the coating was effective in protecting the surface. Little to no corrosion activity was seen on the coated surface; however, white precipitate was scattered all around the surface. No sign of coating delamination was observed near the scratched region. Moreover, the edges and corners were protected. In the case of GCC-coated 7075Al coupons (Figure 10.13d), the coating was effective in protecting ~ 80-90% of the substrate. Even so, severe corrosion activity was observed in some regions around the scratch, and some regions of the coating were thoroughly covered with the corrosion product. Also, the edges and corners were severely damaged.
10.4.1.2.4 Surface appearance after accelerated weathering according to ASTM-B117 standard
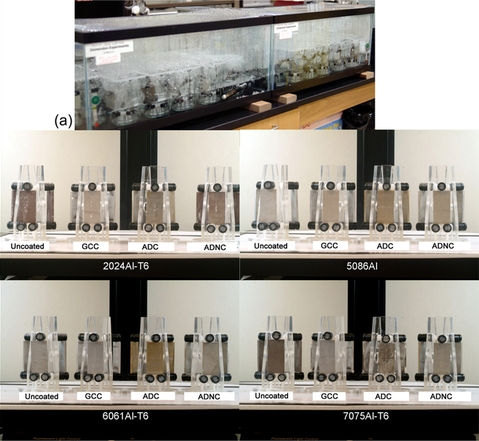
The uncoated and coated coupons of 2024Al, 5086Al, 6061Al, and 7075Al were tested for 2688 hours as per ASTM standards. The coupons were scanned using a photo-scanner to visualize the corrosion damages over the surface of the coupons. Figure 10.14a–d illustrates the corrosion phenomenon over the uncoated and coated aluminum surfaces. In general, the uncoated coupons suffered severe corrosion damage compared to the coated coupons. The coated 5086Al and 6061Al coupons were significantly protected while coated 2024Al and 7075Al coupons were most affected by the corrosion. The GCC and ADC coatings provided comparable and better corrosion protection than did the ADNC coating.


10.4.1.2.5 Analysis of coupons retrieved after accelerated weathering
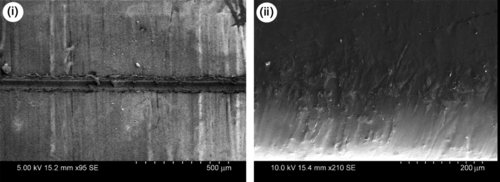
The coupons retrieved after accelerated corrosion experiments (ASTM B117) were studied under the SEM to understand the corrosion process in the GCC-coated coupons. Figure 10.15–10.18 displayed the SEM images acquired over four different aluminum alloys. Several deep pits were observed in certain regions of the 2024Al-coated surface. Figure 10.15 shows corrosion product over the scribed coating, but the coating was adhered to the metal surface. The end of the scribe displayed severe corrosion and pit formation.


In the case of GCC-coated 5086Al coupons (Figure 10.16), corrosion product was found near the scratched region. Moreover, no pit formation or coating delamination was observed. Severe degradation of the coated surface was seen at the edge of the specimens. Similarly, in case of GCC-coated 6061Al coupons (Figure 10.17), the corrosion product covered the scratched region of the coating. No coating delamination was observed in this case. The edges and corners of the specimens were significantly protected. In contrast, GCC-coated 7075Al coupons (Figure 10.18) suffered severe damages due to corrosion. The coated surface chipped off, resulting in deep pit formations as well as edges and corners severely damaged.
10.4.2 Outdoor experiments
To accomplish this testing, four specimens of each coating condition were coated. One of the four specimens was subsequently scribed to study corrosion at a deliberate coating defect. After the virgin and coated coupons were analyzed and scanned, each coupon was mounted onto a faceplate using nonconductive Delrin® insulators and nylon fasteners (Figure 10.19). The uncoated coupons, coated coupons, and coated-and-scribed coupons were mounted alongside each other at the six test sites. Uncoated and coated coupons were exposed at the outdoor (natural weather) testing facilities (Figures 10.20–10.25) developed at Hawaiian Islands by the Hawaii Corrosion Laboratory in the University of Hawaii at Manoa. Coupons were exposed at Lyon Arboretum (LA), Coconut Island (CIL), Campbell Industrial Park (CIP), Kilauea (KLV), Marine Core Base Hawaii (MCBH), and Mauna Loa (MLO). These sites were selected because these represent the diverse corrosive climate conditions. The bare and coated coupons were mounted with the pin-stamped surfaces facing downward. The scribed specimens were mounted with the scratched surfaces facing up. After retrieval from the outdoor exposure, the coupons were cleaned in an ultrasonic bath and wiped with ethanol.


10.4.2.1 Assessment of corrosion damages
Both sides of each coupon (uncoated and coated) were scanned prior to and after exposure using the VIEEW surface analyzer. Cleaned coupons were scanned using the preset imaging procedure in the VIEEW image analyzer. Both top and bottom surfaces of the uncoated and coated coupons were scanned to visualize and quantitatively determine the amount of damage caused due to corrosion. Damage caused to the coated surface was compared to that on the uncoated surface of the same metal alloy.
Figures 10.26–10.28 show the percentage of corroded surface area for each alloy as a result of 12 months of exposure at LA, CIL, and CIP. In these bar diagrams, the percent corrosion damage (average value reported) and standard deviation bars are based on three specimens for each condition. The LA test site receives a high amount of rainfall with a negligible amount of chloride content. At this site (Figure 10.26), 2024Al and 6061Al were significantly protected by GCC and ADC. Significantly less corrosion damage was observed on 7075Al coupons coated with both GC and ADC. The CIL is a marine test site and receives a high amount of chloride content deposition on the exposed metals. Similar to LA, coupons at this site (Figure 10.27) displayed similar corrosion trends. Corrosion was severe over uncoated and coated 7075Al while 2024Al and 6061Al remained protected. The corrosion on GCC-coated 7075Al was less than ADC-coated 7075Al coupons. The CIP test site receives high amount of corrosive industrial gases, but not the significant chloride ions. At this site (Figure 10.28) corrosion activity was higher on the coated 2024Al and 6061Al test coupons while corrosion on coated 7075Al was similar to those on other two test sites (i.e., LA and CIL). In general, the GCC-coated coupons displayed better corrosion protection compared to ADC-coated coupons. Results from the three test sites suggested that GCC and ADC provided corrosion protection over 2024Al and 6061Al. Also, GCC provided better corrosion protection than ADC. However, no significant corrosion protection was imparted to 7075Al by either GCC or ADC.
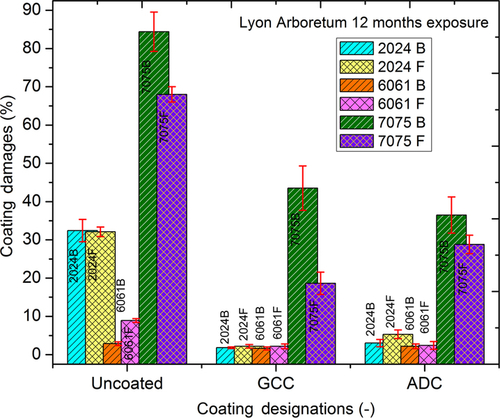
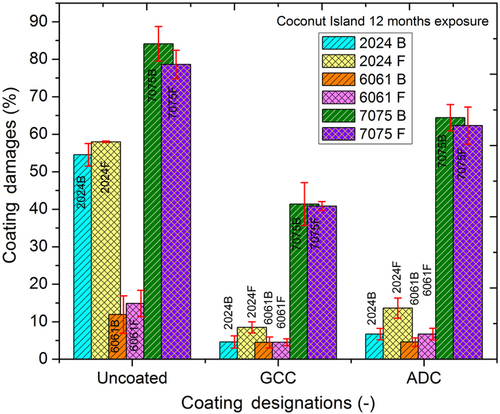

Figure 10.29 shows a picture of the coupons mounted on the faceplate that were exposed for 12 months period at KLV test sites. Severe corrosion was observed on the uncoated and coated coupons. An attempt to scan the coupons using VIEEW did not succeed due to poor surface contrast on the coupons as a result of severe corrosion. Visual inspection suggested that similar corrosion damages were observed on GCC- and ADC-coated coupons.

10.4.2.2 Analysis after UV light exposure test
Uncoated and coated coupons were mounted on face plates and exposed for 6-month periods at MLO test site in Hawaii situated at 110,000 feet elevation (Figure 10.25). After the exposure periods, no visual damage was observed on the coated specimens. To check the structural integrity, coated coupons were analyzed using Raman spectroscopy. Figure 10.30a,b shows Raman spectra that were collected before and after 6 months of exposure of the coated aluminum alloys. No significant difference was observed in the Raman spectra before and after the exposure, suggesting that the coating remained unaffected by the solar radiation.


10.5 Conclusion
Synthesis of GCC through sol-gel route has been achieved. The role of each chemical entity and chemistry behind the smart composition has been described in detail. The liquid precursor to the coating and solidified coating has been characterized with FTIR, Raman, NMR, and X-ray photoelectron spectroscopy. The XPS peak assignments confirmed that the coating composition penetrated the inert oxide layer of the metal and formed covalent bonds with available active functionalities over the metal surface. Thermal studies performed on the liquid precursor and solid material helped in the understanding of the presence of multiple chemical entities in the material, and their degradation patterns confirmed the absence of environmentally hostile chemical constituents. The nanomechanical analysis using nanoindentation helped in analyzing the strength of the coating over the metal surface. The nanoindentation results and morphological studies confirmed that the GCC formed a condensed barrier film over the metal surface. The corrosion barrier strength was evaluated by conducting a series of laboratory and outdoor experiments. The anticorrosion properties of the GCC were compared with the two commercially available conversion coatings. Based on results from the laboratory and outdoor exposure experiments, it was concluded that the GCC acted as impervious barrier against corrosion similar to the commercial chromate conversion coating and outperformed the commercial nonchromate conversion coating.