Readouts and Related Devices
Secondary systems are needed to handle primary element signals and the variables necessary to correct flow from flowing to base conditions. The types experiencing the fastest growth are the electronic systems designed to take advantage of the rapidly growing availability and value of computers. The features and advantages of electronic systems for flow calculation are discussed in this chapter, as are the required features of the related devices needed for flow measurement.
The inability to obtain a correct sample of a mixture of water and oil is a common source of inaccurate measurement in crude oil. Natural gas sampling presents a different set of problems, and many different methods have been approved and used in the gas industry to sample natural gas, with varying success. Crude oil and natural gas sampling are also discussed in this chapter.
Keywords
secondary systems; electronic systems; flow calculation; crude oil sampling; natural gas sampling; transducer
Secondary systems are a part of any measurement installation for handling primary element signals and the variables necessary to correct flow from flowing to base conditions. These elements fall into three main categories: mechanical, pneumatic, and electronic. All have applications in flow measurement. The choice can depend on a number of parameters, not least of which may be personal preference based on a given industry or company’s experience. The fastest growing segments are the electronic systems designed to take advantage of the rapidly growing availability and value of computers.
Electronics
Several stages of development have taken place in the move to electronics. First was the glamour of being “up to date.” Using the new electronics at that point often created about as many problems as were solved. The common reaction was, “electronic equipment does not work,” because of the amount of work required to keep it running. Designers then came up with developments and improved capabilities, and users began a more studied evaluation of true needs and uses. These evaluations defined the most useful areas in which to apply the devices.
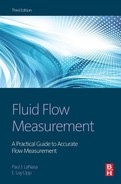
The present generation of transducers and computers is well received by users, more and more of whom are converting to electronics each year. There are several reasons for this user acceptance. The operating service (uptime) provided is equal to, or better than, mechanical and pneumatic types. Many additional capabilities are possible (e.g., smart transducers, etc.). Minimal maintenance is required. Trained personnel are available to install and maintain the units, and power requirements have been reduced to the point that auxiliary power sources such as solar charged batteries may be used for remote locations (Figure 13-1).

“Simple” computers may calculate a flow rate and totalize flow for a meter. Or computers can be operating centers for measurement, control, and communications in complex multimeter systems. Computers can develop the complete volume calculation and print appropriate hard copy or feed a central control or computer center with the complete accounting procedures. They can provide real-time operation and control information for metering systems.
Their primary limitation is the cost justification compared to alternative ways to achieve desired measurement over a given service life. Systems for individual meters may cost only several hundred dollars, whereas larger meter stations can run to over half a million dollars. Cost effectiveness usually boils down not to accuracy considerations, but rather to efficiency of solving equations and the true need for speed. This is required in pipeline measurement to keep the bulletin boards current, as required by the Federal Energy Regulatory Commission (FERC).
The manner in which equations are broken down in standards and references indicates that their values are independent and are individually addressed. This is an inherited interpretation based on the capabilities of past equipment. As long as conditions are relatively stable, the use of averages does not introduce significant errors. For varying flow, however, the basic equation requires the variables to be interpreted on a continuing basis with the readout system’s frequency being faster than the flow system change. Such changes can be quite rapid, and the frequency response requirement demands the use of an electronic system for accurate flow measurement. A system that does not change much over hours of operation, on the other hand, can provide measurement without requiring continual integration from electronics related equipment (Figure 13-2).

Related Devices
Most related devices have an accuracy in the general range of ±0.15 to ±1% of full scale. This makes it important to choose transducers with the right ranges; measurements should be in the upper two-thirds of device ranges. The higher the differential, the more accurate the meter reading, provided flow does not exceed the differential device’s range. Many users, not recognizing the effects that auxiliary instrumentation can have on the accuracy obtained by a given meter, compromise flow accuracy accordingly. The overall accuracy obtained includes the inaccuracies of each of the auxiliary devices and how they are used, as well as the primary meter accuracy. Sometimes the auxiliary devices may control the accuracy of the results more than the basic meter. For example, with gases (particularly near their critical points), a change of one pound can represent several percent in flow. This says two things: 1) it would be better to measure at some other location where conditions are farther away from critical points; or 2) the accuracy required for pressure measurement must be increased several-fold to maintain the same limits for the corrected flow measurement.
Pressure measurement for liquid flow is straightforward. Liquids are generally less sensitive to their pressure measurement. However, in areas near the liquid critical point, density changes significantly, and pressure does affect flow measurement accuracy.
Location of the pressure tap for a meter is based on the meter calibration, in the same manner as one of the differential pressure taps for an orifice flow meter with gas flow. The tap into the line should be at a point specified so that flow past the properly made tap creates no undue turbulence, which can affect the reading.
The ideal point to measure pressure (at the point of velocity or volume determination) is usually not possible—or at least not practical—with most meters. When such mechanical problems make it impossible to install a pressure measurement tap at the proper point, then corrections may be required to account for the difference between the correct point and the actual point. Sometimes the difference is simply ignored if the difference does not affect density or flow calculations “seriously.” The orifice equation for gas has an expansion factor in it to make the required correction. The difference can also be accounted for as part of basic meter-system calibration.
Pressure transducers must be calibrated on a routine basis to maintain accurate measurement. The standard most commonly used is a dead-weight tester or precision gauge for higher pressures, and a manometer for lower pressures.
Temperature transducers present problems that are similar to pressure transducers. Since actual volume flow normally is not at base conditions, a measurement of the flowing temperature is required to correct for the difference. Accurate measurement of temperature is more difficult than it appears since the transducers normally require insertion into the flowing stream and thus disturb smooth flow, which consequently disturbs a meter’s operation if it is improperly installed. Therefore, temperature is normally measured at some point downstream of the meter after making sure that temperature will be essentially the same as the temperature in the meter.
The effect of ambient conditions on the readout equipment is also important. Radiation from the sun and conduction from pipeline heat can affect temperature readings by changing the temperature of thermowells and/or affecting transducer mechanics. For utmost accuracy, the instrument environment should be controlled by heating and cooling, shading, or insulation, depending on the required flow accuracy and the effect that temperature has on the fluid properties and flow measurement. Fluids near critical points are prime candidates for this treatment, whereas other less critical fluids generally require no unusual treatment. Smart transducers have helped minimize some of these ambient effects at less overall cost than some of the other treatments possible.
Differential pressure is the most important variable for differential head meters, since most errors in flow measurement with differential meters come from this measurement. These errors are so critical because differential pressure is the major variable in calculating flow. The maximum differential used with these meters is in the range of several hundred inches of water (i.e., less than a 10 psi drop). Quite often, static pressures may run hundreds of pounds, so the measuring device has a static pressure load on it of about 1,000 psia, yet it is trying to measure a difference in pressure of 1% or less of its static range. This requires the differential device to be rugged enough to withstand the high pressure requirement, yet sensitive enough to measure a very small pressure difference.
To minimize the differential problems (consistent with the required flow range), operate with the differential at higher values—provided the strength limit of the pressure-drop creator is not exceeded. Because of the cost of lost pressure, the differential pressure devices commonly used are in the 100 to 200 maximum of inches-of-water range. The devices used include manometers (used at low static pressures), diaphragm bellows, and mercury-filled meters. These devices must be calibrated against manometers or dead weights. They are usually tested and calibrated at atmospheric pressure and then re-zeroed at line pressures. Some test devices that operate at line pressures are available, but their use is often restricted to laboratory work rather than field calibration.
Maintenance of differential devices consists of periodic calibration and, if necessary, replacement of driving mechanisms. In dirty service, periodic cleaning may be necessary, or the use of seal pots or isolating diaphragms may be required to prevent contamination (Figure 13-4).

Where wide ranges of flows are expected, multiple transducers can be used on a single meter to expand its range. For example, a more accurate low differential device, such as a 20-inches-of-water unit, can be manifolded into the same meter as a 200 inch unit. This combination expands the range of flow from 3 to 1 (on a 100 inch unit) to approximately 10 to 1 at similar accuracies. If ranges beyond this are required, then a second or third meter with proper valving can be used, with meters being switched in and out as the flow varies. Combinations of this sort allow an almost infinite flow range to be handled.
As previously stated, for the most precise flow measurement, the use of the smart differential devices is an investment of value to minimize calibrations and the effects of ambient conditions on the device.
Relative Density or Specific Gravity
Reducing fluid measurements from flowing conditions to base conditions requires identification of fluid composition. The most useful parameter for this is the specific gravity or relative density of the fluid. Correlations in the petroleum industry are based on these measurements, and data for other mixtures are expressed in these terms. For pure products, the need for specific gravity reduces itself to the ratio of specific gravity at flowing conditions to that at base conditions, which allows for the correction of the effects of pressure and temperature on the pure product. Quite often a formula (equation of state) is available which expresses the effects of pressure and/or temperature, and specific gravity correction can be made with suitable measurements.
The several definitions of specific gravity used in the flow measurement business are important to understand. For natural gas, the definitions in AGA-3 are the molecular weight per unit volume of gas compared to the molecular weight per unit volume of air at the same conditions of pressure and temperature. This definition of “ideal specific gravity” ignores the corrections for compressibility when these measurements are made at atmospheric pressures, since such corrections are relatively small. However, this yields a specific gravity that is different by a small amount from the ratio of molecular weights including compressibility (which is equal to the real specific gravity). In non-natural-gas measurements, these definitions are not used. And the normal definition used outside of the natural gas industry for specific gravity is the ideal AGA-3 definition (i.e., the ratio of molecular weights).
In liquid measurement with the English system of units in the United States, the definition of relative density (specific gravity) is different, in that the weight per unit volume of the liquid is compared to the weight per unit volume of water at 60°F. Water at 60°F has a defined weight set by the International Steam Tables, so that a liquid specific gravity is directly convertible to density by multiplying the weight of water at 60°F times the specific gravity of the fluid.
(13.1)
This calculation is not possible with natural gas since there is no specification for the base air conditions, and hence no specific weight may be assigned (Figures 13-5, 13-6).

When specific gravity alone does not sufficiently represent composition for flow calculations, then an analysis is required. This can happen when variable components make up a sample with the same specific gravity. Natural gases and mixed petroleum liquids exemplify the problem.
Sometimes there is a need to know the constituent makeup for pricing information if each component has a separate value. Corrections may be made for non-hydrocarbon constituents in the streams.
Sampling is a science unto itself, and great care must be taken to get a representative portion of the flowing stream for testing. Samples should be taken from sample probes installed in the lines extending away from the pipe walls into an area where good turbulence exists. A homogeneous mix should be present at this sample point. Getting a sample into a container, transporting it, and transferring it to the chromatograph offer many chances for introducing errors by distorting the sample characteristics. For this reason, in-line chromatographs with short sample lines running directly to the unit are typically used where practical.
Fluids difficult to sample include: light hydrocarbon liquids, gases at atmospheric pressure and ambient temperature, saturated gases, water and/or hydrocarbons, gases containing hydrogen sulfide, condensing gases or vaporizing liquids, crude oils containing water, and emulsions. In these cases, special procedures and equipment are required for sampling. But even when these considerations are recognized, getting good samples requires perseverance and often some luck. In the most sensitive cases, direct sampling into the analysis equipment is required. It is no field for an amateur to enter. For example, analysis values involved in the petroleum industry affect the exchange of money—and purchasers do not care to pay for crude oil when water has been measured as crude oil because of improper sampling. Likewise, natural gas improperly sampled may result in an inaccurate energy calculation—so the money is paid for a product not actually being delivered.
Crude Oil Sampling
A source of inaccurate measurement of crude oil is the inability to obtain a correct sample of a mixture of water and oil. Since “water and oil do not mix,” special provisions must be made to mix the two liquids prior to sampling. This can be done in several ways:
• Normal mixing due to flow disturbance following a piping fitting such as an elbow in horizontal or vertical piping with sufficient velocity to cause the oil and water to mix.
• Static mixing with mechanical mixers (turbulence creators) inserted in the pipeline immediately upstream of the sample point. (Note: This mixer must be installed outside of the required meter tube lengths specified in the meter standards and is best located downstream of the meter.)
• Power mixing with an external pump that removes a small stream and reinjects it under pressure immediately upstream of the sample point. (Note: The mixing begins to reseparate within a few pipe diameters after the injection point.)
The choice of which method to use depends on the velocity in the pipeline and the piping configuration. The American Petroleum Institute (API) Chapter 8 presents complete recommendations for sampling liquids. The general requirements are for the flows to be well mixed, and that can be accomplished in several ways as shown:
It is critical to follow recommended procedures when sampling pipeline quality crude where water contents are low (below 1%). In large pipeline meter stations or ship loading installations with high flow rates, this small percentage represents a significant amount of money to both parties. The same procedures must be followed to ensure mixing at production meter stations with higher water contents.
Natural Gas Sampling
Many different methods have been approved and used in the gas industry to sample natural gas with varying success. Recognizing this, the industry—with the support of the Gas Processors Association (GPA), the API, the Gas Research Institute (GRI) and the Mineral Management Services (MMS)—sponsored testing at the Southwest Research Institute (SWRI) to completely evaluate the gas sample question (Table 13-1). The sampling results are used as indirect and direct multipliers for volume and determination of heat value. The inclusive tests and related work were completed and published last in 2006 as API MPMS Chapter 14, Section 1, “Collecting and Handling of Natural Gas Sample for Custody Transfer.” This information should be carefully reviewed by the flow measurement practitioner in order to have the latest quality information and procedures for gas sampling.
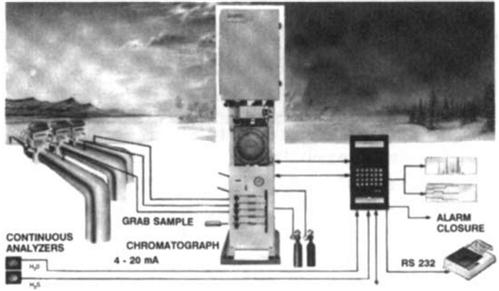
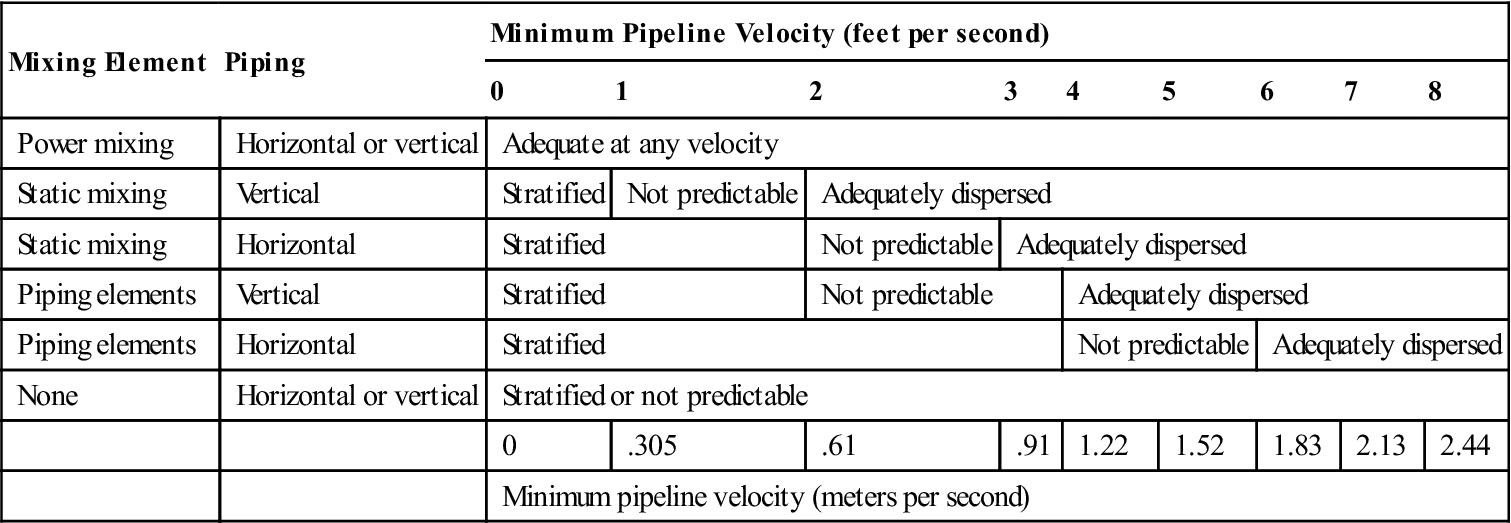
Table 13-1
Suggested Minimum Velocities versus Mixing Elements
| Mixing Element | Piping | Minimum Pipeline Velocity (feet per second) | ||||||||
| 0 | 1 | 2 | 3 | 4 | 5 | 6 | 7 | 8 | ||
| Power mixing | Horizontal or vertical | Adequate at any velocity | ||||||||
| Static mixing | Vertical | Stratified | Not predictable | Adequately dispersed | ||||||
| Static mixing | Horizontal | Stratified | Not predictable | Adequately dispersed | ||||||
| Piping elements | Vertical | Stratified | Not predictable | Adequately dispersed | ||||||
| Piping elements | Horizontal | Stratified | Not predictable | Adequately dispersed | ||||||
| None | Horizontal or vertical | Stratified or not predictable | ||||||||
| 0 | .305 | .61 | .91 | 1.22 | 1.52 | 1.83 | 2.13 | 2.44 | ||
| Minimum pipeline velocity (meters per second) | ||||||||||
Some of the evaluations that were studied and made available are the three methods of sampling presently used and covered in the standards:
These studies have been subdivided into these spot sampling areas:
2. physics of the gas to be sampled;
3. requirement of maintaining the sample temperature above dew points;
4. effects of sample-system material that comes into contact with the sample;
5. effects of the type of gas to be sampled on the choice of the process;
This document covers sampling flows from those as simple as methane-rich streams (lean gas) that have been dehydrated and cleaned, to those as complex as samples as saturated gas flows. The value of this work is the empirical data that were taken to support the decisions made—some of which may require totally new and different approaches.
The report shows that root causes of gas sample distortions were found to include poor sampling systems and procedures, surface effects, thermodynamic problems, purge problems, and leaks.
From the document’s results, it is clear that to obtain undistorted gas samples or to minimize distortion, attention should be paid to equipment cleanliness (particularly reused equipment), temperature of the sample equipment surfaces, hydrocarbon and water dew points, temperature at the sampled gas, the flowing thermodynamic state of the gas, (temperature, pressure, and composition) and the flow path of the gas (i.e., restrictions of the flowing cross-sectional area). The appropriate method for a particular flow condition should be chosen based on all of the above.
Some of the results indicate that present sampling systems may over- or underestimate the total heat value and density of the gas. The basic problem being addressed is getting the answer correct. Most exchange of natural gas is now based on total heat content, not just volume, as it was in years past. So the control of system economics is based on total heat flows within the system, not just a volume balance.
Analysis allows calculation of parameters important to flow measurement, such as relative density (specific gravity), heating value, compressibility factor, inert content, and density. Calculations are based on mixture laws and are accurate at base conditions, but conversion to flowing conditions is not easy and can, in certain circumstances, introduce errors where the mixture laws break down because of shrinkage (such as mixtures of light hydrocarbon liquids or two-phase gas flows).
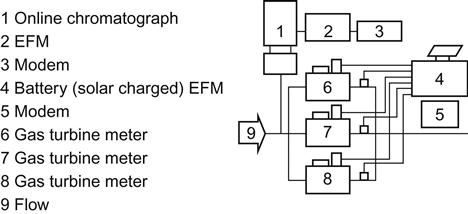
The most common analysis instrument is the chromatograph. Based on standardized samples, chromatographs can be calibrated to cover wide ranges of fluids. Easily maintained, their calibration can be checked with a standard sample with a similar component makeup. The units come in models that can be applied continuously or intermittently when a sample is available. Most are permanently installed, but portable units can be used as line monitors at strategic locations until a problem arises elsewhere; then the portable unit can be taken to the problem site for on-the-spot analysis (Figure 13-7).
Calorimetry
Where a heating value is needed, a calorimeter can be installed to continuously monitor a stream. Alternatively, samples can be taken at meter locations and individual samples tested at a centrally located calorimeter. After all inputs have entered a pipeline, a single unit is often used to determine the heating value at all downstream locations. The choice between chromatograph and calorimeter depends on product value (quantity and cost) and the contractual requirement for corrections (i.e., most require correction for heat value, while some only require that a minimum heat value be maintained).