
Chapter 7
The Data Product Ecosystem
The teacher’s first duty is to watch over the environment, and this takes precedence over all the rest. Its influence is indirect, but unless it be well done there will be no effective and permanent results of any kind, physical, intellectual or spiritual.
—Maria Montessori
Our children attended Montessori schools for the first years of their education and we loved it for the unique educational approach. Maria Montessori believed the right conditions encourage the right behaviors.
Among the core principles she espoused was a “prepared environment,” or a learning environment that is carefully conceived to support student success. The classrooms are often quite beautiful. The space is clean, open, and well organized. Big learning concepts are broken into small building blocks for “work.” The work materials are of high quality and easy for children to manipulate. Students know where to find different types of work, and they have free reign to choose the pieces that are most interesting to them.
What are the conditions in your organization that will encourage and support the flow of information through data products? How can you create an environment in which data product authors have the tools they need to be successful? What does it take to allow good data products to flourish?
In this chapter, you will learn:
- How data products can be different in their purposes but share common characteristics
- The ways in which the Apple app store provides a model for a data product ecosystem
- The six foundational elements that compose an effective data product ecosystem
Data Products for Information Delivery
This book describes data products as the medium for communication in your organization. Data products include the periodic reports that explain what’s happening in a functional area, the dashboards that attempt to provide a high-level view of performance, the spreadsheet models that describe financial projections, and the presentations that tell a story with data. In a blog post about data products, Harlan Harris says, “Data products make it easy for regular people to get what they need without having to dive into a very complex set of data and a very complex set of algorithms.”1
We use the term “products” because they represent the transformation of data into something useful that can be delivered to the people who want to consume the information. The best data products are:
- Results-focused—Data products should be targeted to answer specific questions or solve particular problems.
- Right-sized—A data product that tries to do too much will be hard to explain to the audience, whereas one that tackles too little will seem trivial.
- Context-sensitive—Authors of data products should have domain expertise and use this knowledge in choosing what data to emphasize.
From this definition, there is a clear gap between data products and general-purpose tools for business intelligence, statistics, analysis, or visualization. These analytical tools may be used to create data products, but they are not themselves focused, purpose-built products.
Data products come in many varieties—both in form and function. In some cases, data products emphasize the ability for users to explore the data independently. Others lean toward guided storytelling, a vision driven by the author more than the audience. Along another dimension, there are a set of data products that offer varying degrees in which the author can enhance the data through analysis, introspection, and features. Figure 7-1 shows how different types of data products can be mapped by these characteristics.

Figure 7-1: Data products classified by level of enhancement and audience vs. author control
Necessary Conditions
Sun and water and soil make the flowers grow. What will make your data products flourish? This chapter is an exploration of the conditions that, taken together, create a fertile environment for data to flow freely. Data products need an environment that:
- Encourages the right data products to be created and shared;
- Makes it easy for knowledge workers to find the right information for their job;
- Cleans out the old and irrelevant data products, like a gardener who diligently weeds.
Creating an ecosystem for data products requires processes and tools. Processes set standards and ensure that the right priorities and qualities are built into every data product. Technology tools gather data, visualize the results, and distribute data products to users. Here are the six conditions (“the Six Ds” shown in Figure 7-2) that we have found most critical to the data product ecosystem:
- Demand—What are the most important areas that would benefit from the insights and guidance of better data?
- Design—What processes and tools can help ensure effective design of data products?
- Develop—What processes and tools support the efficient production of data products, including gathering multiple data sources, presenting this data, providing user customization, and delivering the information to data consumers?
- Discover—How can you help people discover the many data products in your organization and find the right information for their individual needs?
- Discuss—What capabilities encourage data consumers to take the insights they find in the data and share these insights with others?
- Distill—How do you filter out the irrelevant content and provide feedback to enhance those data products that remain?
Together, these conditions provide the environment that can allow you to create useful, engaging solutions that drive informed actions. The next sections provide details to help you understand what you can do in your organization to create these conditions. Each section describes the conditions, why it is important to building your data product ecosystem, a vision of the ideal capabilities to strive for, and a pragmatic view of actions you can take today to move in the right direction.

Figure 7-2: The six Ds are the necessary conditions for a healthy data product ecosystem.
Finally, a word of warning: In our experience most organizations are in their infancy with respect to data fluency. Organizations often have small pockets of individuals that have a conscious understanding of which data products they need and how to design and create good ones. These skilled data consumers and data producers, however, make up the minority and often find roadblocks to sharing their work and permeating the organizational culture with a level of data fluency. As a result, some strong data products that are powerful communication tools often exist side-by-side with outdated, unused, and misguided reports. The Six Ds of a healthy data ecosystem help create an environment for the minority of savvy data users in your organization to extend their influence and organizational performance in the process.
The conditions expressed here represent an ideal model. Strive toward them and appreciate the value of moving toward a better ecosystem.
Learning from the App Store
Over a holiday weekend, 28-year-old Dong Nguyen made a mobile game. His idea was simple—tap your screen to fly a bird between a series of vertical green pipes. For each set of pipes passed, you get a point. He called the game Flappy Bird.
Flappy Bird launched in May 2013. Later that year, the game went viral. By the end of January 2014, it had been downloaded more than 50 million times, making Dong an estimated $50,000 a day in in-game advertising. Ten days later, the game was gone—pulled by its creator.
“I was just making something fun to share with other people,” Dong said. “Flappy Bird was designed to play in a few minutes when you are relaxed. But it happened to become an addictive product. I think it has become a problem. To solve that problem, it’s best to take down Flappy Bird. It’s gone forever.”2 Days after, smartphones with the game began to be auctioned on eBay. Although the sales were never permitted, some bids ranged in the thousands of dollars—a testament to the addiction that Dong had feared.
But how did Dong launch this app? How did his idea for a simple game go from virtual anonymity to the devices of millions of mobile users across the world in little more than a month? The answer is in the incredible data ecosystem Apple, Google, and others created to distribute apps.
Let’s use Apple’s App Store as an example because it was the first. With the smartphone revolution came a huge increase in demand for mobile applications. For instance, since the launch of the App Store on July 10, 2008, the number of iPhones sold has grown beyond 500 million.3 With this many iPhones, the needs of users have become increasingly clear through top-selling lists of apps and increasingly clear categories on the App Store.
At the same time, Apple has been careful to provide app developers with a system that allows individuals and organizations to effectively design and develop mobile apps for use on the iPhone and for sale in the App Store. Apple has gone so far as to provide a guidebook for designing Apps called the iOS Human Interface Guidelines. This book provides design principles to (strongly) encourage application developers to create user interfaces that fit neatly into the Apple ecosystem. Specific guidance includes:4
- “Don’t take space away from the content people care about.”
- “Use a tone that’s informal and friendly, but not too familiar.”
- “Focus on the needs of 80 percent of your users. When you do this, most people won’t have to supply any settings because the app is already set up to behave the way they expect.”
Most important, Apple created an App Store that allowed users to discover apps, discuss them, and distill feedback in a convenient and meaningful way to improve future iterations of the app.
Flappy Bird is a case study of the power of Apple’s app ecosystem. To develop Flappy Bird for sale in the App Store, Dong first had to download and install Xcode, the application in which all iPhone apps are created. Next, he used a common programming language, Objective-C, to program the functions and overlay his graphics for the game. In Xcode, Dong could also test the game in an iOS simulator, try it on his own iPhone, debug it, and distribute a test version to others. With this process completed, Dong could then purchase a development account through Apple’s App Store for $99 a year. With this license, he’s ready to launch his app. In Xcode, he would use the Application uploader tool and wait for approval from Apple. When approved, the game goes live for download on the App Store.
Although Dong’s story is clearly an outlier—one of maybe a dozen mobile games that have gone viral, and possibly the only game that’s been pulled because of too much use—it illustrates the power of a successful ecosystem. Dong, a 20-something who was living with his parents in Hanoi, Vietnam, entered an environment that allowed him to easily design, develop, and distribute Flappy Bird, one of the most discussed games in mobile application history.
Demand
There is nothing so useless as doing efficiently that which should not be done at all.
—Peter Drucker
We begin with the end in mind. The consumers of data have needs. A healthy ecosystem will support those needs through the right data products. Discovering the information that will best serve the organization is the first step.
Understanding data consumer demand is not a one-time endeavor. It requires a process of continually mapping the important decisions made by the organization and evaluating whether and how data can improve those decisions.
Organizations without an understanding or responsiveness to data needs may suffer from gaps in areas in which data could inform decisions. At the same time, these organizations may be prone to extreme analytical fixation on particular areas at the expense of other areas of greater importance.
There are a couple of ways to build a complete awareness of your organizational data demands: a top-down map or listening for grassroots needs.
Top-Down Demand Map
The best opportunities for useful data products come at the intersection of important and frequent decisions and situations in which better data leads directly to better decisions. Your organization may decide to enter a new market, but if this decision is guided by executive experience and happens infrequently, then there is little a data product can add. In contrast, how a sales team decides to discount for new customers is an area that may happen often and can be informed by an understanding of the long-term value of the new customer.
The following prioritization process helps identify where to start:
- Build a comprehensive list of processes, functions, and decision-points that happen in your organization. You may want to start from the first point you interact with a customer and trace all the interactions directly or indirectly related to the customer. Consider functional areas such as human resources, finance, supply chain, operations, and sales.
- For each element, rate it on a scale of one to five for importance to the success of your organizational goals. One means the element has little to no impact on organizational success; five means it is a core and critical decision.
- For each element, rate it on a scale of one to five for the value better data can bring to decisions. One means data brings little to no value to the decision process; five means data always makes the difference between good and bad decisions.
- Plot all the elements in a chart, as shown in Figure 7-3.

Figure 7-3: An approach for prioritizing data product needs
In this chart, the further an element is from the lower-left corner, the more value a data product will bring.
Grassroots Needs
The alternative to a top-down mapping exercise is to let the demand for data needs surface from the people who want it most. As a leader, how do you hear what the “market” needs? Encourage people to ask difficult questions and create an environment where these questions are embraced.
Warren Berger, author of A More Beautiful Question (Bloomsbury, 2014), suggests that encouraging questioning in your organization can start with the leader but is a grassroots effort:
- “A culture of inquiry starts at the top—with leaders who question.”
- “Questioning should be rewarded (or at least, not punished).”
- “Give people the time and space to question deeply.”
- “Provide the tools to question well.”
The last point is of particular practical use. Approaches like “The Five Whys” provide a proven model for getting people to think more deeply about their circumstances. When they do, they are likely to wonder why decisions are made the way they are made and whether better information would improve those decisions.
Where to Begin
Understanding where you need better visibility within your organization can be complex for a large university, a growing public company, or for a small start-up. The answer starts with a simple question: What goal—if achieved—would cause your organization to celebrate in the next 12 months?
With that answer in mind, you can define what you most need to measure to track progress toward this goal. Perhaps there are a number of factors that must come together for the goal. Data products focused on this goal will give you confidence that you are moving forward on the set of crucial factors—or where you need to make adjustments.
Design
Less than 30 percent of the potential users of organizations’ standard business intelligence (BI) tools use the technology today. This low take-up is due to the fact that longstanding tools and approaches to BI are often too difficult to use, slow to respond or deliver content of limited relevance.
—Gartner5
The three reasons cited by Gartner for this problem are:
- Ease of use (“is hard to work with”)
- Performance (“users are frustrated by delays”)
- Relevance (“does not express content in line with their frame of reference”)
The first and last reasons link directly to issues of poor data product design.
In our role as dashboard and analytical application designers, this is an area that is close to home. We see it all the time: reports and dashboards that lack focus and a message that targets their audience, which is often undefined. We see poor choices in data visualization that distract from the important elements in the data and put the burden of deciphering meaning on the readers. We see data products that lack an obvious starting point and logical flow to conclusions.
Poor design is wasteful. It results in solutions that users don’t want to use, as noted by Gartner. It wastes the audience’s valuable time as it struggles to comprehend the data. And it wastes the development and distribution efforts necessary to deliver the data product.
Overcoming these design shortcomings requires systematic processes and capabilities within your organization. Chapter 5, “Data Authors,” discusses the skills involved with designing effective data products. But how do you incorporate these skills into your processes and create repeatable ways to ensure quality design?
Objective
Better information design in your organization will come from a combination of skilled people and processes that ensure design is a priority.
The Apple App Store has strict guidelines for applications that are made available to customers. Apple publishes design guidelines, enforces a rigorous review process, and provides tools that help app developers get their designs right. As a result, consumers of Apple applications get a consistent, high-quality experience. The design focus allows novice users to quickly learn a new app because they have come to understand common conventions and design practices.
You should consider four areas when building an environment that infuses good design into your data products:
- Train your data authors on the design skills for communicating data. Chapter 5 describes many of the areas of content that are foundational knowledge. The best information designers are discriminating in what data they choose to present and thoughtful about choosing metrics that encourage appropriate behaviors. They have the ability to create a logical flow through a series of attractive and clear data visualizations. There are also practical design skills to teach. For example, we always create wireframes—rough mock-ups of user interfaces—before building the actual data presentations. In this way, we can experiment with layout and content using rapid, lightweight iterations.
- Incorporate designers early in the development process. Many of the organizations we work with go from concept to development of data products without considering the best way to communicate the data. When an executive wants a dashboard with a set of required metrics, the data analyst gets right to work on putting all the content together. The analyst might meet the specific requirements, but not in a form that anyone wants to consume. One client referred to these types of reports and dashboards as “ransom notes” because of the great variation in styles on the page. Designers should be included early in the requirements gathering process—not at the last moment to try to polish graphics.
- Document guidance to ensure consistent designs. Many of the best practices and information design advice shared in Chapter 5 can be gathered into documents for designers. We have had success working with clients to create style guides for information design and communication. In addition, templates for reports, presentations, spreadsheet models, and dashboards can give designers a consistent starting point for their work. We also make sure to capture design patterns and principles as a way to establish models for approaching similar problems.
- Review process to maintain quality control. Your organization should set expectations for the quality of data products that are used to communicate your valuable data and share insights. The costs—confusion, frustration, wasted time, and misleading information—are not worth tolerating poor design. The skilled designers, armed with the documented guidance, may form a review board to evaluate and provide feedback on the design of data products in your organization.
Start with a Style Guide
Good design builds on consistent, fundamentally sound choices and learns from the quality work of others. This is where your organization can start its efforts to improve data presentation design.
In our experience, an effective first step is to create a style guide for the presentation of data. It can be modeled after the branding style guides that many large organizations create to ensure a consistent presentation of content in print and online. Your style guide should provide data product authors with direction on choice of colors, typography, chart selection, and number formatting. The document provides examples of well-designed data visualizations and sets the rules for legends and labeling. In Appendix B, we have included an outline for such a style guide along with examples of the content.
“Imitation is the sincerest form of flattery,” said Charles Caleb Colton. Your data product designers should have a standard style guide and set of illustrative data products they can reference to understand quality norms and the expectations of organizational leaders. To do so, select a few examples of dashboards or reports that set a high bar. Find opportunities to publicly present these data products—setting a standard for clarity and content.
Develop
There are dozens of technology solutions for developing data products. Microsoft offers a variety of options: PowerPoint for data-rich presentations, Excel for models and ad hoc analysis, Power BI for self-service analytics, SQL Server Reporting Services for reporting, SharePoint with dashboards, and undoubtedly many more. The fact that one organization offers numerous tools for communicating data says a lot about the complexity of choosing the right tool for your unique situation.
Ideally, you want to have a small set of data tools that support the variety of types of data products your organization needs. A single solution is unlikely to offer the breadth of capabilities necessary. In our experience, four to five tools for data presentation are usually sufficient for most organizations. The following table describes a set of tool categories and the specific solution we’ve seen work most successfully.
Types of Data Product Development Tools
| Type | Purpose | Our Choice |
| Data presentation | Data storytelling with text and images to provide context to the data visualization | PowerPoint* |
| Scenario tools and analyses | Predictive models or other calculations used to explain how something works | Excel |
| Data visualizations | Interactive data visualizations to explain a data analysis | Tableau |
| Dashboards | Summary of performance in a single interface | DataHero |
| Analytical applications | Interactive data presentation to augment existing software applications | Fruition |
| Do it yourself | Charting libraries to create your own dashboards and data visualizations | D3.js |
*There is a natural cringe-reaction for many people when they think of PowerPoint or Excel as tools for communicating data. While these tools have their flaws (most notably the encouragement of poor chart choices), the critiques should focus more on how individual people have misused the tools rather than the general capabilities of the tools themselves.
There are many forms your data products may take. And for every form, there are many technology options. However, here are some common features that are worth evaluating in almost every case:
- End-user customization—Some presentations may target a single audience. This is the exception to the rule. Most often, a data product goes out into the world alone and is used by many people, each of whom comes from a unique perspective. Whether it is their department, region, or products, all audience members will want to see data that is customized and scoped to their situation. Many interactive applications can support this ability to filter to the relevant data.
- Sharing support—Data should spur conversation. However, some solutions for data products create an isolating environment. The data product should make it easy to share, discuss, and capture insights—whether the discussion happens online, offline, on a desktop, or on mobile devices.
- Quality visualization—It matters how data is visualized. Clean, clear charts can make it easy for readers to quickly understand the data. The default settings for data visualizations should adhere to the fundamentals shared by well-known data visualization authors like Stephen Few and Edward Tufte.
- Fit workflows—Finally, we believe it is important that data products integrate into how people do their jobs. If the consumer of data is constantly on the run, bombarded by information of all types, an effective data product will deliver simple, narrow content to this person. If the consumer wants to drill deeply into the data to understand underlying assumptions, the functionality should exist to allow for this need.
“It’s a Poor Craftsman Who Blames His Tools”
The tools you have today probably are a suitable start for developing data products. Better to start with the investments you’ve already made and the technologies your team is comfortable with. Communicating data is far more about the people creating the data products than the technology tools they use.
Start by refining the skills of the individuals using these tools—even if they are simply Microsoft Office products like PowerPoint and Excel. The design skills and capabilities described earlier in this chapter and in Chapter 5 have little to do with the specific technical solution. Furthermore, many tools—Excel in particular—can be extremely capable with practice and creativity. For example, we built the visualization in Figure 7-4 using Excel, inspired by a hand-crafted visual shown on The New York Times website.
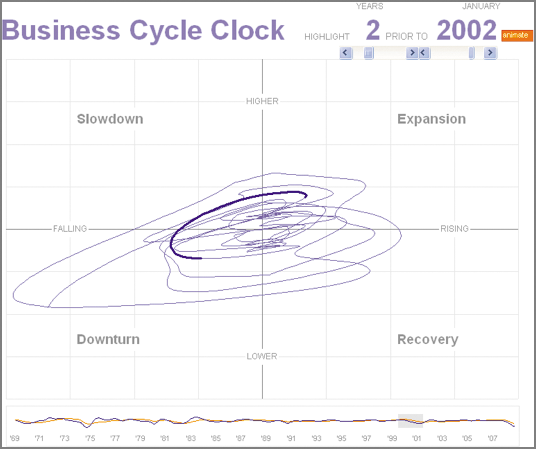
Figure 7-4: The flexibility of Excel
Discover
Knowledge is of two kinds: we know a subject ourselves, or we know where we can find information upon it.
—Samuel Johnson, long before Google
We’ve never seen an organization that is short on data. Nor have we seen one without volumes of reports, analytical tools, data models, and dashboards. It isn’t that the right data doesn’t exist; it is that individual people may not know where to find it or how to access it.
This is the data discovery gap. The gap between supply and demand for data often is the result of, ironically, incomplete information. Just like imperfect information leads to price distortions in the economic marketplace, imperfect information within an organization leads to organizational data inefficiencies. The person who could most benefit from an understanding of customer lifetime value may not know that a well-researched analysis already exists. Better data discovery also has the added benefit of revealing duplicate, competing, or conflicting data products.
Objective
Data product discovery should mirror the capabilities of online content subscription services. Podcasts, blogs, or Twitter, all have established features for ensuring an audience can find and access the latest content. These include:
- Searching of metadata about the content, including title, author, and description
- Browsing of content sorted into categories and ranked by popularity or ratings
- Surfacing of related content based on the consumer’s expressed areas of interest
- Subscribing to allow consumers to sign up to receive updates to content
- Automatedpushing that allows consumers to receive updated content automatically rather than having to remember to return to the source
- Using user permissions to control who has access to applications and content
Organizations are starting to recognize the need to provide a centralized place to find and access applications such as data products. Gartner expects that by 2017, 25 percent of enterprises will have an enterprise app store for managing corporate-sanctioned apps on PCs and mobile devices.
An app store can be a natural way to share new applications within the enterprise, recognize great applications, provide feedback to development teams, and even create a bit of competition between them—all to drive the development of better solutions.”6
—Gartner
Where to Begin: A Centralized Inventory of Data Products
Before building an enterprise app store, there are easy, low-tech ways to deliver discoverability to your audiences. For example, a centralized inventory of all the data products in your organization is a start. The inventory should catalog the product author, update schedule, content area, source data, and directions for subscribing or accessing the data product. A shared drive and common naming conventions will go a long way to making it easier for data consumers to find what they need.
Discuss
In a vacuum, analysis and insight amounts to little. But when those results are discussed and debated, they have the potential to be acted upon. Data must get mixed with people.
The best data ecosystems don’t simply assume discussions will occur. They encourage discussions through mechanisms for sharing, capturing, and saving information and insights. The discoveries found in the data are treated as precious assets—after all, they are the purpose of all the effort put into creating data products. Finally, the ecosystem should encourage people to take action when the discussion is complete.
Some organizations consider data products a one-way information broadcast. They implicitly assume that a dashboard is intended to deliver an information result, not drive an action.
Consider the evolution of television and its audiences as an analogy. Before the pervasiveness of social media, television was a powerful medium for telling a story, but there was little room for engaging the audience beyond the broadcast. “Water cooler” conversations sometimes occurred after a big event with spiked TV rankings—when J.R. was shot or after the last episode of “M.A.S.H.” While there are some examples of early fan engagement via letter writing and call-in voting, generally the focus was always on the one-way delivery of a show to a broad audience.
Now things are different. TV shows have to build stronger connections with smaller audiences. To do so, the broadcast is only the beginning of the conversation. Loyal fans and TV critics write detailed reviews of every episode. Theories and predictions are hashed out on fan discussion boards. The analysis and collective synthesis of the TV show deepens the audience’s understanding and engagement with the content. It took many years for television executives to appreciate and want to foment audience discussion. Now it is a crucial element in a TV show’s success.
Objective
An ecosystem that encourages discussion first needs the capability to capture insights found in data products. No user is an island; they need to take useful information they find and share it, with the context in which they found it. We call this concept snapshots. If an effective data product is a guided safari through the data, then a snapshot is a picture of a trip highlight by the data tourist at a point in time. And like tourists, they will want to save these pictures, send them to relatives at home, and organize them into albums that can help recall the experience.
The technical mechanism for capturing snapshots will vary. It may be something as simple as taking screen shots of a dashboard or saving a graph from a report as a separate file. More important, these snapshots are best when accompanied by a note that describes what makes the information interesting.
Beyond capturing insights, a data fluent organization supports and encourages the discussion that is spurred by data. A monthly report on customer attrition may raise eyebrows when the trend line shifts up, but what happens next? What follow-on discussions occur to dig deeper and start to create a plan for action?
The content of the data products can help encourage their audience to discuss and take action. Often there may be direct and well-understood links between certain data or charts and suggested actions. In the case of increasing customer attrition, the organization may have learned that there are common underlying factors that contribute to this issue (for example, competitors are running promotional campaigns, recent service problems, or outages). This information should be integrated into the data product.
Information and insights are just the beginning of the journey. The DIKW Pyramid (Data-Information-Knowledge-Wisdom) in Figure 7-5 is a framework from the realm of information science. It emphasizes the hierarchy of understanding, the narrowing of volume, and the elevation in value as data is eventually transformed into wisdom.

Figure 7-5: DIKW pyramid
The true objective for facilitating discussion should be to gradually synthesize the information extracted from data products into greater organizational knowledge—shared expertise and intuition—and eventually into wisdom—the ability to apply that knowledge effectively to bring more value to the organization.
Where to Begin: Create a Place to Capture Insights
Discussions on data—like most of data fluency—are more a social and human problem than a technology problem. The technology approaches may be simple. For each data product, create a document or folder for capturing insights. The document may simply be screen shots of the relevant part of the content along with an annotation explaining why it is interesting. As a historical artifact, this document will reveal patterns of common issues and best practice approaches for responding to those issues. More important than a complex technology solution is an organizational culture that encourages dialogue and action after the insights are first found.
Distill
The scourge of data in most organizations is the ever-growing collection of reports that get generated month after month. New reports are created but seldom killed. The mass of data products quickly becomes difficult to navigate and the right information is hard to find. Even for the data that has found a suitable audience, there is seldom a feedback loop. The direction and needs of the organization may change, yet the content does not change to fit evolving demands.
Data products should be living documents. They should improve over time or be removed if they are no longer relevant. It is a matter of survival of the fittest.
Data fluent organizations recognize that too much content—particularly data content—will clog up the channels of communication. The data products must be distilled to the essential information. You want to clean out distractions and emphasize the most useful remaining parts.
To filter and clean your data product ecosystem, you need processes in place to gather feedback from your users. The feedback needs to impact how data products are designed and produced.
Learning from Wikipedia
Possibly the best example of an online living “document” is Wikipedia. Although many people benefit from the front end of Wikipedia, there is a whole ecosystem undergirding the popular website. The data that is viewed by all is created and managed by a network of administrators, bureaucrats, stewards, reviewers, and other specialty groups. The ecosystem governs the content and makes public all edits on any page identifying the author. Each page and piece of data is vetted and improved by the power of collective knowledge. Wikipedia, a nonprofit organization, is fueled by voluntary effort. Yet, few large organizations have figured out how to harness the collective knowledge of their employees or associates.
Objective
The goal for a data fluent organization should be to have multiple mechanisms to provide feedback on data products to ensure they evolve as needs evolve. Those data products that don’t continually change to fit audience needs may slip into obscurity and be discontinued. Following are three basic approaches for distilling your best content:
- Create a lightweight feedback mechanism. This should be a simple process that allows users to rate data products. Did you find this data product valuable? What information was most useful? What decisions did it influence? The results from a few questions would provide the authors with valuable guidance on improving what they deliver.
- Track usage. For online products, you may find it straightforward to find out what content people are engaging with. Which reports are downloaded most often? How many people viewed the operational dashboard every day? Like content on a website, these usage metrics are a direct way to understand what is popular or not.
- Conduct content reviews. From time to time, gather the audience for a data product and have an open discussion about what they find valuable and what features or data they would like to see added. To avoid the inevitable slide toward more scope, it is useful to create an artificial constraint (for example, number of metrics or pages) to force users into hard choices about what they need versus what they want.
What Can You Do Without?
With an objective to bring greater focus to your organization, consider the following simple plan to narrow the volume of data products being produced. First, for each functional area build a list of all the data products currently being used. Second, create a simple survey based on this list. The survey can have a single question: “What three pieces of information would you recommend to a new employee in your role?” Third, determine what data products received no votes. These are the data products that need to prove their value. Would anyone miss them if they were gone? In the final step, stop distributing these data products and see if anyone complains. If the data is being presented but not used, it is a good bet your resources are better focused elsewhere.
“Only Connect”
Because knowledges are so specialized we need also a methodology, a discipline, a process to turn this potential into performance. Otherwise, most of the available knowledge will not become productive; it will remain mere information. To make knowledge productive, we will have to learn to connect.
—Peter Drucker, Pro-Capitalist Society
Drucker is referencing E.M. Forster’s belief in the imperative of human connection. This chapter is about connection and how to create the conditions that facilitate connections. The six Ds are pillars that ensure data gets turned into productive action, connecting people to the information that leads to smarter decisions:
- Demand is the connection of your organization’s needs with the people who will produce data products.
- Design ensures quality outputs that will communicate to the audience.
- Develop is the mechanism to create data products, the connective glue that will deliver useful data to the people who can use it.
- Discover is connecting supply and demand after data products have been created.
- Discuss is the collaboration between people to understand and digest the meaning of the data.
- Distill is the feedback loop that ensures organizational needs are heard after a data product is created.
An ecosystem with these elements in place will allow data to flow freely, ensure quality communication, and improve data products over time.
The conditions for a data fluent ecosystem are far from trivial. In fact, in our decades of experience working with organizations that value data, we have never seen an organization that has put all these elements together. To help on the journey, we have included suggestions for manageable places to start.
This chapter completes our tour of the four quadrants of the framework for data fluent organizations. Next this question is answered: Where are you on your journey to data fluency?