
Chapter 2
The Data Fluency Framework
Motion pictures are among the most popular media for telling stories. They didn’t become so overnight. Over their 100-year history, changes in the industry have led to disruptions and challenges that shape the way you experience movies today. This evolution, though, has brought a rich and distinctive system to deliver content and fluently communicate ideas in ways that engage audiences.
The technologies of moviemaking have changed dramatically over the years. From the initial transition from silent films to “talkies” to innovations in animation and 3-D, filmmakers have continuously learned new skills as technologies create new opportunities for storytelling. At the same time, the film industry has understood that establishing standards creates a healthy ecosystem. Standards—everything from film aspect ratios to cinema sound systems to DVDs—give producers a shared set of tools and expectations to work with. At the same time, MPAA ratings, well-understood movie genres, and industry awards help consumers know what to expect when they buy a film experience.
The people who make films have undergone their own evolution as well. Out of a period when directors were under the control of studio executives emerged auteurs–talented directors whose passion and personal influence are such that they are considered “authors” of the films they produce. The industry also created film schools and apprenticeship systems to educate new generations of talent. Meanwhile, audiences have become more educated and refined in their understanding of the medium. The unique tastes of a niche audience can be efficiently matched to films that meet those interests. The films that touch a nerve with their audience are lauded while weak films are publicly panned.
Together, these foundational elements—innovative technologies, industry standards, creative producers, and educated consumers—have created the modern film industry. George Lucas and the beginning of the Star Wars saga is an illustrative example of innovative technologies, industry standards, creative producers and consumers coming together way back in 1977—resulting in the pop culture blockbuster (Figure 2-1).

Figure 2-1: The Star Wars movies found their audience.
A similar transformation is currently transpiring for the communication of data. As demonstrated in the film industry, a multitude of factors must come together to create an established environment with the necessary language, standards, and tools to facilitate communication between data producers and consumers. Data literacy for an individual is one thing; creating fluency across an organization and an industry is more complex. The community needs to define how data can and should be communicated. Individuals need to learn a new sophistication in engaging with data as a communication medium.
This book offers a path to a data fluent organization—achieved through a web of connected elements. Data fluency requires people who speak the language of data; skilled producers of data products; an organizational culture with the conditions to support data discussions; and the systems, tools, and ecosystem to create and share data products. These foundational elements—and the flow of information between them—represent the necessary conditions for data fluency in your organization. If that sounds complex, it is. It also helps to explain why so many organizations struggle in their pursuit of data fluency.
Nevertheless, it is a worthy journey—even if you make it only part way there. Data is a powerful, underutilized asset in most organizations. Creating organizational fluency with this data can enable productive conversations, smart decisions, and organizational priorities. It can influence the many small decisions that are made by your front-line staff every day. And it can guide big thinking about innovation and strategic direction.
When individuals and teams within an organization achieve data fluency, unproductive discussions about “where did that data come from?” and “what does that value mean?” are exchanged for deeper discussions about key organizational goals and metrics. Data fluency speeds the communication between people, letting them focus on the message and not the medium. Data fluency empowers people to more effectively do their job, informed by a shared data language and organizational understanding of that data—understanding that accelerates organizational growth.
By the end of this chapter you should understand:
- The components of the data fluency framework
- How a set of existing books and resources on data visualization skills and data-driven enterprises offers useful but targeted portions of the overall solution
- Various ways to use the framework to improve your organization
The Data Fluency Framework
The data fluency framework, provided in Figure 2-2, is composed of four foundational elements. The elements are grouped along two dimensions. Along the horizontal dimension is a distinction between the capabilities required at an individual level (top) and at the organizational level (bottom). Along the vertical dimension, you can focus on the audience, or consumers, of data (left) separate from the authors, or producers, of data products (right). Below we clarify these distinctions and introduce how to develop data fluency in each quadrant—topics explained in detail in subsequent chapters of the book.

Figure 2-2: The four quadrants of the data fluency framework
Individuals and the Organization
Your organization has its own ways of doing things and often an intangible set of conventions and expected behaviors. Your staff both shapes and is shaped by these processes and culture. Developing data fluency skills at an individual level and creating an environment in which data fluency flourishes is important. Both are necessary to create a data fluent organization. Individuals trained in communicating with data will grow frustrated in an organization without the tools and expectations that align with their skills. Likewise, the best efforts of leaders to shape a data fluent culture will make little progress without individuals who have the ability to engage with data.
Using Data versus Presenting Data
Supply and demand. Authors and readers. Producers and consumers. Data fluency is the exchange of ideas with data as a medium. Without both sides of an exchange, no message can be conveyed. However, separating people into consumers or producers of data content is a bit simplistic; the same person may play both roles at different times. Sales people may consume reports about organizational performance, product trends, and sales scoreboards. At the same time, they can be well served to communicate to the sales manager about their performance with data analyses rather than anecdotal complaints about poor quality leads. Within the framework, you can learn how to build a cohort of sophisticated data consumers and a culture that facilitates shared understanding. On the producer side, the framework offers guidance on teaching the skills for effective data communication and the systems required to make these producers successful. Now take a deeper look at the pieces of the data fluency puzzle.
Element 1: Data Literate Consumers

If data fluency is the fluid exchange of ideas using data, data literacy is the ability for individuals to understand and draw meaning from data. You should start here because reaching a willing and informed audience is perhaps the most fundamental condition for a data fluent organization. The famous philosophical thought experiment asks, “If a tree falls in a forest and no one is around to hear it, does it make a sound?” That is, does something exist if it is not perceived? Does your data matter without someone to read, understand, and interpret it?
Yet data is a relatively new language for most people. The goal of data literacy, like reading literacy, is to develop control over surface-level comprehension so the reader “can focus on understanding the deeper levels of meaning embedded in the text.”1 It takes time to move from the grasp of individual vocabulary to the instantaneous internalization of meaning. It is a worthwhile journey because this new language of data is useful for interpreting your world. It can be argued that data will become a new lingua franca, that is, a language systematically used to facilitate communication possible between people not sharing a mother tongue.2
In Chapter 4, which focuses on element 1, you can see that it takes more than a solitary listener to give meaning to your data. It takes an educated audience that appreciates the nature of the data presented, knows core data concepts, can find insights in data presentations (both simple tables and advanced charts), and—like the movie critic—sets high expectations.
Element 2: Data Fluent Producers

Not always, but too often, authors of data communications forsake their role. You’ve certainly been witness to the results: raw data tables delivered as “reports”; long PowerPoint presentations with slide after slide of repetitive charts; and dashboards densely packed with colorful figures. What the authors are actually saying with these data products is:
- I don’t know what is important in the data.
- I don’t respect the time and attention of my audience.
- I don’t know how to visually communicate data.
- I don’t know that I need to communicate meaning.
A common problem is awareness of one’s role. Data producers are first and foremost teachers tasked with communicating information and actionable insights from the data. In this regard, it may be helpful to consider the Montessori educational system. In contrast to more traditional forms of teaching, Montessori teachers consider themselves guides for their students. Rather than dispensing information to students in a teacher-deliverer model, Montessori teachers create a fertile environment in which students can engage in their own learning, have the necessary tools needed for learning, and have the freedom to find what is of interest to them. Similarly, data authors need to consider the needs and actions of their audience and deliver content in ways that are easy to absorb.
Every member of your audience comes to the data with different priorities, needs, and perspectives. Successful communication of data builds on this variety as an asset—everyone in the discussion can add to the overall understanding of the group and also find their own insights.
Chapter 5 focuses on best practices for creating effective data products that tell stories while engaging and guiding audiences. You need to find your message and be discriminating in the content that you put on the page. Just as no book or movie can convey everything about a topic, don’t try to say everything that can be said in your next report.
Chapter 5 also explains the nuts and bolts of presenting data, including choosing the right metric and the right chart to sharpen your message. And when your data product starts to become complex, it becomes important to consider how the information fits together. The structure and flow of data visualized together makes a huge difference in making the message and meaning accessible to your audience. Likewise, how the data product is delivered and how it looks matter, too. This chapter will be valuable for members in your organization that develop data products, while offering important insights for those who lead and manage data producers. You may not be an actual data product designer, but you can find guidelines and tips that can enable you to play the part on TV.
Element 3: The Data Fluent Culture

If individual skills are a requirement for the exchange of ideas through data, the culture of the organization is the nutrient-rich soil that helps these individual skills grow. A data fluent culture is built upon organizational leadership, shared understanding and conventions, and everyday habits and processes that make data communication a priority.
People in any organization will look to their leaders to set expectations and model behaviors. First and foremost, data fluent leaders should communicate using data to support their arguments and priorities. By doing so, they set the standard for quality data products and demonstrate their data literacy in public forums.
The language of data has its own dialect from organization to organization. This dialect reflects the organization’s industry, history, and circumstances, and results in unique meanings associated with its data. For example, a concept such as customer satisfaction can have wide-ranging meaning. The definition will tie to the organization’s approach in collecting the data, expectations of what satisfied means, required time period for data gathering, and sample size. The goal of a data fluent culture, in part, is to ensure that everyone knows what is meant by a term like customer satisfaction. A data fluency culture breaks down when people spend more time debating terminology, calculations, and validity of data sources rather than discussing what action to take based on the results.
A culture is also defined by acceptable and unacceptable behaviors. A data fluent culture brings well-understood key metrics into meetings; knows exactly how to measure the performance of a new project or product; and includes data fluency skills in the hiring and employee evaluation processes. This same culture does not accept willful data ignorance and rejects impassioned anecdotal evidence as the sole input into decisions. Chapter 6 outlines key strategies for developing a data fluent culture.
Element 4: The Data Product Ecosystem
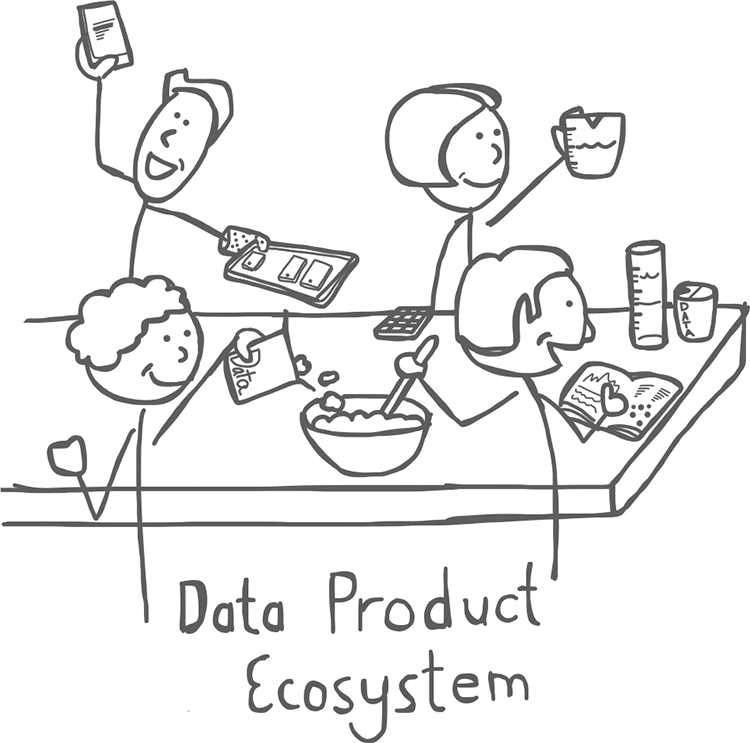
The previous three elements in the framework focus on people and behaviors. To enable the flow of information and the creation and sharing of data products, there must be processes, tools, and standards in place. Consider the ecosystem that Apple has created for iPhone and iPad applications. Apple created a system in which high-quality applications can be designed, developed, tested, marketed, and sold. There are mechanisms for user feedback, processes for checking application quality and conformity to Apple’s standards, and a well-understood way for consumers to find the apps that suit their needs.
On a much smaller scale, successful data fluent organizations create an ecosystem that enables the creation and sharing of data products. The objectives are similar to Apple’s app store: Ensure quality data products; allow distribution of the right data to the right decisions makers at the right time; and encourage curation of data products so the most valuable ones are discovered and used.
The ecosystem requires three fundamental conditions: standards, tools, and processes. Standards are the design patterns and style guidelines that make it easier for data producers to effectively communicate with data. The best tools make it efficient to design and build data products and ensure they are discoverable for the target audience. Processes encourage sharing of insights, collaboration between producers and audiences, data hygiene, and quality control. A healthy ecosystem can help facilitate data fluency throughout the organization. Chapter 7 reviews these fundamental conditions and provides specific guidance for organizational leaders to create a data fluent ecosystem.
Connective Tissue
The elements of the framework are linked together by guidelines, tools, standards, and training. For example, the data fluent organization needs to define and create training resources to help individuals learn basic data comprehension skills. Likewise, the design standards defined in the ecosystem should result in a style guide that data product producers use to standardize their output.
Resources for More Depth
The objective for this book is to explain all the elements that must come together to create data fluency for your organization. As a result, this book provides a comprehensive solution for each of the elements in the framework. Fortunately, most of the resources about data communication, data visualization, and data-driven enterprises take a narrower and deeper view. The following books and websites can fill out your knowledge of the elements in the framework.
- Data Literate Consumers
- Michael Milton, Head First Data Analysis (O’Reilly Media, 2009)
- Alistair Croll, Benjamin Yoskovitz, Lean Analytics (O’Reilly Media, 2013)
- Data Product Authors
- Nathan Yau, Visualize This (Wiley, 2011)
- Stephen Few, Information Dashboard Design (Analytics Press, 2013)
- Alberto Cairo, The Functional Art (New Riders, 2012)
- Nancy Duarte, Resonate (Wiley, 2010)
- Edward Tufte, Visual Display of Quantitative Information (Graphics Press, 2001)
- David McCandless, Information is Beautiful (Collins, 2012)
- Data Fluent Culture
- Thomas H. Davenport, Jeanne G. Harris, Robert Morison, Analytics at Work (Harvard Business Review Press, 2010)
- Avinash Kaushik, Occam’s Razor blog, http://www.kaushik.net/avinash/
- Thomas Redman, Data Driven (Harvard Business Review Press, 2008)
- Peter Drucker, The Essential Drucker (HarperBusiness, 2008)
- Data Ecosystem
- Cindi Howson, Successful Business Intelligence (McGraw-Hill, 2013)
- Larissa Moss, Extreme Scoping (Technics Publications, 2013)
Benefits of the Data Fluent Organization
When all the elements shown in the framework exist and work together, an organization can use data as a common language. Data fluency can have a number of benefits for your organization including:
- Better decision-making—A primary objective is to create a more systematic, objective approach to making smarter decisions and taking informed actions in your organization. A clear understanding of data and ability to transform it into meaningful analysis will move your organization away from historical biases, decision-by-anecdote, and pure gut-instinct.
- Efficient, accurate communication—Miscommunication and misunderstanding about the meaning of data is one of the hidden barriers to progress in many organizations. When everyone is on the same page as to the meaning of the data, the discussions are about the content and ideas, not deciphering the language.
- Alignment and accountability—Clear communication about key metrics gives everyone in an organization an understanding of priorities and how their actions influence those priorities. Furthermore, when things are measured in well-understood ways, it is much easier to hold people accountable to those measures. As management guru Peter Drucker said, “What’s measured improves.”
- Learning culture—Discussions around data frequently raise more questions than they answer. In an organization in which data communication works effectively, new, better questions are raised. These questions lead to deeper knowledge, more insights, and hopefully greater productivity.
How to Use This Framework
This book is for the executive and the business analyst, for the most data-savvy head of operations and the most data-phobic marketer. Creating an organization that can converse using a common data language is the responsibility of front-line staff as well as the organizational leaders. The introduction explained which chapters are the best places to start given your role. Now with the framework details in mind, you can understand some of the immediate benefits that can be achieved through specific chapters in this book.
- Evaluate strengths and weaknesses—“Data Fluency Inventory” defines a data fluency inventory for determining where your organization is in its journey to data fluency. This survey instrument points out the areas where you have room for improvement and points you to the parts of the book where there is specific guidance.
- Define an organizational plan—The chapters focused on organizational capabilities (the bottom row of the framework) give leaders a roadmap for getting in place the pieces necessary to support your staff. Chapter 6 is for the CEO or department head who wants to define a better data-driven culture through expectations, guidelines, and behaviors. Chapter 7 speaks more directly to the technology leaders in your organization.
- Define training and skills needed—Understand the distinction between the skills required for data consumers (Chapter 4) and those required for data producers (Chapter 5). Both these chapters provide an outline of many of the important skills necessary to create and comprehend data products.
- Data product inventory—Throughout this book you read about data products—the reports, presentations, dashboards, and data analyses—that are the medium for communicating data within your organization. A good starting point is to build an inventory of the collection of data products currently in use, their purpose, and the audience they are intended for. Chapter 5 (Data author) can help you understand how these products succeed or fail in their purpose, whereas Chapter 7 (ecosystem) gives you insight into how to manage and share your collection of data products.
- Set a technology roadmap—The framework isolates much of technology discussion within the concept of building a data product ecosystem. In Chapter 7, you can gain an understanding of some of the core technology requirements as they relate to providing data access, capabilities to visualize and present data, and having a place where data products can be discovered.
How Organizations Struggle
The aspirational framework describes the ideal conditions for a data fluent organization. In working with dozens of organizations in many different industries, the common denominator has been the struggle to establish these conditions. The next chapter describes real-world situations in which weaknesses in one or more elements of the framework undermine the most committed efforts to use data to create a high performance organization. This “learning from the struggles of others” provides an important springboard for growth and development—to which the remainder of the book is dedicated.
Summary
Creating data fluency within your organization is a complex task. It requires individuals who speak the language of data, skilled producers of data products, an organizational culture with the conditions to support data discussions, and the systems, tools, and ecosystem to create and share data products. In this chapter, we outlined the core components of the data fluency framework, our roadmap for improving organizational data fluency. These core components include data literate consumers, skilled data producers, the data fluent culture and the data product ecosystem.