
Chapter 8
The Journey to Data Fluency
Data is music to his ears. Stephen Brady was just out of college and had landed his dream job. He was working for a country music label in his hometown Nashville, Tennessee. Stephen wasn’t an aspiring musician or music producer; his talents were in data analysis.
A few months after joining Black River Entertainment, Stephen could hardly believe the possibilities before him. He had access to broad and deep data about radio promotion and plays. The potential seemed enormous: He could see how different songs performed as they moved up or down the charts. He could track the viral nature of songs as they spread across geographic areas. And yet, it seemed as if nobody—within the industry, much less his organization—was making use of these data assets.
Stephen set to work building probabilistic models to forecast radio airplay trends. He looked for predictive variables that could help improve the efficiency of radio promotion. His analyses could help the music label promote its artists more effectively by understanding when and where to release singles. He set up a meeting to share his insights with the music label’s CEO Gordon Kerr and the promotional team.
Eighty slides later and after seeing visualizations like the one in Figure 8-1, the promotional team shared a collective look of awe and confusion. What was it supposed to do with his new probabilistic model? What did he mean when he shared a graphic showing "the cosine similarity between radio programming trends using a clustering algorithm to find clusters of stations that exhibit similar programming trends”?
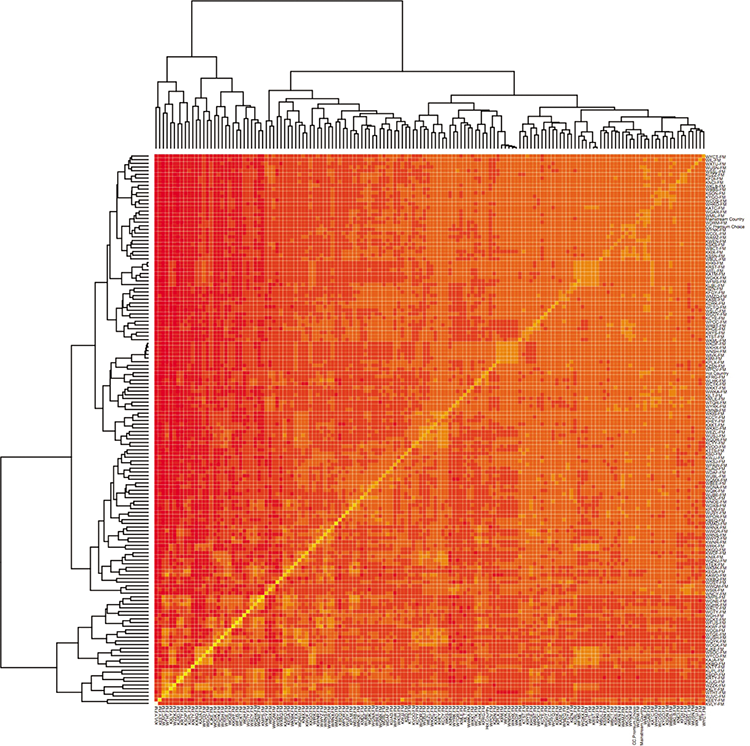
Figure 8-1: Radio station visualization
Fortunately for Stephen, Gordon saw the potential in his work. And from a CEO’s vantage point, the analyses could provide a unique differentiation for the music label. He could talk to artists about Black River’s capability to give them the best chance to have a hit single through targeted promotions.
Stephen’s hard work had begun the journey toward smarter, more confident decision-making. He’d shown that there was value in the data—it just needed to be unlocked. But despite these efforts, Stephen and Gordon still had to learn to communicate the data in ways that everyone in the organization could understand and act on.
Why Data Fluency?
It is the experience of Stephen, and all the other analysts toiling with data, that have animated our efforts over the years. We’ve seen the energy that gets poured into making sense of data—and all the waste as it gets obscured in reports, detailed analyses, and slide presentations that fall flat with their audiences. If the data were communicated differently, these analysts might move people to action, change minds, and shine light on important choices. If the value in data is to be unlocked, it takes better communication skills and an engaged audience.
In 2007, Professor Thomas Davenport wrote an influential book called Competing on Analytics: The New Science of Winning.1 He stoked a smoldering ember into a flame by examining the power of analytics to improve organizations. The book catalyzed a generation of business leaders to look to find the value in their data.
Of course, we had quibbles when the book came out. In particular, Davenport advocates a centralized model for analytics, where the data is managed at an enterprise-level by a cadre of data scientists building complex models to drive decisions throughout the organization. He believed that the best organizational structure is a . . .
central analytics and data science organization, based in a Strategy function, with analysts assigned to and rotated among business units and functions: This is, I think, the optimal structure and home for analytics and data science. The central function allows for a critical mass of quants and for central coordination of their skill and career development. It should be a shared service, where anyone with the money and the high-priority requirements can get the help they need. The assignment and rotation allows for close relationships between analysts and decision-makers.2
We believe in another approach, one that emphasizes front-line decision-making in your organization. For us, management guru Peter Drucker sums it up best:
Most discussions of decision making assume that only senior executives make decisions or that only senior executives' decisions matter. This is a dangerous mistake. Decisions are made at every level of the organization, beginning with individual professional contributors and frontline supervisors. These apparently low-level decisions are extremely important in a knowledge-based organization.3
Senior leaders in your organization may make the so-called “big strategic” decisions, in effect choosing the path to travel down. But the speed with which you travel toward your goal and stay on course when distractions arise—these decisions are controlled by your front-line staff. We want to empower nurses, teachers, administrators, marketers, and salespeople (as well as data analysts) with the language of data.
This belief that data can inform better decisions throughout an organization is part of our motivation. There are other foundational beliefs that have fueled this book.

Figure 8-2: People over technology
Data needs to be formed into targeted, purposeful solutions to be of use to most people. The common practice of delivering a general purpose analytical tool to end users and expecting something useful to happen with it, typically results in little added value. People are busy with their jobs. The last thing most information workers have time for is to learn how to use a new analysis tool, figure out what data might be relevant to them, and dive deep into a data analysis exercise. There is no scale or leverage to such an approach. Before adding this burden on people, the data product authors (Chapter 5, “Data Authors: Skilled Designers of Data Presentations”) should take time and thoughtfully find the right data, the right chart, and the right message to provide the end users with a helpful solution. It is the difference between throwing someone an anchor and throwing them a lifeline.
We have also made clear our belief in people over technology (Figure 8-2). There are many suitable technologies for capturing, managing, manipulating, and presenting data. Better technology or tools is seldom the problem. Actually, many of the data challenges that required large information technology investments a decade ago can be done quickly and economically today. The challenges are in the skills and collaboration of the people that use those technologies. Poor communication, misalignment of values, limited data communication skills, unfocused messages . . . these are the challenges that most organizations we work with face today. The good news is that these are all solvable by focusing on the skills of your people.
This book is about creating organizations that value and use data, and the individuals that can make this happen. The book started with a focus on individual skills by explaining the specific knowledge that can make people effective at working with data. We drew a distinction between authors of data products and consumers of data products. (Although, many readers may find themselves in both camps.) From this granular view, you looked at how organizations can encourage data fluency. An environment was described in which the data fluent individuals can flourish and high-quality data products reach their intended audiences.
The Data Fluency Framework comes in four parts, subdivided by the producer-consumer and individual-organization dichotomies. Each quadrant can be understood as a necessary and interdependent building block to a fully data fluent organization.
Data Consumers: Creating a Sophisticated Audience
Soon the digital divide will not be between the haves and the have-nots. It will be between the know-hows and the non-know-hows.
—Howard Rheingold
The same could be said of data fluency. Rather than the haves and have-nots, there are those who engage with data and those who choose to avoid it. It is a path chosen based on comfort level, education, and experience. As data becomes more common as part of everyday communication—in the media, in entertainment, and in the workplace—this data-divide becomes a more substantial problem.
Chapter 4, “A Consumer’s Guide to Understanding Data,” described the skills and mindset required to become a sophisticated data consumer. It covered the basic elements of data analysis and data visualization that help someone move beyond basic interpretation to a deeper appreciation of the message in the data. Educated data consumers are the foundation of a data fluent organization because they will appreciate, understand, and use the data products that are delivered to them. Without this, all the efforts to share data have little impact. A good data consumer conscientiously listens to and understands the language of data.
Data Product Producers: The Skills to Enable Effective Data Communication
Overload, clutter, and confusion are not attributes of information, they are failures of design. So if something is cluttered, fix your design, don’t throw out information. If something is confusing, don’t blame your victim—the audience—instead, fix the design.
—Edward Tufte
Chapter 5, “Data Authors: Skilled Designers of Data Presentations,” focused on what it takes to become an effective communicator of data. Knowing how to visualize data is at the core of this skill set. Good data product authors know how to choose the right chart and let the data shine. They also are concerned with the overall message and how different pieces of information build to support that message. They understand their audience and try to deliver data in a form that fits into their audience’s needs and workflow.
The authors of data products play a critical role in connecting vision to action. The many design decisions that they make—in choosing what metrics to show, what matters in a data analysis, and how to communicate it—can create alignment and purposeful action in an organization. Or, if done poorly, the results can lead to confusion and disengagement from important, useful data. A good data product author can effectively communicate in the language of data.
Data Fluent Culture: Building a Shared Understanding of Data
People were also driven by the clear definition of the goals and an overarching purpose; they could see how their collaboration would benefit a cause larger than that of any individual. Collaboration is effective only if goals are evident: What problem are we trying to solve together? What can we do to solve this collectively?4
—Harvard Business Review
Organizations are social entities that come together to achieve shared goals—whether to solve a problem, make money, or deliver a service to a target population. In the everyday hustle and bustle, these common goals can become lost. Data can serve to illuminate the best course of progress amidst everyday activity just like a lighthouse’s light guides a ship in a fog. By building a shared understanding of the important metrics that tie to organizational success, data can help align interests and actions.
Chapter 6, “The Data Fluent Culture,” discussed what it takes to build a culture that values and uses data in decision-making. It starts with leadership; people at the top must set the tone by incorporating data products into how they communicate priorities. For example, a shared executive dashboard provides a concrete view into what organizational leaders believe is most important.
The importance of building a common understanding of the meaning of your data was emphasized. Too often, wasted energy occurs because people debate and discuss what a data point means, where it came from, and whether it can be trusted. A data fluent culture strives to settle these issues so that people can move on to the business of understanding the message in the data.
Data Product Ecosystem: Tools and Processes to Facilitate the Fluid Exchange of Information
The iOS and Mac App Stores alone, with more than $10 billion in sales last year, would themselves slot in at number 270 [in the Fortune 500 list] ahead of credit firm Discover and casino giants MGM and Caesar’s.5
—appleinsider
From July 2008, when it offered 500 apps, to 6 years later, when it offered more than 1.2 million apps, the Apple App Store has become a model for creating a fertile business ecosystem. Other companies have created similar ecosystems, most notably the Amazon Appstore and Google Play. The application stores—with their overabundance of options—are merely the visible manifestations of connected technologies and business systems. These systems are carefully constructed to deliver specific solutions to targeted consumer markets. Apple's App Store found success by providing developers with development tools and design guidelines; offering ready and plentiful demand from millions of iDevice wielding consumers; a process for approval and feedback to ensure quality; and a payment system that make purchasing easy.
Chapter 7, “The Data App Ecosystem,” is not about building your own App Store. It is about learning from the App Store to understand the conditions that make for a fertile environment for delivering the right solution to the right audience. Specifically, how do you ensure the data products—your vehicles for communicating insights—are designed for and discovered by the many unique audiences in your organization?
Like growing a garden, your job doesn’t end with planting the seeds. The ineffective data products must be weeded out, and the useful ones should be pruned so that they can continue to bear fruit.
Begin the Journey
Data fluency is the ability to use the language of data to fluidly exchange and explore ideas within your organization. There are many trends that are driving the need for data fluency:
- A desire to make use of the investments that have already been made in data gathering and infrastructure;
- Use of data in journalism and marketing to tell convincing stories, setting new expectations for communicating ideas with data;
- A decentralized workforce of knowledge workers with the tools and expectations to make independent decisions;
- New enterprise tools focused on helping employees, customers, and suppliers share and collaborate.
As you consider the path toward data fluency—whether for yourself or your organization—we want to emphasize once again that it is both challenging and worthwhile.
We have worked with dozens of organizations; every one has been deeply motivated to make use of their data. We often find pockets of skilled employees who were data fluent both as consumers and authors. Yet these people are usually frustrated by colleagues who were unable or unwilling to engage with the data. We have seen organizational cultures that have a clear and shared understanding of the metrics that matter. Yet it is more familiar for us to see organizations that are burying themselves in dozens or hundreds of “key metrics.” Most rare of all are organizations that have a stable process for creating quality data products, disseminating them to the right audiences, and improving their content and messages over time.
The journey to data fluency is a difficult path but the potential value is vast. Imagine if you could understand your customer’s behaviors, and deliver this insight into the eager hands of salespeople and customer service representatives. Imagine if everyone in your organization knew which metrics they should focus on, and where to find reports that explain opportunities to improve these metrics. Imagine if your meetings revolved around pointed analyses that attendees could understand and next steps were clearly defined. Imagine if follow-up was tracked. Imagine if everyday decisions were informed by just the right data, and everyday discussions balanced experience with analytical insight.
We hope that by reading this book you can begin to recognize the skills and organizational capabilities you already have—and find the gaps you need to fill. This book offers the landmarks that will help you track your progress and a guide for your journey to data fluency.