

156 High-Function Business Intelligence in e-business
4.2.2 Provide total quarterly and cumulative sales revenues by year
This is again a typical report reviewing sales results for planning purposes. Our
query reported on years 1993 to 1995.
Data
The main source of input for this query is transaction data with the key attributes
of transaction date and transaction amount. Our data resides in two tables.
? TRANS contains dated transactions of all transaction records within a store.
Each transaction contains a set of transaction items.
? TRANSITEM contains the associations with products and product groups.
BI functions showcased
OVER, PARTITION BY, ORDER BY
Steps
We executed the SQL shown in Example 4-6 via the DB2 Control Center:
Example 4-6
Sales revenue per quarter & cumulative sales over multiple years
SELECT YEAR(pdate) as year,
QUARTER(pdate) as quarter,
SUM(ti.amount) as quarter_sales,
SUM(SUM(ti.amount)) OVER (PARTITION BY YEAR(pdate) ORDER BY
QUARTER(pdate)) as cume_sales_year,
SUM(SUM(ti.amount)) OVER (ORDER BY YEAR(pdate), QUARTER(pdate)) as
cume_sales
FROM trans t, transitem ti
WHERE t.transid=ti.transid and year(pdate) BETWEEN 1993 AND 1995
GROUP BY YEAR(pdate),QUARTER(pdate)
Figure 4-2 shows the results of this query.
Note: Some rows of the result table were removed to fit on the page. The
result shows ROLLUP of two groupings (region, city) returning three totals as
follows:
? Total for region, city
? Total for region
? Grand total

Chapter 4. Statistics, analytic, OLAP functions in business scenarios 157
Figure 4-2 Cumulative sales by quarter, annually and reporting period
We visualized this result as a bar chart, as follows:
1. Using the DB2 command center, we saved our data into a text file.
2. We created the MS-Excel file from it, and then imported it into the Brio tool for
creating charts.
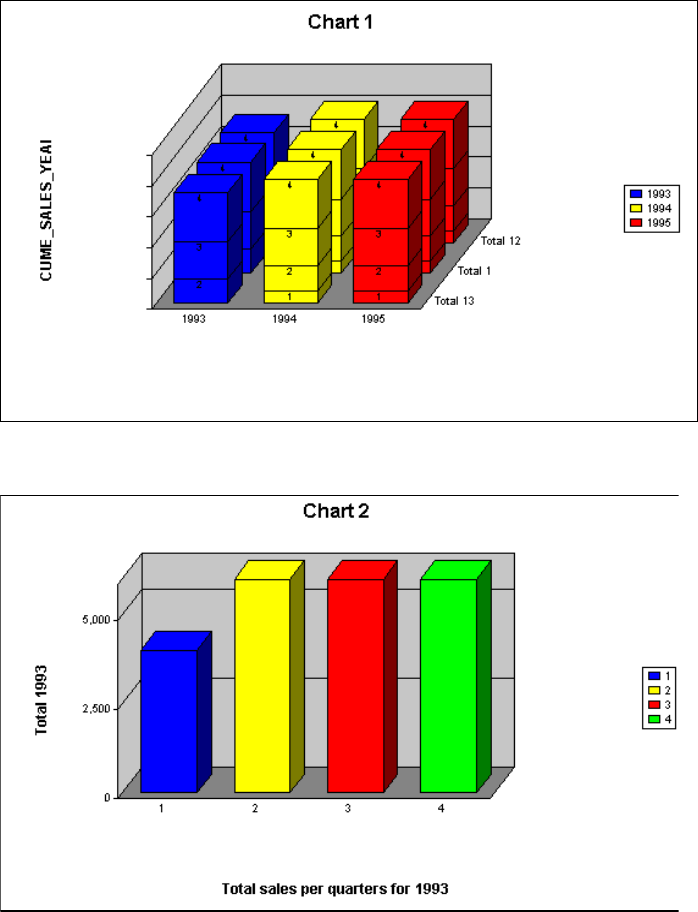
3. With drag-and-drop of CUME_SALES values for years 1993, 1994, and 1995,
from Figure 4-2, we created the charts shown in Figure 4-3 and Figure 4-4.
158 High-Function Business Intelligence in e-business
Figure 4-3 Cumulative sales by quarter and annually
Figure 4-4 Cumulative sales by quarter for 1993
..................Content has been hidden....................
You can't read the all page of ebook, please click here login for view all page.