

138 High-Function Business Intelligence in e-business
3.3.4 GROUPING, GROUP BY, ROLLUP and CUBE examples
We provide examples using GROUPING, GROUP BY, ROLLUP and CUBE.
GROUPING, GROUP BY and CUBE example
Grouping is used in conjunction with the super-group functions, GROUP BY
CUBE or ROLLUP. The purpose of the GROUPING function is to identify
summary rows in the CUBE and ROLLUP query results. The GROUPING
function returns a one or a zero to indicate whether or not a row returned by the
GROUP BY function is a sub-total row generated by the GROUP BY function.
A one means the row was the result of a sub-total, and a zero means the row was
not the result of a sub-total.
The input to the GROUPING function can be any type, but must be an item of the
associated GROUP BY clause. Consider Example 3-22.
Example 3-22 GROUPING, GROUP BY & CUBE example
SELECT SALES_DATE,
SALES_PERSON,
SUM(SALES) AS UNITS_SOLD,
GROUPING(SALES_DATE) AS DATE_GROUP,
GROUPING(SALES_PERSON) AS SALES_GROUP
FROM SALES
GROUP BY CUBE (SALES_DATE, SALES_PERSON)
ORDER BY SALES_DATE, SALES_PERSON
Chapter 3. DB2 UDB’s statistics, analytic, and OLAP functions 139
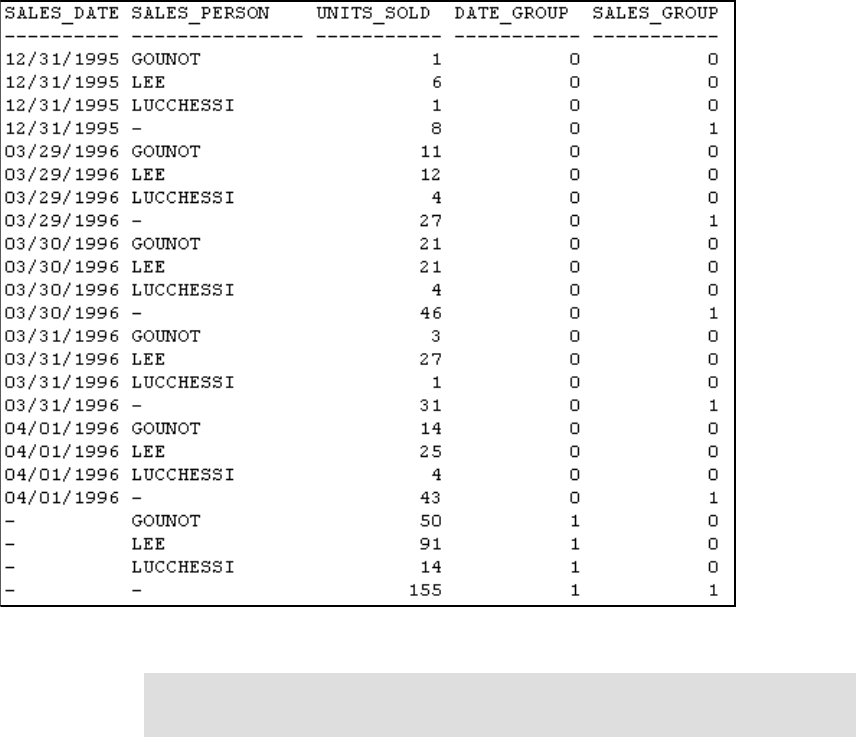
The result of this query is shown in Figure 3-17.
Figure 3-17 Grouping result
The ‘1’s in the DATE_GROUP column indicate the value in the UNIT_SOLD
column are sub-total rows generated by the GROUP BY CUBE clause. Likewise
the ones in SALES_GROUP column indicate these rows are also sub-total rows.
The last row were DATE_GROUP and SALES_GROUP are both one indicates
this row is a grand total row.
This function is used for end user applications built to recognize SALES_DATE
sub-total row by the fact that the value of DATE_GROUP is 0, and the value of
SALES_GROUP is 1.
Note: Figure 3-17 is output from the DB2 Command Line Processor. Here
nulls are represented as “-”.
140 High-Function Business Intelligence in e-business
A SALES_PERSON sub-total row can be recognized by the fact that the value of
DATE_GROUP is 1 and the value of SALES_GROUP is 0. A grand total row can
be recognized by the value 1 for both DATE_GROUP and SALES_GROUP.
ROLLUP example
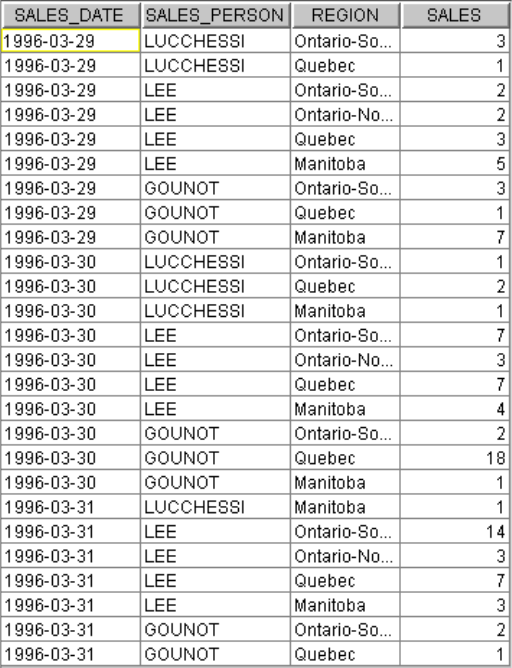
In our sales data example in Figure 3-18 and Figure 3-19, we want to summarize
the sales data by sales person and date with a rollup of sales to a day and week
level for weeks 13 and 14 in 1996.
Figure 3-18 Sales item detail for March

Chapter 3. DB2 UDB’s statistics, analytic, and OLAP functions 141
Figure 3-19 Sales item detail for April
Our SQL looks as shown in Example 3-23.
Example 3-23 ROLLUP example
SELECT WEEK(SALES_DATE) AS WEEK,
DAYOFWEEK(SALES_DATE) AS DAY_WEEK,
SALES_PERSON, SUM(SALES) AS UNITS_SOLD
FROM SALES
WHERE WEEK(SALES_DATE) IN (13,14) AND
YEAR(SALES_DATE) = 1996
GROUP BY ROLLUP ( WEEK(SALES_DATE), DAYOFWEEK(SALES_DATE), SALES_PERSON )
ORDER BY WEEK, DAY_WEEK, SALES_PERSON
The results are presented in Figure 3-20.

142 High-Function Business Intelligence in e-business
.
Figure 3-20 Results of the ROLLUP query
The key to translating the format of the query results is to recognize the output
format is controlled by the ORDER BY statement. In the preceding example, the
output is sequenced first on week, then days within that week and finally by sales
person for that day. Secondly, a summary or rollup row is inserted based on the
order of the rollup statement. It is processed in reverse order. First the rollup for
each sales person is given for the first day. Then, for that day, a rollup is given.
Note: The last row in Figure 3-20 has no entry in the first two columns. These
blanks are technically speaking nulls. The DB2 Command Center translates
nulls to blanks in this case. Other tools may display nulls differently. This same
behavior is seen in the DB2 Command Center output for CUBE.
..................Content has been hidden....................
You can't read the all page of ebook, please click here login for view all page.