

Chapter 4. Statistics, analytic, OLAP functions in business scenarios 195
This data was copied into Lotus 1-2-3 to produce the bar/line chart shown in
Figure 4-37. It shows the average monthly price as line graph and the
percentage change as histogram to emphasize the difference between the two
types of figures.
Figure 4-37 Monthly stock prices
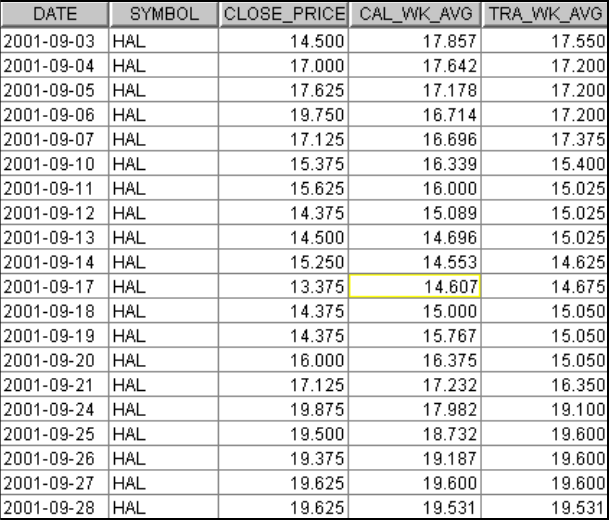
4.3.7 Plot the average weekly stock price in September
This time we plot the average weekly price in the month of September, using
“running mean” smoothing to reveal underlying trends in the data. The smoothed
trend line is sometimes called non-parametric regression because it does not
have a parametric representation (e.g., y=ax).
In this example we will use the stock price data for a 3-month period and
calculate the moving 7-point average and a calendar week average.
Data
The main attributes are stock symbol, date, and closing stock price on that date.
BI functions showcased
AVG, OVER, ORDER BY, ROWS BETWEEN, RANGE BETWEEN

196 High-Function Business Intelligence in e-business
Steps
The necessary steps are shown in Example 4-32.
Example 4-32 Average weekly stock price in September
SELECT date,symbol,close_price,
DEC(AVG(close_price) OVER (ORDER BY date ROWS BETWEEN 3 PRECEDING and 3
FOLLOWING),7,3) AS cal_wk_avg,
DEC(AVG(close_price) OVER (ORDER BY date RANGE BETWEEN 00000003.
PRECEDING AND 00000003. FOLLOWING)7,3) AS tra_wk_avg
FROM stocktab
The first calculation is a straight average of 7 prices - that day’s closing price, the
3 preceding recorded prices, and 3 following recorded prices. However, this does
not take into account days on which the markets are closed such as holidays and
weekends for which there are no prices recorded. ROW based windows are okay
when the data is dense; however, when there are missing rows or duplicates, the
results can be misleading.
The second calculation uses the range offset to overcome the ROW based
window problem. RANGE enables you to specify the aggregation group based in
terms of values (date in our case) rather than on absolute row position.
Therefore, the running average will only be over the 5 working days, since
RANGE over date will limit the aggregation to a maximum of 3 calendar days on
either side of the current row’s date, and therefore account for the missing
weekend prices.
Note: The result of a DATE arithmetic operation is a DEC(8,0) value. We
therefore need to specify the comparison value in the RANGE operator with a
precision of DEC(8,0), in order to obtain the correct result.
..................Content has been hidden....................
You can't read the all page of ebook, please click here login for view all page.