
Chapter 33 BusinessObjects Enterprise—Customizing the Crystal Reports Viewers
Viewing Reports over the Web 840
Introduction to the Crystal Report Viewers 840
Understanding the Report Source 841
Implementing the Page Viewer 843
Implementing the Part Viewer 845
Implementing the Interactive Viewer 846
Implementing the Grid Viewer 848
Using the Export Control to Deliver Reports in Other Formats 850
Viewing Reports over the Web
This chapter introduces programmatic access to viewing reports over the Web through the BusinessObjects Enterprise SDKs. It is important to note that these viewers and the means to programmatically access them have been made consistent across Crystal Reports Server and BusinessObjects Enterprise Professional and Premium editions. This consistency across products enables a seamless and rapid migration through the different versions of these products as developer’s application requirements grow. These SDKs are provided in Java and .NET flavors and provide rich functionality that can be integrated into both intranet and extranet targeted applications.
This chapter introduces the different Crystal Report viewer components and explains how to set them up for inclusion in your custom applications. The following topics are covered:
- Introduction to the Crystal Report viewers
- Understanding the report source
- Implementing the Page viewer and toolbar buttons
- Implementing the Part viewer
- Implementing the Interactive viewer and toolbar buttons
- Implementing the Grid viewer and toolbar buttons
- Using the Export Control
Introduction to the Crystal Report Viewers
The Crystal Report viewers that ship with the Report Application Server break into four different categories to suit the need of a variety of applications: the DHTML Report Page viewer, Report Parts viewer, DHTML Interactive viewer, and DHTML Grid viewer. Although all four viewers offer unique capabilities, they share a common API and set of basic features. Each viewer allows the developer to indicate which report to display, supply database logon credentials, apply report parameters, and export the report. All four viewers are exposed as server-side controls and as a result, output dynamic HTML that is rendered in any web browser. No special software is required on the client’s machines to view reports using any of the viewers.
Listed below is a short description about each report viewer:
- DHTML Report Page viewer—The standard report viewer component. It displays reports in a paginated fashion. A toolbar along the top allows access functions like page navigation, printing, exporting, zooming, and text searching.
- Report Parts viewer—A report viewer component that renders just individual elements of a report. This is useful for portal-style applications where only a small portion of the screen is reserved for report viewing.
- DHTML Interactive viewer—Looks and acts identical to the Page viewer but exposes an extra toolbar button that provides an additional user interface for doing data-level searching within the report.
- DHTML Grid viewer—A viewer component that just displays the data from the report in a grid without any layout or formatting applied.
The means with which all of these viewers interact with the reports themselves is a mechanism called the report source. The following section describes the report source in detail.
Understanding the Report Source
Because the Crystal Report viewer components are shared across both the Crystal Reports Server and the BusinessObjects Enterprise Professional/Premium editions, there must be a common interface defined so the viewer can display reports generated using both types of report processing engines. This interface is called the report source. The report source is an object that both the Crystal Reports Server edition and Professional/Premium editions supply that the viewer in turn communicates with to render the reports to the various forms of HTML.
There are two types of report sources, the Page Server and the Report Application Server. Each type of report source offers different advantages.
When to Use a Page Server
- You want to take advantage of the Cache Server, so individual report pages are not generated every time they are requested.
- Your application delivers reports that do not need to be changed at run-time.
When to Use the Report Application Server
- Your application needs to modify reports at run-time.
- Your application uses the DHTML Interactive viewer. The DHTML Interactive viewer requires the use of functionality only provided by the Report Application Server.
- Your application uses the DHTML Grid viewer. Since the DHTML Grid viewer does not function with a Page Server, you need to use the Report Application Server when using the DHTML grid viewer.
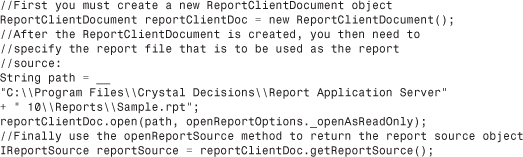
The Java code in Listing 33.1 illustrates the first scenario where a report source object is obtained from the standalone Report Application Server.
Listing 33.1 Obtaining a Report Source from a Report File
All the code listings provided in this chapter are provided in JSP/Java. Although the .NET/COM and the Java flavors of the RAS SDK share identical functionality, there are obviously language nuances associated with each of them. Many code samples for additional language flavors are available for download from the www.usingcrystal.com website.
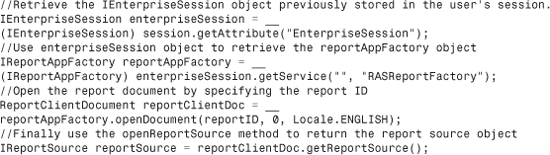
Listing 33.2 illustrates obtaining a report source when using the Report Application Server as part of BusinessObjects Enterprise. Notice that the same ReportClientDocument object is used. The difference is in how the ReportClientDocument object is obtained.
![]() For more information on using the IEnterpriseSession as associated BusinessObjects Enterprise objects, see “Creating an Enterprise Session,” p. 770.
For more information on using the IEnterpriseSession as associated BusinessObjects Enterprise objects, see “Creating an Enterprise Session,” p. 770.
Listing 33.2 Obtaining an EnterpriseSession Object
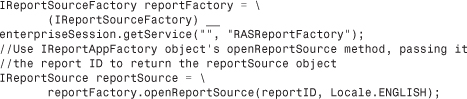
An alternative way to do this is shown in Listing 33.3.
Listing 33.3 Alternative Method to Obtain an EnterpriseSession Object

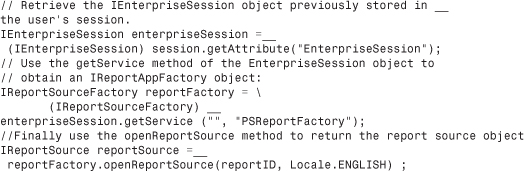
Listing 33.4 illustrates obtaining a report source object from the Page Server service from BusinessObjects Enterprise Professional/Premium.
Listing 33.4 Utilizing the Page Server to Open a Report
Implementing the Page Viewer
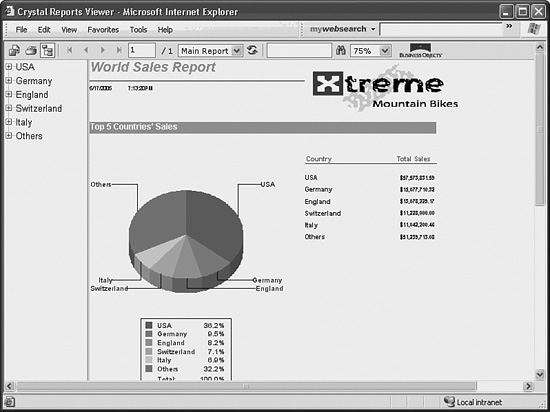
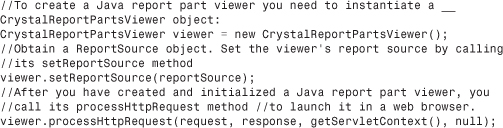
The first viewer component to be covered is the Page viewer, as illustrated in Listing 33.5. To use this viewer, you will create its CrystalReportViewer object. It, along with all the other viewers, exposes a method called setReportSource that accepts a valid report source object as obtained from the description in the previous section. Finally, again like the other viewers, it has a processHttpRequest method that accepts references to the current servlet context. This method does the actual rendering to HTML.
Listing 33.5 Viewing a Report over the Web

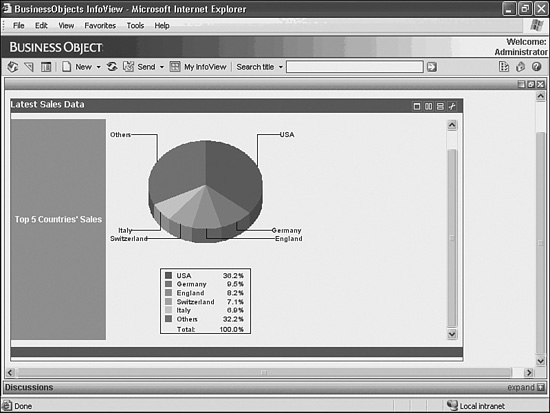
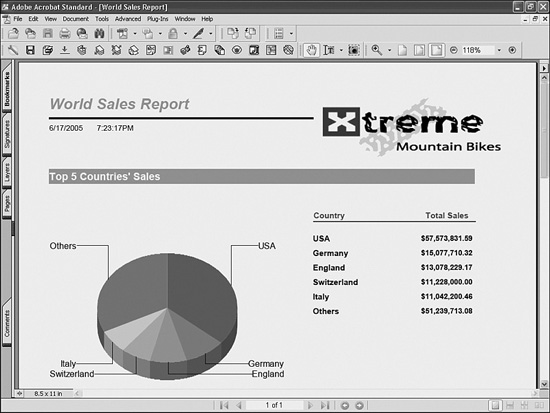
Figure 33.1 shows the output of this code.
Figure 33.1 A report being displayed in the DHTML Page viewer.
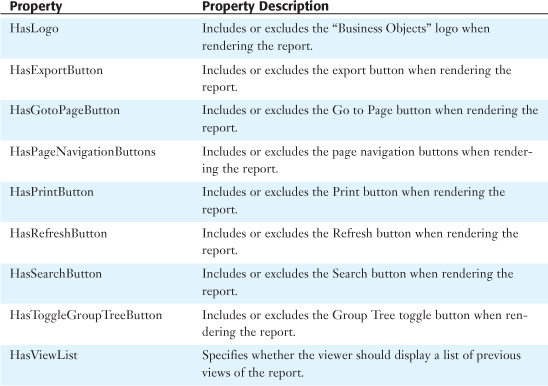
All viewers including the DHTML Page viewer share a number of toolbar elements. These properties can be programmatically toggled and are displayed in Table 33.1. All the viewer properties must be set before calling the ProcessHTTPRequest method that displays the selected report.
Table 33.1 Toolbar Elements (DHTML Page Viewer)

For example, to ensure the Business Objects logo is displayed when the involved report is viewed, the code line
Viewer.HasLogo(true);
needs to be included in the code before the processHTTPRequest method is called.
As the different viewers are introduced and discussed later in this chapter, some additional elements pertinent to the viewer being discussed will be displayed in that section’s table.
Implementing the Part Viewer
The Part viewer works much the same way as the Page viewer—in fact, much of the code is exactly the same, except for the type of viewer object that is created. Listing 33.6 assumes that the report to be displayed has an initial report part defined in the report itself.
Listing 33.6 Viewing a Report Using the Report Part Viewer
If a report part is not defined for a report, or if the default part needs to be overridden, Listing 33.7 provides code that can be used to manipulate the ReportParts collection. Figure 33.2 shows the output of this page being displayed in a web browser.
Listing 33.7 Specifying Report Part Nodes
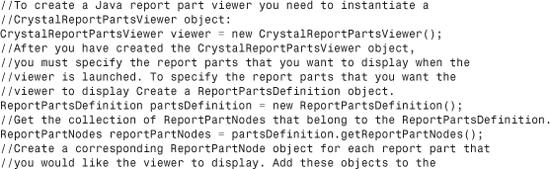
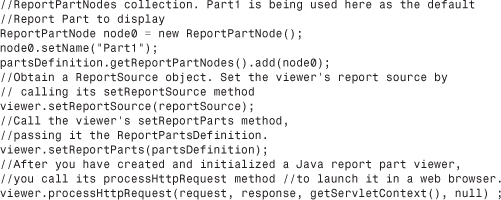
Figure 33.2 The Report Part viewer displaying a report part.
Implementing the Interactive Viewer
The Interactive viewer works almost exactly like the Page viewer. In fact, the Interactive viewer component derives from the Page viewer component, so it inherits all the base functionality. What it adds is a new toolbar button that enables an advanced searching User Interface inside the viewer. This is useful for larger reports and for end users requiring advanced searches where simple text string searching is not suitable. The Interactive viewer allows the report to be filtered using a specified record selection criteria.
Listing 33.8 shows a report being viewed by the Interactive viewer. Note that the setOwnPage method is called to indicate that the viewer owns the entire page, which is generally a good thing to do when using this viewer.
Listing 33.8 Using the Report Part Viewer in Code
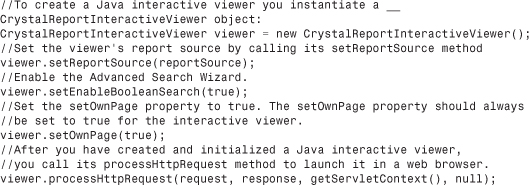
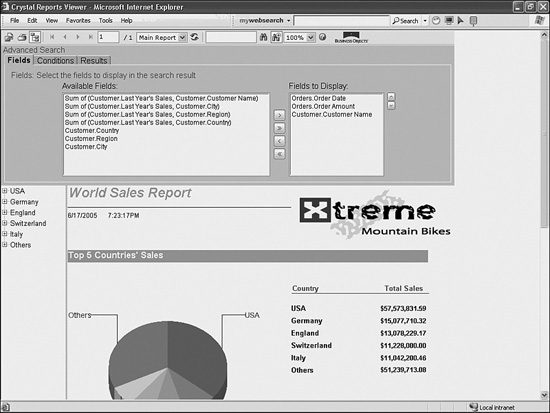
Figure 33.3 shows a report being displayed in the Interactive viewer and the advanced searching UI being used.
Figure 33.3 The Interactive viewer in action.
All viewers including the Interactive viewer share a number of toolbar elements. These properties can be programmatically toggled and are displayed in Table 33.2. All the viewer properties must be set before calling the ProcessHTTPRequest method that will display the selected report. For example, to ensure the Business Objects logo is displayed when the involved report is viewed, the code line
Viewer.HasLogo(true);
needs to be included in the code before the processHTTPRequest method is called.
Table 33.2 Toolbar Elements (Interactive Viewer)

Implementing the Grid Viewer
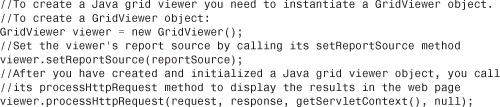
The final viewer to be covered in this chapter is the Grid viewer. The Grid viewer differs more from the other viewers in that it does not render the report’s presentation onscreen. Instead it looks at the dataset associated with the report (that is, the query result after the report engine has done its magic) and displays that data in a tabular fashion. This opens up some very interesting scenarios if you use your imagination.
You can override the style of the grid table by defining a stylesheet that maps to the styles used by the grid object. Consult the documentation for more information on this.
Listing 33.9 shows a report being displayed using the Grid viewer.
Listing 33.9 Displaying a Report in the Grid Viewer
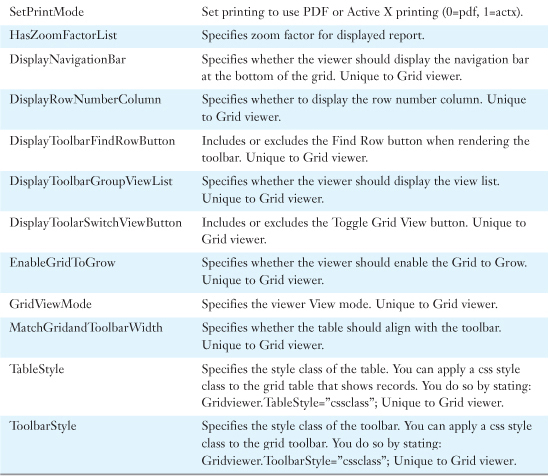
All viewers including the Grid viewer share a number of toolbar elements. These properties can be programmatically toggled and are displayed in Table 33.3. All the viewer properties must be set before calling the ProcessHTTPRequest method that will display the selected report. For example, to ensure the Business Objects logo is displayed when the involved report is viewed, the code line
Viewer.HasLogo(true);
needs to be included in the code before the processHTTPRequest method is called.
Table 33.3 Toolbar Elements (Grid Viewer)
Using the Export Control to Deliver Reports in Other Formats
So far all the scenarios that have been discussed in this chapter have involved displaying reports in dynamic HTML format. Although this is a great report delivery method for most scenarios, there are times when reports need to be exported to various other file formats.
Although this can be accomplished by using the ReportClientDocument object model, there is an easier way to do this: using the Export control.
Listing 33.10 shows how the Export control would be used to export a report to PDF. Notice that the Export control has the concept of the report source of the processHttpRequest method.
Listing 33.10 Exporting a Report via Code

Figure 33.4 shows a report being exported to PDF.
Figure 33.4 Using the Export control to export a report to PDF.

Troubleshooting
Report Viewing Performance Is Slow
What efficiencies can I add to increase the performance of my application?
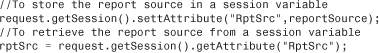
Caching a report source in the session variable allows it to be used multiple times efficiently. When a report source is not cached, the process of creating a new report source multiple times becomes fairly expensive. Furthermore, caching a report source allows reports with or without saved data to be refreshed.
Listing 33.11 shows how to store and retrieve the report source object from session state.
Listing 33.11 Caching a Report Source Object
The Viewer Needs to Work in a Page Without a Form Element
How can I control how the viewer interacts with a surrounding form?
If your web page contains only the viewer and nothing else, several things can be done that can simplify the report viewing implementation. The viewer is capable of generating complete HTML pages and can set the appropriate page properties depending on the viewing context. Setting the setOwnPage property to true provides several benefits. Allowing the viewer to handle the surrounding HTML content reduces the amount of code you need to add to your web page and allows the viewer to automatically determine certain settings. It correctly sets the content-type and charset information for the page. This ensures that pages containing international characters will be displayed correctly. When setOwnPage is set to true, you must use the processHttpRequest method to display the report instead of getHtmlContent. The processHttpRequest method must be used because using getHtmlContent has the same effect as setting setOwnPage to false, negating any of the benefits gained from setting setOwnPage to true. If your web page does not contain any controls that require post back, you should set the setOwnForm method to true. Doing so allows the viewer to handle the view state information automatically. The view state is used to perform client-side caching of information about the current state of the report. If you have other controls on the page, you must set setOwnForm to false and handle the view state information manually.
The Character Set Is Displaying Incorrectly
How can I indicate which unicode character to set should be used for the report viewing session?
To send characters from a web page to a web browser, you must use the correct encoding. Always specify the correct content-type and character set for all your web pages. If your web page returns content to a standard HTML browser, the following lines will ensure that the correct character set is defined. The contentType and charset directives let the browser know how the returned HTML page is encoded. UTF-8 is the recommended standard character set if it is available for your target client browser. For more information, consult the Release Notes or the vendor for your target client browser.