Graduate School of System Informatics, Kobe University and Operations and Computer Technologies Division, RIKEN Advanced Institute for Computational Science
Operations and Computer Technologies Division, RIKEN Advanced Institute for Computational Science
Research Organization for Information Science and Technology
5.1.1 Development Targets and Schedule
5.1.2 Application Software Development Programs
5.4.1 Early Access Prior to Official Operation
5.4.2 Operation Policy after Official Operation
Computer simulations are essential to elucidate natural phenomena such as global circulation of atmosphere, and to analyze artificial structures such as automobiles and buildings. Supercomputers which have powerful computational capability in scientific and engineering calculations are extremely important tools for such simulations. Therefore, many countries are committed to have supercomputers as a fundamental tool for national competitiveness. The performance of supercomputers has been increased during the past two decades; however, it is still insufficient to generate precise and accurate high-resolutions of simulations. Thus, the development of a supercomputer with much higher computational capability is required.
The Japanese government determined that supercomputing technology is one of the key technologies of national importance in the third Science and Technology Basic Plan, which was published in 2006. The Next-Generation Supercomputer Research and Development Project was initiated by the Ministry of Education, Culture, Sports, Science and Technology (MEXT) in 2006 as a seven-year project. RIKEN, Japan’s largest comprehensive research institution [18], played a key role in the project. In cooperation with Fujitsu Ltd., RIKEN developed a next-generation supercomputer system.
We named the next-generation supercomputer ![]() in Japanese and “K computer” in English after the target performance of 10 petaflops (one quadrillion floating-point operations per second or PFLOPS) in the LINPACK benchmark program. The name
in Japanese and “K computer” in English after the target performance of 10 petaflops (one quadrillion floating-point operations per second or PFLOPS) in the LINPACK benchmark program. The name ![]() was selected from approximately 2,000 public applications, because this kanji character stands for a Japanese prefix number indicating 1016 or 10 peta and was considered as an appropriate name for the system. The English name “K” was also determined after the same pronunciation of the kanji. Incidentally, a logo image of the K computer was written with a calligraphy-brush by a famous kanji artist, Sooun Takeda (Figure 5.1).
was selected from approximately 2,000 public applications, because this kanji character stands for a Japanese prefix number indicating 1016 or 10 peta and was considered as an appropriate name for the system. The English name “K” was also determined after the same pronunciation of the kanji. Incidentally, a logo image of the K computer was written with a calligraphy-brush by a famous kanji artist, Sooun Takeda (Figure 5.1).
In October 2011, the K computer broke the 10 PFLOPS wall for the first time during the development. Development was completed successfully in June 2012, and the K computer was fully operational and officially released to the public in September 2012 (Figure 5.2).
5.1.1 Development Targets and Schedule
The objectives of the project are to develop the most advanced and high performance supercomputer system in the world and to develop and deploy its usage technologies including development of application software for various computational sciences.
Target requirements for the K computer were determined in the beginning of the project in 2006. The target requirements include the followings:

FIGURE 5.1: Logo image of the K computer.

FIGURE 5.2: A view of the K computer.
• 10 PFLOPS sustained performance in the LINPACK benchmark.
• petaflops-sustained performance in real applications.
• low power consumption and high reliablity.
• applicability to a broad range of computational science and engineering simulations.
The project schedule is shown in Figure 5.3. We started the project in 2006 with the conceptual design, which was followed by a detailed design process. A prototype system was constructed to determine if the system design could achieve the performance requirement. Production of the K computer began in 2010. The racks of the system were installed in the computer building located in Kobe, Hyogo Prefecture, Japan, in September 2010. The system hardware was installed at the end of August 2011, and then system software components were developed after installation was complete. The complete system was finished in June 2012.
TABLE 5.1: Development history.
Date |
K computer |
Others |
January 1, 2006 |
Establishment of Next-Generation Supercomputing R&D Center at RIKEN |
|
September 19, 2006 |
Conceptual design was started. |
|
March 28, 2007 |
Site location was determined. |
|
March 30, 2007 |
Basic design of facilities was started. |
|
April 24, 2007 |
System configuration of a complex system with both scalar and vector systems was determined by RIKEN. |
|
July 4, 2007 |
Detailed design was started. |
|
July 31, 2007 |
Execution design of a computer building was started. |
|
September 13, 2007 |
System configuration was approved by Council for Science and Technology Policy. |
|
March 21, 2008 |
Construction of the computer building was started. |
|
May 13, 2009 |
System configuration was revised from the complex system to a scalar singly-system. |
|
July 17, 2009 |
The revised configuration was confirmed by a committee of MEXT. |
|
May 31, 2010 |
Computer building finished to be built. |
|
September 29, 2010 |
The first rack was installed in the computer building. |
|
October 2010 |
Logo image of the K computer was selected. |
|
March 31, 2011 |
Part of the K computer began to operate. |
|
June 20, 2011 |
LINPACK performace 8.162 PFLOPS was achieved with 672 racks and TOP 1 in TOP500 was taken. |
|
November 14, 2011 |
LINPACK performance 10.51 PFLOPS was achieved on full system and TOP 1 in TOP500 was taken again. |
|
November 15, 2011 |
TOP1 in HPCC benchmark (class 1) was awarded. |
|
November 17, 2011 |
Gordon Bell award was given for an electron state calculation of silicon nanowires. |
|
June 29, 2012 |
System development was completed. |
|
September 28, 2012 |
K computer was officially released to the public. |
|
November 2012 |
Gordon Bell award was given for simulation of gravitational evolution of dark matter. |

FIGURE 5.3: Development schedule of the K computer.
5.1.2 Application Software Development Programs
In 2006, two projects, the “Nano-science Grand Challenge” and the “Life-science Grand Challenge,” were formed to develop large-scale, massively parallel applications (codes) in conjunction with the development of the K computer. The application codes have been released and are available for public use.
The Strategic Program for Innovative Research (SPIRE) was also established to contribute to determining solutions to urgent scientific and social issues. The objectives of SPIRE were to bear scientific results as soon as the K computer began operation and to establish several core organizations for computational science. Five strategic application fields were selected for SPIRE by MEXT:
• Field 1: Predictive life sciences, healthcare, and drug design infrastructure.
• Field 2: Creating new materials and energy sources.
• Field 3: Global nature change prediction for disaster prevention and mitigation.
• Field 4: Next-generation manufacturing technology (MONO-ZUKURI in Japanese).
• Field 5: Origin and structure of space and space materials.
Numerous applications were developed and are presently being executed on the K computer.
The K computer [17, 8] is a distributed-memory supercomputer system that consists of a set of 82,944 compute nodes and 5,184 I/O nodes, a hierarchical file system, control and management servers, and front-end servers (Figure 5.4).
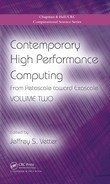
Each node is mainly composed of a CPU, 16 GB memory, and an LSI chip that interconnects the nodes (Figure 5.5).
Each node has a SPARC64 VIIIfx made by 45 nm semiconductor process technology by Fujitsu Ltd. [14]. This CPU has 8 cores on the LSI chip and 6 MB L2 cache, which is shared by the cores. The CPU operates at a clock frequency of 2 GHz. Its peak performance and performance per electricity unit are 128 gigaflops and 2.2 gigaflops/watt, respectively. Each core has four floating-point multiply-and-add execution units, two of which are operated concurrently by an SIMD instruction, and 256 double-precision floating-point data registers to facilitate scientific and engineering computations. The architecture is an extended version of the original SPARC architecture [9, 13]. Each core also has a 32 KB L1 data cache. The system has a hardware barrier synchronization function among the cores in a CPU, allowing execution and rapid synchronization of multiple threads among the cores. A sector cache function enables software-based allocation of data to the L1 and L2 caches. If iterative and contiguous access to data is required during execution of some parts of a program, the programmer can specify which data is to be allocated and stored on a sector of the L1 or L2 cache to avoid purging of data from the cache as a result of compulsory cache miss-hits.

FIGURE 5.4: Configuration of the K computer.
The newly developed Tofu network, which is a six-dimensional mesh/torus network, is implemented in the K computer for data communication among the compute nodes [3, 2]. The LSI chip for the Tofu network has 10 routes connected to 10 adjacent nodes, and several routing paths can be employed for communication among nodes. From a programming perspective, one-, two-, or three-dimensional torus network topologies can be employed. Such network topologies can be configured dynamically when a task is assigned to a portion of the K computer by specifying the required topology in a job script. Additionally, Tofu is highly reliable against single-point failures due to its redundant routing configuration.
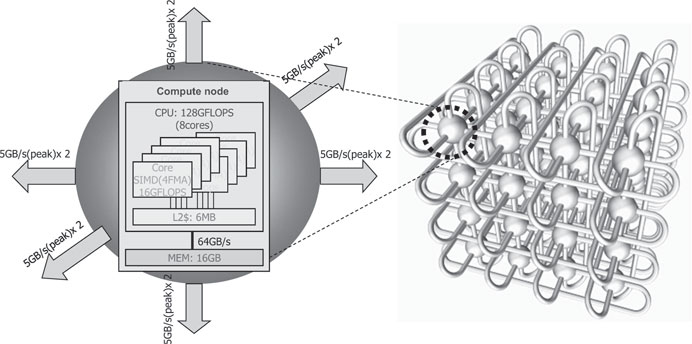
FIGURE 5.5: A node and logical 3-dimensional torus network.

FIGURE 5.6: System board.
The entire system consists of 864 compute node racks and each rack has 96 compute nodes and 6 I/O nodes. Four compute nodes are mounted on a system board (Figure 5.6), and 24 system boards are installed in the compute rack (Figure 5.7). Installation of the entire K computer system was finished in August 2011 (Figure 5.2), and the system was operational at the end of September 2012.

FIGURE 5.7: K computer rack.
A system software configuration is shown in Figure 5.8.
The operating system for the nodes is Linux. The Fortran, C, and C++ programming languages are available for users as the conventional programming environment.
The K computer employs a three-level parallel programming model to attain highly sustainable performance. The first level of parallel processing is SIMD processing in the core, and the second level is thread programming in a compute node supported by automatic parallelization and OpenMP directives. Any compiler can automatically generate a binary code that is executable concurrently by threads in the CPU. The third level is distributed-memory parallel programming with a message passing interface (MPI). The MPI library is provided for communication processes among compute nodes. It is based on an implementation of Open MPI in which several functions are customized to exploit several features of the Tofu network to achieve higher performance [1].
Two file systems, a global file system and a local file system, are implemented as a hierarchical file system to support a file-staging function. A user’s permanent files are always placed in the global file system. If the user assigns a job to the K computer that requires files stored in the global file system, the files are copied to the local file system before the job starts (staging in). After the job is completed, the files created in the local file system during the job are moved to the global file system (staging out). These file-staging operations are managed automatically by a job scheduler (Figure 5.9).
All user jobs submitted to the K computer are placed in appropriate queues and are processed sequentially in a first-come, first-served (FCFS) manner. The job queue accepts various job sizes ranging from a single compute node job to a full-node job that requires the entire system. An application user can specify the number of compute nodes, estimated elapsed time, and files to be staged from/to the global file system and to/from the local file system that the application requires in the job script. The specification of the estimated elapsed time is essential to facilitate back-fill scheduling.

FIGURE 5.8: Software stack of the K computer.

FIGURE 5.9: Batch job flow on the K computer.
If a compute node fails during the execution of a job, the job running on the nodes, including the failed node, is aborted. Then, if indicated by the job script, the same job is requeued. The K computer does not maintain check-point states at the system level at any time, and the application user is responsible for intermediate saving of simulation results.
The K computer provides three-level parallel programming model to attain high sustained performance. The first level of parallel processing is an SIMD processing on the core, the second one is a thread programming on the compute node supported by automatic parallelization or OpenMP directives, and the third one is a model for a distributed memory parallel processing with MPI.
A hybrid programming model with both thread programming and MPI parallel programming is recommended on the K computer, though a flat programming with only MPI parallel programming is possible. This means that a large number of MPI processes by the flat programming cause a lack of memory space assigned to users, because the MPI library requests some buffer area for each MPI process.
TABLE 5.2: System configuration summary.
Compute node and I/O node |
|
CPU |
Fujitsu SPARC64TM VIIIfx |
Performance |
128 GFLOPS |
Clock frequency |
2.0 GHz |
# of cores |
8 cores |
L1 cache/core |
32 kiB (I-cache, D-cache)/core |
L2 cache |
6 MiB/socket |
Technology |
45 nm CMOS |
Size |
22.7 mm x 22.6 mm |
Power consumption |
58 WABS |
Memory capacity |
16 GiB |
Compute node board |
4 compute nodes |
I/O node board |
1 I/O node (Chilled water and air cooling system) |
Rack |
24 node boards 6 I/O boards |
System |
82,944 compute nodes 5,184 I/O nodes 864 racks |
Performance |
10.6 PFLOPS |
Memory capacity |
1.27 PiB |
Interconnect network |
Tofu interconnect 6-dimensional Torus/mesh topology 24 x 18 x 17 x 2 x 3 x 2 |
The system configuration is summarized in Table 5.2 and Figure 5.10.
We measured the LINPACK benchmark performance on the K computer and obtained performance of 10.51 PFLOPS, which is approximately 92.3% of the peak performance. Furthermore, in terms of LINPACK performance per unit of power consumption (flops/watt), the value for a rack ranked sixth in the Green500 list in June 2011.
Another benchmark program, the “HPC challenge,” was performed on all K computer nodes. The measured values from four categories were 9.796 TFLOPS, 472 GUPS, 3857 TB/s, and 205.9 TFLOPS for global HPL, global random access, EP stream-triad per system, and global FFT, respectively. We graced the HPCC awards in four categories in 2011 and demonstrated the K computer as a well-balanced high-performance supercomputer system.

FIGURE 5.10: Configuration: From chip to system.
Two ACM Gordon Bell prizes were received for results calculated by the K computer for the electron states calculations of silicon nanowires and the gravitational evolution of dark matter in the early universe.
1. Electron states calculations of silicon nanowires [7]
Silicon nanowires are potentially promising materials for electron channels of next-generation field-effect transistors. It is important to clarify electron states of silicon nanowires to understand the behavior of new devices. Silicon nanowires comprise 10,000 to 100,000 silicon atoms, measure 10 to 20 nm in diameter, and are roughly 10 nm in length.
Simulations were performed with massively parallel real-space density functional theory (RSDFT) code [11] to compute the energy states and electron states of the matter. A sustained performance of 3.08 PFLOPS was achieved (representing execution efficiency of 43.6%) using approximately two-thirds of the full system in November 2011.
Recently, this simulation was performed using 82,944 nodes and obtained 5.48 PFLOPS sustained performance, which is 51.67% of peak performance [6].
2. Simulation of gravitational evolution of dark matter in the early universe [10]
The universe is primarily composed of dark matter and dark energy. There is approximately five times as much dark matter as baryonic matter, which is the type of matter we can see as atoms or molecules. Since dark matter dominates the gravitational evolution of the universe, it is important to understand the evolution of dark matter in order to reveal the structure formation of the universe.
A research group led by T. Ishiyama (SPIRE, Field 5) developed massively parallel code with a novel communication algorithm for the long-range calculation part of the simulation and a highly tuned gravity kernel for the short-range calculation part. They simulated the evolution of two trillion dark matter particles in the early universe using 98% of the K computer’s resources (81,408 nodes) and achieved 5.67 PFLOPS execution performance, which corresponds to 55% of the theoretical peak.
5.4.1 Early Access Prior to Official Operation
Complete construction of the K computer took approximately one year. We installed 16 to 32 racks each week, and made hardware adjustments to the racks during installation. The complete K computer was too large to assemble in the vendor factory; however, part of the system was assembled and tested in the factory.
As the K computer was expected to be heavily utilized as an important infrastructure, and much of the world’s most advanced computational science and engineering tasks would be performed immediately at the K computer completion, users must be well trained in the use of the system and understand how to improve their applications before the system completion.
In order to accelerate system adjustments and create remarkable results as soon as possible after the official release, we allowed early access to a part of the system in April 2011 to expert software developers. We gradually increased the available portion of the system from 500 TFLOPS to 9 PFLOPS.
Twenty-two applications were selected from the SPIRE fields at the beginning of the early access. The number of applications gradually increased and eventually reached 60. These applications could be used for simulations with good performance at the time of public release.
To allow use of a large number of K computer cores effectively, users were required to achieve a certain sustained performance for their applications. We presented simple rules to the developers to facilitate high concurrency of applications. If they wanted to use more cores for a larger simulation, they had to satisfy one of the following conditions.
1. Strong scaling αstrong should be satisfied by Equation (5.1) as the problem size is fixed and the number of cores increases from m to n.
(5.1) |
where Tm and Tn are periods of execution time when the number of compute nodes used in measurements are m and n, respectively, and 2m ≤ n. Users could measure time with n compute nodes once before they were allowed to increase the number of compute nodes from m to n.
2. Weak scaling should be satisfied by Equation (5.2) as the problem size of each compute node is fixed and the number of cores increases for applications of primarily floating-point number operations.
(5.2) |
where Fm and Fn are sustained performance in FLOPS when the number of compute nodes used in measurements are m and n, respectively, and 2m ≤ n. Users could measure time with n nodes once before they were allowed to increase the number of compute nodes from m to n.
3. Weak scaling should be satisfied by Equation (5.3) as the problem size of each compute node is fixed and the number of cores increases for applications of primarily non-floating-point number operations.
(5.3) |
where Mm and Mn are the number of executed instructions per second when the number of compute nodes used in measurements are m and n, respectively, and 2m ≤ n. Users could measure the time once before they were allowed to increase the number of compute nodes from m to n.

FIGURE 5.11: Progression of increasing the number of applications and the number of concurrent applications. The solid line denotes the number of applications executed. Percentage denotes the ratio of the number of concurrent applications.
Figure 5.11 shows the progression of expanding the number of compute nodes used in simulations and the number of applications for the early access period. The ratio of applications that used greater than 14,000 compute nodes increased as the system was close to the end of installation. Thirty applications achieved more than 24,000 concurrencies.
5.4.2 Operation Policy after Official Operation
The K computer officially began operation on September 28, 2012 and was open to both SPIRE users and general users chosen by a project selection committee.
As shown in Table 5.3, the system has four job queues now, though it had one queue at the release. Three of them are open in an ordinary operation mode. One-ninth of the system is allocated to interactive jobs and small jobs that use less than 384 compute nodes, and eight-ninths are allocated to jobs that use between 385 and 36,864 compute nodes. As shown in Figure 5.12, the operation mode changes for larger jobs. Huge jobs, i.e., those that use more than 36,865 compute nodes, are processed in three contiguous days per month.
FCFS job processing is a principal service policy of a job scheduling. Due to the direct connection characteristics of the Tofu network, compute nodes assigned to a job are allocated such that the compute nodes are in close proximity in terms of network connections to avoid degradation of communications and imbalanced communication time. However, jobs can be inserted into the FCFS queue overtaking waiting jobs if time and compute nodes are available. The behavior is called back-fill processing and is illustrated in Figure 5.13.
TABLE 5.3: Job limitations.
Resource group (job queue) |
Node size limit |
Elapsed time limit |
interactive |
1 – 384 |
6 hours |
small |
1 – 384 |
24 hours |
large |
385 – 36,864 |
24 hours |
huge |
36,865 – 82,944 |
8 hours |

FIGURE 5.12: Ordinary mode and large-scale job mode operation.
To ensure fair allocation of resources in terms of periods of waiting time per node-time product, scheduling parameters, such as the number of accepted jobs per user group and elapsed time limit, are set such that job wait periods per node-time product are nearly equal.
The job-filling rate is defined as ratio between the number of compute nodes used to process jobs and the total number of available compute nodes. Figure 5.14 illustrates the job-filling rate after the system was opened for shared use. During the first six months of operation, we had an opportunity to assess how the job scheduler behaved in actual operation conditions. During this period the job-filling rate was 50–70%, in part because users were not familiar with the system. As of April 2013, the rate was approximately 80%, and that level has been maintained. This high rate has been achieved because users learned how to use the system effectively, we introduced a separate queue for small and iteractive jobs, and we improved the job scheduler.
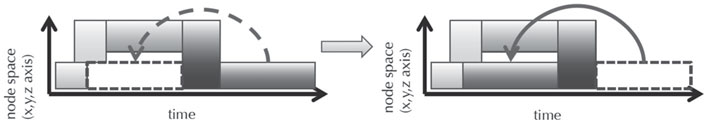
FIGURE 5.13: Back-fill job scheduling.

FIGURE 5.14: Job-filling rate.
We also developed a command that informs users of the expected wait time based on job attributes, such as the number of compute nodes and the estimated elapsed time.
In addition to standard benchmarks, such as LINPACK and HPCC, six target applications employing different computational models and algorithms were selected from earth science, material science, engineering and physics to demonstrate the capability and performance of the K computer.
The applications selected were the Nonhydrostatic Icosahedral Atomspheric Model (NICAM) [16], Seism3D [5], FrontFlow/blue(FFB) [12], Lattice-QCD [4], PHASE [15], and RSDFT [11]. NICAM is used to achieve advanced simulations that capture the subtleties of tropical cumulus cloud convection activities in relation to general atmospheric circulation. The advanced simulations make it possible to explain atmospheric phenomena that have been difficult to simulate so far. Seism3D is a finite difference code which aims to evaluate earthquakes and their inducing phenomena by analyzing and predicting seismic wave propagation and strong seismic motion in a short period. FFB is an unsteady flow analysis code based on large eddy simulation that generates high performance flow predictions, including the behavior of turbulent boundary layers. LatticeQCD is a lattice QCD simulation code that identifies the origin of matter. PHASE and RSDFT are first-principle molecular dynamics codes based on density functional theory that are used to explore nanodevices and non-silicon devices. PHASE uses a plane wave expansion method and RSDFT uses a finite difference method.
Each application is a complete actual simulation program, and each employs a hybrid model that combines a thread programming model and a parallel-process programming model written in Fortran.
Application performance is closely related to both performance of a single multicore processor and parallel execution. Performance of a single multicore processor depends on the memory bandwidth between the processor and memory, which is referred to as a byte/flop value (B/F), memory access pattern, and cache miss-hit ratio. The performance of parallel executions primarily depends on message communications, such as communication type, message size, and the frequency of communications between parallel processes. If we want to optimize program and obtain higher performance, then B/F value, memory access pattern, L2 cache miss-hit ratio, and communication type, size, and frequency should be considered.
When we considered qualitative measures for each application, the applications could be classified into four types, as shown in Figure 5.15. For example, an application located on the right side of the horizontal axis indicates that higher performance is difficult to obtain in parallel execution.
Techniques for improving the performance of the applications are summarized for the four classifications.
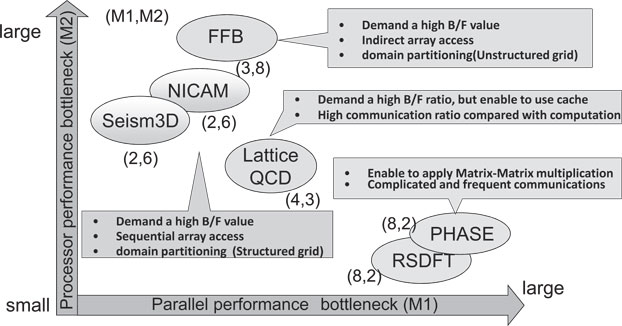
FIGURE 5.15: Categorization of the six applications.
NICAM and Seism3D apply standard parallelization using domain decomposition, and most of the messages transferred among computational domains (a set of grids) occur through adjacent communication. This implementation is quite suitable for the Tofu network to obtain scalable performance.
Improvements for parallel implementation are not required. For example, it was found that the communication cost of Seism3D remains low as the number of parallel processes increases because Seism3D communications were limited to four adjacent compute nodes in two-dimensional network topology and the messages could be transferred effectively due to K computer’s Tofu network.
However, other improvements are necessary. It is difficult to achieve high processor performance because kernel loops access many contiguous variables in the innermost loop and result in L1 cache slashing and register spills, i.e., the application requires high B/F values.
To avoid these problems, we must determine if kernel loops in hot spots use all of the available memory bandwidth which is limited to the theoretical memory bandwidth of the hardware. If the kernel loop uses all available bandwidth, either loop division or array merging should be applied. We improved the performance of the codes by such modifications.
FFB has some collective communications with scalar data between all processes. These collective communications are managed by a hardware barrier mechanism and do not require any improvements. Even if the number of parallel processes becomes large, FFB can maintain shorter communication times on the K computer than that on the other systems as the number of parallel processing becomes larger. Moreover, since FFB is a finite element method code, the kernel loop will access memory indirectly from list-indexed array data, and therefore a high B/F value is necessary.
An effective optimization method is to confine to the variables in a small memory address space and use cached variables as much as possible. We renumbered the finite element nodes to reduce the number of far-distance memory accesses to the memory. Renumbering is a very effective performance optimization method to obtain higher performance.
Although LatticeQCD has a high frequency of adjacent communications, the low latency of the K computer’s MPI library improves communication delays. Therefore, degradation due to parallel execution was smaller than that of other systems. LatticeQCD is expected to have high performance because memory access can be confined to a small contiguous memory area that can be loaded to L2-cache. It was, however, difficult to obtain the expected performance without any improvement to the code.
We observed high L1 cache miss-hit rates, a large number of WAIT operations for cache access by integer operations, and a low rate of SIMD instructions in the original code. These were caused by inadequate series of instructions and because compiler analysis lacks the capability to generate a more effective sequence of instructions. However, a Fortran compiler has been improved to generate code that can be executed more quickly; thus, higher processor performance was achieved.
PHASE and RSDFT [6] have a high frequency of collective communications for a large volume of message data and synchronization among the global communicators, such as MPI COMM WORLD which causes a serious performance bottleneck in large-scale parallel processing.
Computation schemes can actually have two possible parallelization spaces; however, parallelization was only implemented in one space. Therefore, an additional parallelization that the other space was incorporated to restrict collective communications to smaller computations as follows. Additional parallelization for wave numbers rather than energy bands was applied to PHASE, and additional parallelization for energy bands rather than discretized lattice grids was applied to RSDFT. These implementations allowed for collective communications to be localized to a small portion of the computations, thereby eliminating global communications. The number of code concurrencies can also be increased as a secondary effect of this improvement. As a result, larger simulations can be performed.
A collective communication algorithm called Trinaryx3 [1], which is implemented using the Tofu network, was applied to code to reduce communication costs. In addition, matrix-matrix multiplication in the kernel was replaced by a BLAS library tuned specifically for the K computer.
Table 5.4 shows the performance of the six target applications. A hardware monitor was used to count the number of floating-point operations, and more than 80,000 nodes were used for the measurements. We found that four applications achieved greater than one PFLOPS, and one of the development targets was accomplished.
The facilities for housing the K computer have many features. There are four buildings at the RIKEN Advanced Institute for Computational Science (RIKEN AICS): the research building, the computer building, the chiller building, and the electricity supply substation building (Figures 5.16 and 5.17).
TABLE 5.4: Performance of six target applications.
Program Name |
Sustained performance (PFLOPS) |
Efficiency (%) |
# of used nodes |
NICAM |
0.84 |
8.05 |
81,920 |
Seism3D |
1.90 |
17.90 |
82,944 |
FrontFlow/blue |
0.32 |
3.16 |
80,000 |
LatticeQCD |
1.65 |
15.60 |
82,944 |
PHASE |
2.14 |
20.15 |
82,944 |
RSDFT |
5.48 |
51.67 |
82,944 |
The research building has six stories above ground and one below. The computer building has three stories above ground and one below. These two buildings have seismically isolated structures that employ three types of seismic isolation equipment, including laminated rubber dampers, lead dampers, and stiffness steel dampers, to provide S-grade earthquake resistance (Figure 5.18).
In the chiller building, there are two types of chillers: four absorption refrigeration chillers and three centrifugal water chillers. In addition, there are two gas turbine cogeneration systems, which can generate electricity (maximum 5 MW for each) and steam for the absorption chillers. The computer room is on the third floor and the storage system (approximately 30 petabytes) is on the first floor. These floors are raised by 5 ft. from the normal floor. The area of the computer room, which has no internal vertical supports as shown in Figure 5.19, is 3,000 m2 (32,300 sq. ft.). Therefore, it provides considerable ease and flexibility for arranging computer racks and installing network cables.

FIGURE 5.16: A view of the facilities.
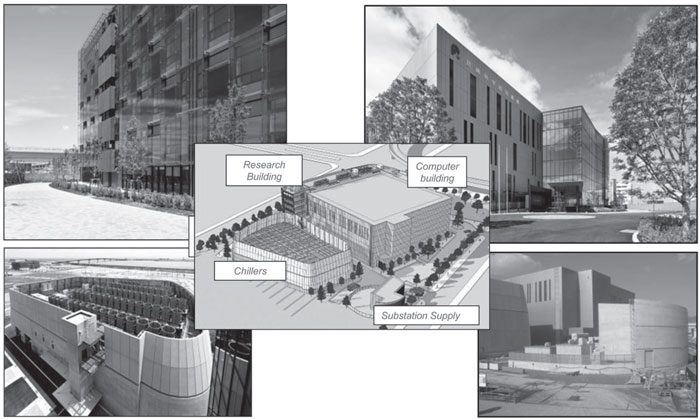
FIGURE 5.17: A view of the buildings.
Air handling units are located on the second floor and on the first basement, which are immediately below the computer room and storage system room floors, respectively. Cool air generated by the air-handling units travels to the above floors to cool the K computer and storage system (Figure 5.20). There are also heat exchangers between the first coolant loop from the chiller building and the second coolant loop circulating inside compute node racks of the K computer. The chilled water of the first coolant loop is generated by the refrigerators in the chiller building.

FIGURE 5.18: Seismic isolated structures: Laminated rubber damper, lead damper, and stiffness steel damper (left to right).

FIGURE 5.19: Pillar-free computer room.

FIGURE 5.20: Cross-section of the building.
The chapter authors would like to thank all members of the Next-Generation Supercomputer Research and Development Center at RIKEN. They would especially like to thank Dr Tadashi Watanabe, the K computer development project leader, for his enthusiastic encouragement.
[1] T. Adachi, N. Shida, K. Miura, S. Sumimoto, A. Uno, M. Kurokawa, F. Shoji, and M. Yokokawa. The design of ultra scalable MPI collective communication on the K computer. Computer Science - Research and Development, 28(2–3):147–155, 2013.
[2] Y. Ajima, T. Inoue, S. Hiramoto, T. Shimizu, and Y. Takagi. The Tofu interconnect. IEEE Micro, 32(1):21–31, 2012.
[3] Y. Ajima, S. Sumimoto, and T. Shimizu. Tofu: A 6D mesh/torus interconnect for exascale computers. Computer, 42(11):36–40, 2009.
[4] S. Aoki, K.-I. Ishikawa, N. Ishizuka, T. Izubuchi, D. Kadoh, K. Kanaya, Y. Kuramashi, Y. Namekawa, M. Okawa, Y. Taniguchi, A. Ukawa, N. Ukita, and T. Yoshié. 2 + 1 flavor lattice QCD toward the physical point. Phys. Rev. D, 79:034503, Feb. 2009.
[5] T. Furumura and L. Chen. Parallel simulation of strong ground motions during recent and historical damaging earthquakes in Tokyo, Japan. Parallel Computing, 31(2):149–165, 2005.
[6] Y. Hasegawa, J. Iwata, M. Tsuji, D. Takahashi, A. Oshiyama, K. Minami, T. Boku, H. Inoue, Y. Kitazawa, I. Miyoshi, and M. Yokokawa. Performance evaluation of ultra-large scale first-principles electronic structure calculation code on the K computer. International Journal of High Performance Computing Applications, 2013.
[7] Y. Hasegawa, J. Iwata, M. Tsuji, D. Takahashi, A. Oshiyama, K. Minami, T. Boku, F. Shoji, A. Uno, M. Kurokawa, H. Inoue, I. Miyoshi, and M. Yokokawa. First-principles calculations of electron states of a silicon nanowire with 100,000 atoms on the K computer. In Proceedings of 2011 International Conference for High Performance Computing, Networking, Storage and Analysis, SC ’11, pages 1–11, New York, NY, USA, 2011. IEEE Computer Society Press.
[8] M. Hoshino, editor. Fujitsu Scientific and Technical Journal - Special Issue on the K computer, volume 48. Fujitsu Limited, July 2012.
[9] SPARC International. The SPARC Architecture Manual (Version 9). Prentice-Hall, 1994.
[10] T. Ishiyama, K. Nitadori, and J. Makino. 4.45 pflops astrophysical n-body simulation on K computer: the gravitational trillion-body problem. In Proceedings of 2012 International Conference on High Performance Computing, Networking, Storage and Analysis, SC ’12, pages 5: 1–5:10, Los Alamitos, CA, USA, 2012. IEEE Computer Society Press.
[11] J. Iwata, D. Takahashi, A. Oshiyama, T. Boku, K. Shiraishi, S. Okada, and K. Yabana. A massively parallel electronic-structure calculations based on real-space density functional theory. Journal of Computational Physics, 229(6):2339–2363, 2010.
[12] K. Kumahata, S. Inoue, and K. Minami. Kernel performance improvement for the FEM-based fluid analysis code on the K computer. Procedia Computer Science, 18(0): 2496–2499, 2013. 2013 International Conference on Computational Science.
[13] Fujitsu Ltd. SPARC64VIIIfx Extensions (in Japanese), 2009.
[14] T. Maruyama, T. Yoshida, R. Kan, I. Yamazaki, S. Yamamura, N. Takahashi, M. Hondou, and H. Okano. SPARC64 VIIIfx: A new-generation octocore processor for petascale computing. Micro, IEEE, 30(2):30–40, 2010.
[15] T. Ohno, T. Yamamoto, T. Kokubo, A. Azami, Y. Sakaguchi, T. Uda, T. Yamasaki, D. Fukata, and J. Koga. First-principles calculations of large-scale semiconductor systems on the earth simulator. In Proceedings of 2007 International Conference for High Performance Computing, Networking, Storage and Analysis, SC ’07, pages 1–6, 2007.
[16] M. Satoh, T. Matsuno, H. Tomita, H. Miura, T. Nasuno, and S. Iga. Nonhydrostatic icosahedral atmospheric model (NICAM) for global cloud resolving simulations. Journal of Computational Physics, 227(7):3486–3514, 2008.
[17] M. Yokokawa, F. Shoji, A. Uno, M. Kurokawa, and T. Watanabe. The K computer: Japanese next-generation supercomputer development project. In Proceedings of 2011 International Symposium on Low Power Electronics and Design (ISLPED’11), pages 371–372, 2011.
[18] A. Yonezawa, T. Watanabe, M. Yokokawa, M. Sato, and K. Hirao. Advanced Institute for Computational Science (AICS): Japanese national high-performance computing research institute and its 10-petaflops supercomputer. In Proceedings of 2011 International Conference for High Performance Computing, Networking, Storage and Analysis, SC ’11, pages 1–8, Los Alamitos, CA, USA, 2011. IEEE Computer Society Press.