
Chapter 3
Classical Detection
3.1 Formalism of Quantum Information
Fundamental Fact: The noise lies in a high-dimensional space; the signal, by contrast, lies in a much lower-dimensional space.
If a random matrix A has i.i.d rows Ai, then A*A = ∑iAiAiT where A* is the adjoint matrix of A. We often study A through the n × n symmetric, positive semidefinite matrix, the matrix A*A. The eigenvalues of ![]() are therefore nonnegative real numbers.
are therefore nonnegative real numbers.
An immediate application of random matrices is the fundamental problem of estimating covariance matrices of high-dimensional distributions [107]. The analysis of the row-independent models can be interpreted as a study of sample covariance matrices. For a general distribution in ![]() , its covariance can be estimated from a sample size of N = O(nlogn) drawn from the distribution. For sub-Gaussian distributions, we have an even better bound N = O(n). For low-dimensional distributions, much fewer samples are needed: if a distribution lies close to a subspace of dimension r in
, its covariance can be estimated from a sample size of N = O(nlogn) drawn from the distribution. For sub-Gaussian distributions, we have an even better bound N = O(n). For low-dimensional distributions, much fewer samples are needed: if a distribution lies close to a subspace of dimension r in ![]() , then a sample of size N = O(rlogn) is sufficient for covariance estimation.
, then a sample of size N = O(rlogn) is sufficient for covariance estimation.
There are deep results in random matrix theory. The main motivation of this subsection is to exploit the existing results in this field to better guide the estimate of covariance matrices, using nonasymptotic results [107].
3.2 Hypothesis Detection for Collaborative Sensing
The density operator (matrix) ρ is the basic building block. An operator ρ satisfies: (1) (Trace condition) ρ has trace equal to one, that is, Trρ = 1; (2) (Positivity) ρ is a positive operator, that is, ρ ≥ 0. Abusing terminology, we will use the term “positive” for “positive semide finite (denoted A ≥ 0).” Covariance matrices satisfy the two necessary conditions. We say A > 0 when A is a positive definite matrix; B > A means that B − A is a positive definite matrix. Similarly, we say this for nonnegative definite matrix for B − A ≥ 0. The hypothesis test problems can be written as
where Rn is the covariance matrix of the noise and RS that of the signal. The signal is assumed to be uncorrelated with the noise. From (3.1), it follows that RS ≥ 0 and Rn > 0. In our applications, this noise is modeled as additive so that if x(n) is the “signal” and w(n) the “noise,” the recorded signal is
![]()
Often, this additive noise is assumed to have zero mean and to be uncorrelated with the signal. In this case, the covariance of the measured data, y(n), is the sum of the covariance of x(n) and w(n). Specifically, note that since
![]()
if x(n) and w(n) are uncorrelated, then
![]()
and it follows that
3.2 ![]()
Discrete-time random processes are often represented in matrix form. If
![]()
is a vector of p + 1 values of a process x(n), then the outer product

is a (p + 1) × (p + 1) matrix. If x(n) is wide-sense stationary, taking the expected value and using the Hermitian symmetry of the covariance sequence, ![]() , leads to the (p + 1) × (p + 1) matrix of covariance values
, leads to the (p + 1) × (p + 1) matrix of covariance values
3.3 
referred to as the covariance matrix. The correlation matrix Rx has the following structure:
where I is identity matrix and TrA represents the trace of A. The covariance matrix has the following basic structures:
A complete list of properties is given in Table 3.1. When the mean values mx and my are zero, the autocovariance and matrices are equal. We will always assume that all random processes have zero mean. Therefore, we use the two definitions interchangeably.
![]()
![]()
![]()
![]()
![]()
![]()
![]()


![]()


![]()
![]()
![]()
Table 3.1 Definition and properties for correlation and covariance matrices [108, p. 39]
| Auto-correlation and covariance | ||
| Symmetry | Rx = Rx* | Cx = Cx* |
| Positive semidefinite | Rx ≥ 0 | Cx ≥ 0 |
| Interrelation | Rx = Cx + mxmx* | |
| Cross-correlation and cross-covariance | ||
| Relation to Ryx and Cyx | Rxy = Ryx | Cxy = Cyx |
| Interrelation | Rxy = Cxy + mxmy* | |
| Orthogonal and uncorrelated | x, y orthogonal: Rxy = 0 | x, y uncorrelated: Cxy = 0 |
| Sum of | Rx+y = Rx + Ry | Cx+y = Cx + Cy |
| x and y | if x, y orthogonal | if x, y uncorrelated |
![]()
![]()
![]()
Let A be a Hermitian operator with qI ≤ A ≤ QI. The matrices QI − A and A − qI are positive and commute with each other [109, p. 95]. Since Rw is positive (of course, Hermitian), we have
![]()
The random matrix ![]() is Hermitian, but not necessarily positive. X is Hermitian, since its eigenvalues must be real. The Hoffman-Wielandt is relevant in this context.
is Hermitian, but not necessarily positive. X is Hermitian, since its eigenvalues must be real. The Hoffman-Wielandt is relevant in this context.

(3.5) can be used to bound the difference of the eigenvalues between A and B.
3.3 Sample Covariance Matrix
In Section 3.2, the true covariance matrix is needed for hypothesis detection. In practice, we only have access to the sample covariance matrix which is a random matrix. We first present some basic definitions and properties related to a sample covariance matrix. The determinant of a random matrix S, det S, also called generalized variance, is of special interest. It is an important measure of spread in multidimensional statistical analysis.
3.3.1 The Data Matrix
The general (n × N) data matrix will be denoted X or X(n × N). The element in row i and column j is xij. We write the matrix X = (xij). The rows of X will be written as
![]()
Or
where

3.3.1.1 The Mean Vector and Covariance Matrix
The sample mean of the ith variable is
and the sample variance of the ith variable is
3.7 ![]()
The sample covariance between the ith and jth variable is
3.8 ![]()
The vector of means,

is called the sample mean vector, or simply the “mean vector.” The N × N matrix
![]()
is called the sample covariance matrix, or simply “covariance matrix.” It is more convenient to express the statistics in matrix notation. Corresponding to (3.6) and (3.9), we have
where 1 is a column vector of n ones. On the other hand,
![]()
so that
This may be expressed as
![]()
using (3.10). Writing
![]()
where H is called the centering matrix, we obtain the following standard form
which is a convenient matrix representation of the sample covariance matrix. We need a total of nN points of samples to estimate the sample covariance matrix S. Turning the table around, we can “summarize” information of nN points of samples into one single matrix S. In spectrum sensing, we are given a long record of data about some random variables, or a random vector of large data dimensionality.
Let us check the most important property of S: S is a positive semidefinite matrix. Since H is a symmetric idempotent matrix: H = HT, H = H2, for any N-vector a,
![]()
where y = HXa. Thus, the covariance matrix S is positive semidefinite, writing
![]()
For continuous data, we expect S is not only positive semidefinite, but positive definite, writing
![]()
if n ≥ N + 1.
It is often convenient to define the covariance matrix with a divisor of n − 1 instead of n. Set
![]()
If the data forms a random vector sample from a multivariate distribution, with finite second moments, then Su is an unbiased estimate of the true covariance matrix. See Theorem 2.8.2 of [110, p. 50].
The sample correlation coefficient between the ith and the j variables is
![]()
Unlike sij, the correlation coefficient is invariant under both changes of scale and origin of the ith and the jth variables. This property is the foundation of detection of correlated structures among random vectors. Clearly,
![]()
where |a| is the absolute value of a. Define the sample correlation matrix as
![]()
with ρii = 1. It follows that
![]()
If Σ = I, we say that the variables are uncorrelated. This is the case for white Gaussian noise. If D = diag(si), then
![]()
3.3.1.2 Measure of Multivariate Scatter
The matrix S is one possible multivariate generation of the univariate notion of variance, measuring scatter above the mean. Physically, the variance is equivalent to the power of the random vector. For example, for a white Gaussian random variable, the variance is its power.
Sometimes, for example, for hypothesis testing problems, we would rather have a single number to measure multivariate scatter. Of course, the matrix S contains many more structures (“information”) than this single real number. Two common such measures are
A motivation for these measures is in principle component analysis (PCA) that will be treated later. For both measures, large values indicate a high degree of scatter about the mean vector ![]() —physically larger power. Low values represent concentration about the mean vector
—physically larger power. Low values represent concentration about the mean vector ![]() . Two different measures reflect different aspects of the variability in the data. The generalized variance plays an important role in maximum likelihood (ML) estimation while the total variance is a useful concept in principal component analysis. In the context of low SNR detection, it seems that the total variance is a more sensitive measure to decide on two alternative hypotheses.
. Two different measures reflect different aspects of the variability in the data. The generalized variance plays an important role in maximum likelihood (ML) estimation while the total variance is a useful concept in principal component analysis. In the context of low SNR detection, it seems that the total variance is a more sensitive measure to decide on two alternative hypotheses.
The necessity for studying the (empirical) sample covariance matrix in statistics arose during 1950s when practitioners were searching for a scalar measure of dispersion for the multivariate data [111, Chapter 2]. This scalar measure of dispersion is relevant under the context of hypothesis testing. We need a scalar measure to set the threshold for testing.
3.3.1.3 Linear Combinations
Linear transformations can simplify the structure of the covariance matrix, making interpretation of the data more straightforward. Consider a linear combination
![]()
where a1, ···, aN are given. From (3.10), the mean is
![]()
and the variance is
![]()
where (3.11) is used.
For a q-dimensional linear transformation, we have
![]()
which may be written as
![]()
where Y is a q × q matrix and b is a q-vector. Usually, q ≤ N.
The mean vector and covariance matrix of the new objects yl are
If A is nonsingular (so, in particular, q = N), then
![]()
Here we give three most important examples: (1) the scaling transform; (2) Mahalanobis transform; (3) principal component transformation (or analysis).
3.3.1.4 The Scaling Transform
The n vectors of dimension N are objects of interest. Define the scaling transform as
![]()
This transformation scales each variable to have unit variance and thus eliminates the arbitrariness in the choice of scale. For example, if x(1) measures lengths, then y(1) will be the same. We have
![]()
3.3.1.5 Mahalanobis Transformation
If S > 0, then S−1 has a unique symmetric positive definite square root S−1/2. See A.6.15 of [110]. We define the Mahalanobis transformation as
![]()
Then
![]()
so that this transformation eliminates the correlation between the variables and standardizes the variance of each variable.
3.3.1.6 Principle Component Analysis
In the era of high-dimensionality data processing, PCA is extremely important to reduce the dimension of the data. One is motivated to summarize the total variance using much fewer dimensions. The notion of rank of the data matrix occurs naturally in this context. For zero-mean random vector, it follows, from (3.12), that
![]()
This mathematical structure plays a critical role in its applications.
By spectrum decomposition theorem, the covariance matrix S may be written as
![]()
where U is an orthogonal matrix and Λ is a diagonal matrix of the eigenvalues of S,
![]()
The principal component transformation is defined by the unitary rotation
![]()
Since
![]()
the columns of W, called principal components, represent uncorrelated linear combinations of the variables. In practice, one hopes to summarize most of the variability in the data using only the principal components with the highest variances, thus reducing the dimensions. This approach is the standard benchmark for dimensionality reduction.
The principal components are uncorrelated with variances
![]()
It seems natural to define the “overall” spread of the data by some symmetric monotonically increasing function of λ1, λ2, ···, λn, such as the geometric mean and the arithmetic mean

Using the properties of linear algebra, we have
We have used the facts for a N × N matrix

where λi is the eigenvalues of the matrix A. See [110, A.6] or [112], since the geometric mean of the nonnegative sequence is always smaller than the arithmetic mean of the nonnegative sequence, or [113]
![]()
where ai are nonnegative real numbers. Besides, the special structure of S ≥ 0, implies that all eigenvalues are nonnegative [114, p. 160]
![]()
The arithmetic mean-geometric mean inequality is thus valid for our case. Finally we obtain
3.13 ![]()
The rotation to principal components provides a motivation for the measures of multivariate scatter. Let us consider one application in spectrum sensing. The key idea behind covariance-based primary user's signal detection that the primary user signal received at the CR user is usually correlated because of the dispersive channels, the utility of multiple receiver antennas, or even oversampling. Such correlation can be used by the CR user to differentiate the primary signal from white noise.
Since Sx is a random matrix, det Sx and ![]() are scalar random variables. Girko studied random determinants [111]. 5.14 relates the determinant to the trace of the random matrix Sx. In Chapter 4, the tracial functions of Sx are commonly encountered.
are scalar random variables. Girko studied random determinants [111]. 5.14 relates the determinant to the trace of the random matrix Sx. In Chapter 4, the tracial functions of Sx are commonly encountered.
![]()

![]()
![]()
![]()
![]()
![]()
The max-min eigenvalue algorithm is simple and has a fairly good performance under the context of low SNR. At extremely low SNR, say − 25 dB, the calculated eigenvalues of the sample covariances matrix are random and look identical. This algorithm breaks down as a result of this phenomenon. Note that the eigenvalues are the variances of the principal components. The problem is that this algorithm depends on the variance of one dimension (associated with the minimum or the maximum eigenvalues).
The variances of different components are uncorrelated random variables. It is thus more natural to use the total variance or total variation.
3.4 Random Matrices with Independent Rows
We focus on a general model of random matrices, where we only assume independence of the rows rather than all entries. Such matrices are naturally generated by high-dimensional distributions. Indeed, given an arbitrary probability distribution in ![]() , one takes a sample of N independent points and arranges them as the rows of an N × n matrix A. Recall that n is the dimension of the probability space.
, one takes a sample of N independent points and arranges them as the rows of an N × n matrix A. Recall that n is the dimension of the probability space.
Let X be a random vector in ![]() . For simplicity we assume that X is centered, or
. For simplicity we assume that X is centered, or ![]() . Here
. Here ![]() denotes the expectation of X. The covariance matrix of X is the n × n matrix
denotes the expectation of X. The covariance matrix of X is the n × n matrix ![]() . The simplest way to estimate
. The simplest way to estimate ![]() is to take some N independent samples Xi from the distribution and form the sample covariance matrix
is to take some N independent samples Xi from the distribution and form the sample covariance matrix ![]() . By the law of large numbers,
. By the law of large numbers, ![]() almost surely as N → ∞. So, taking sufficiently many samples we are guaranteed to estimate the covariance matrix as well as we want. This, however, does not address the quantitative aspect: what is the minimal sample size N that guarantees approximation with a given accuracy?
almost surely as N → ∞. So, taking sufficiently many samples we are guaranteed to estimate the covariance matrix as well as we want. This, however, does not address the quantitative aspect: what is the minimal sample size N that guarantees approximation with a given accuracy?
The relation of this question to random matrix theory becomes clear when we arrange the samples Xi = :Ai as rows of the N × n random matrix A. Then, the sample covariance matrix is expressed as ![]() . Note that A is a matrix with independent rows but usually not independent entries. The reference of [107] has worked out the analysis of such matrices, separately for sub-Gaussian and general distributions.
. Note that A is a matrix with independent rows but usually not independent entries. The reference of [107] has worked out the analysis of such matrices, separately for sub-Gaussian and general distributions.
We often encounter covariance estimation for sub-Gaussian distribution due to the presence of Gaussian noise. Consider a sub-Gaussian distribution in ![]() with covariance matrix
with covariance matrix ![]() , and let
, and let ![]() ∈ (0, 1), t ≥ 1. Then with probability at least 1 − 2exp(− t2n) one has
∈ (0, 1), t ≥ 1. Then with probability at least 1 − 2exp(− t2n) one has
Here C depends only on the sub-Gaussian norm of a random vector taken from this distribution; the spectral norm of A is denoted as ||A||, which is equal to the maximum singular value of A, that is, smax = ||A||.
Covariance estimation for arbitrary distribution is also encountered when a general noise interference model is used. Consider a sub-Gaussian distribution in ![]() with covariance matrix
with covariance matrix ![]() and supported in some centered Euclidean ball whose radius we denote
and supported in some centered Euclidean ball whose radius we denote ![]() . Let
. Let ![]() ∈ (0, 1) and t ≥ 1. Then, with probability at least
∈ (0, 1) and t ≥ 1. Then, with probability at least ![]() , one has
, one has
Here C is an absolute constant and log denotes the natural logarithm. In (3.17), typically ![]() . The required sample size is N ≥ C(t/
. The required sample size is N ≥ C(t/![]() )2nlogn.
)2nlogn.
Low rank estimation is used, since the distribution of a signal in ![]() lies close to a low-dimensional subspace. In this case, a much smaller sample size suffices for covariance estimation. The intrinsic dimension of the distribution can be measured with the effective rank of the matrix
lies close to a low-dimensional subspace. In this case, a much smaller sample size suffices for covariance estimation. The intrinsic dimension of the distribution can be measured with the effective rank of the matrix ![]() , defined as
, defined as
3.18 ![]()
where ![]() denotes the trace of
denotes the trace of ![]() . One always has
. One always has ![]() , and this bound is sharp. The effective rank
, and this bound is sharp. The effective rank ![]() always controls the typical norm of X, as
always controls the typical norm of X, as ![]() . Most of the distribution is supported in a ball of radius
. Most of the distribution is supported in a ball of radius ![]() where
where ![]() . The conclusion of (3.17) holds with sample size N ≥ C(t/
. The conclusion of (3.17) holds with sample size N ≥ C(t/![]() )2rlogn.
)2rlogn.
Summarizing the above discussion, (3.16) shows that the sample size N = O(n) suffices to approximate the covariance matrix of a sub-Gaussian distribution in ![]() by the sample covariance matrix. While for arbitrary distribution, N = O(nlogn) is sufficient. For distributions that are approximately low-dimensional, such as that of a signal, a much smaller sample size is sufficient. Namely, if the effective rank of
by the sample covariance matrix. While for arbitrary distribution, N = O(nlogn) is sufficient. For distributions that are approximately low-dimensional, such as that of a signal, a much smaller sample size is sufficient. Namely, if the effective rank of ![]() equals r, then a sufficient size is N = O(rlogn).
equals r, then a sufficient size is N = O(rlogn).
Each observation of the sample covariance matrix is a random matrix. We can study the expectation of the observed random matrix. Since the expectation of a random matrix can be viewed as a convex combination, and also the positive semidefinite cone is convex [115, p. 459], expectation preserves the semidefinite order [116]:
Noncommunicativity of two sample covariance matrices: If positive matrices X and Y commute, then the symmetrized product is: ![]() which is not true,1 if we deal with two sample covariances. A simple MATLAB simulation using two random matrices can verify this observation. It turns out that this observation is of an elementary nature: Quantum information is built upon this noncommunicativity of operators (matrices). If the matrices A and B commute, the problem of (3.1) is equivalent to the classical likelihood ratio test [117]. A unifying framework including classical and quantum hypothesis testing (first suggested in [117]) is developed here.
which is not true,1 if we deal with two sample covariances. A simple MATLAB simulation using two random matrices can verify this observation. It turns out that this observation is of an elementary nature: Quantum information is built upon this noncommunicativity of operators (matrices). If the matrices A and B commute, the problem of (3.1) is equivalent to the classical likelihood ratio test [117]. A unifying framework including classical and quantum hypothesis testing (first suggested in [117]) is developed here.
When only N samples are available, the sample covariance matrices can be used to approximate the actual ones. A random vector ![]() is used to model the noise or interference. Similarly, a random vector
is used to model the noise or interference. Similarly, a random vector ![]() models the signal. In other words, (3.1) becomes
models the signal. In other words, (3.1) becomes

where ![]()
For any A ≥ 0, all the eigenvalues of A are nonnegative. Since some eigenvalues of ![]() and
and ![]() are negative, they are indefinite matrices of small tracial values. Under extremely low signal-to-noise ratios, the positive term (signal)
are negative, they are indefinite matrices of small tracial values. Under extremely low signal-to-noise ratios, the positive term (signal) ![]() in (3.20) is extremely small, compared with the other three terms. All these matrices are random matrices with dimension n.
in (3.20) is extremely small, compared with the other three terms. All these matrices are random matrices with dimension n.
Our motivation is to use the fundamental relation of (3.19). Consider (sufficiently large) K i.i.d. observations of random matrices A and B:
3.21 ![]()
The problem at hand is how the fusion center combines the information from these K observations. The justification for using the expectation is based on the basic observation of (3.20): expectation increases the effective signal-to-noise ratio. For the K observations, the signal term experiences coherent summation, while these other three random matrices go through incoherent summation.
Simulations: In (3.20), ![]() is no bigger than 0.5, so they do not have significant influence on the gap between
is no bigger than 0.5, so they do not have significant influence on the gap between ![]() and
and ![]() . Figure 3.1 shows that this gap is very stable. A narrowband signal is used. The covariance matrix
. Figure 3.1 shows that this gap is very stable. A narrowband signal is used. The covariance matrix ![]() is 4 × 4. About 25 observations are sufficient to recover this matrix with acceptable accuracy. Two independent experiments are performed to obtain
is 4 × 4. About 25 observations are sufficient to recover this matrix with acceptable accuracy. Two independent experiments are performed to obtain ![]() and
and ![]() . In our algorithms, we need to set the threshold first for the hypothesis test of
. In our algorithms, we need to set the threshold first for the hypothesis test of ![]() ; we rely on
; we rely on ![]() for
for ![]() . To obtain every point in the plot, N = 600 is used in (3.20).
. To obtain every point in the plot, N = 600 is used in (3.20).
Figure 3.1 The traces of covariances at extremely low SNR as a function of K observations. (a) SNR = −30 dB; (b) SNR = −34 dB.

Denote the set of positive-definite matrices by ![]() . The following theorem [115, p. 529] provides a framework: Let
. The following theorem [115, p. 529] provides a framework: Let ![]() , assume that A and B are positive semidefinite, assume that A ≤ B, assume that f(0) = 0, f is continuous, and f is increasing. Then,
, assume that A and B are positive semidefinite, assume that A ≤ B, assume that f(0) = 0, f is continuous, and f is increasing. Then,
A trivial case is: f(x) = x. If A and B are random matrices, combining (3.22) with (3.19) leads to the final equation
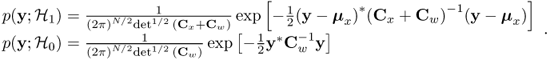
Consider a general Gaussian detection problem: ![]() ,
, ![]() where
where ![]() ,
, ![]() , and s and w are independent. The Neyman-Pearson detector decides
, and s and w are independent. The Neyman-Pearson detector decides ![]() if
if ![]() . This LRT leads to a structure of a prewhitener followed by an EC [118, p. 167]. In our simulation, we assume that we know perfectly the signal and noise covariance matrices. This serves as the upper limit for the LRT detector. It is amazing to discover that Algorithm 3.1 outperforms the LRT by several dBs!
. This LRT leads to a structure of a prewhitener followed by an EC [118, p. 167]. In our simulation, we assume that we know perfectly the signal and noise covariance matrices. This serves as the upper limit for the LRT detector. It is amazing to discover that Algorithm 3.1 outperforms the LRT by several dBs!
Related Work: Several sample covariance matrix based algorithms have been proposed in spectrum sensing. Maximum-minimum eigenvalue (MME)[119] and arithmetic-to-geometric mean (AGM) [120] uses the eigenvalues information, while feature template matching (FTM) [121] uses eigenvectors as prior knowledge. All these algorithms are based on covariance matrices. All the thresholds are determined by probability of false alarm.
Preliminary Results Using Algorithm 3.1: Sinusoidal signals and DTV signals captured in Washington D.C are used. For each simulation, zero-mean i.i.d. Gaussian noise is added according to different SNR. 2,000 simulations are performed on each SNR level. The threshold obtained by Monte Carlo simulations is in perfect agreement with that of the derived expression. The number of total samples contained in the segment is Ns = 100, 000 (corresponding to about 5 ms sampling time). The smoothing factor L is chosen to be 32. Probability of false alarm is fixed with Pfa = 10%. For simulated sinusoidal signal, the parameters are set the same.
Hypothesis detection using a function of matrix detection (FMD) is based on (3.23). For more details, we see [122]. It is compared with the benchmark EC, together with AGM, FTM, MME, as shown in Figure 3.2. FMD is 3 dB better than EC. While using simulated sinusoidal signal, the gain between FMD and EC is 5 dB. The longer the data, the bigger this gain.
Figure 3.2 Probability of detection. (a) Simulated Narrowband Signal; (b) Measured DTV Data.

3.5 The Multivariate Normal Distribution
The multivariate normal (MVN) distribution is the most important distribution in science and engineering [123, p. 55]. The reasons are manifold: Central limit theorems make it the limiting distributions for some sums of random variables, its marginal distributions are normal, linear transformations of multivariate normals are also multivariate normal, and so on. Let
![]()
denote an N × 1 random vector. The mean of X is
![]()
The covariance matrix of X is
![]()
The random vector X is called to be multivariate normal if its density function is
We assume that the nonnegetive definite matrix R is nonsingular. Since the integral of the density function is unit, this leads to
![]()
The quadratic form
![]()
is a weighted norm called Mahalanobis distance from x to m.
Characteristic Function
The characteristic function of X is the multidimensional Fourier transform of the density
![]()
By some manipulation [123], we have
3.25 ![]()
The characteristic function itself is a multivariate normal function of the frequency variable ![]() .
.
Linear Transforms
Let Y be a linear transformation of a multivariate normal random variable:
![]()
The characteristic function of Y is
![]()
Thus, Y is also a multivariate normal random variable with a new mean vector and new variance matrix
![]()
if the matrix ATRA is nonsingular.
Diagonalizing Transforms
The correlation matrix is symmetric and nonnegative definite. In other words, R ≥ 0. Therefore, there exists an orthogonal matrix U such that
![]()
The vector Y = UTX is distributed as
![]()
The random variables Y1, Y2, …, YN are uncorrelated since
![]()
In fact, Yn are independent normal random variables with mean UTm and variances ![]() :
:
This transformation Y = UTX is called a Karhunen-Loeve or Hotelling transform. It simply diagonalizes the covariance matrix
![]()
Such a transform can be implemented in MATLAB, using a function called eig or svd.
Quadratic Forms in MVN Random Variables
Linear functions of MVN random vectors remain MVN. In GLRT, quadratic forms of MVNs are involved. The natural question is what about quadratic forms of MVNs? In some important cases, the quadratic forms have a χ2 distributions. Let X denote an ![]() random variable. The distribution
random variable. The distribution
![]()
is ![]() distributed. The characteristic function of Q is
distributed. The characteristic function of Q is

which is the characteristic function of a chi-squared distribution with N degrees of freedom, denoted ![]() . The density function for Q is the inverse Fourier transform
. The density function for Q is the inverse Fourier transform
![]()
The mean and variance of Q are obtained from the characteristic function
![]()
Sometimes we encounter more general quadratic forms in the symmetric matrix P:
![]()
The mean and variance of Q are
![]()
The characteristic function of Q is

If PR is symmetric: PR = RP, the characteristic function is

where λn are eigenvalues of PR. This is the characteristic function of a ![]() random variable iff
random variable iff
![]()
If R = I, meaning X consists of indepedent components, then the quadratic form Q is ![]() iff P is idempotent:
iff P is idempotent:
![]()
Such a matrix is called a projection matrix. We have the following result: if X is ![]() and P is a rank r projection, the linear transformation Y = PX is
and P is a rank r projection, the linear transformation Y = PX is ![]() , and the quadratic form YTY = XTPX is
, and the quadratic form YTY = XTPX is ![]() . More generally, if X is
. More generally, if X is ![]() , R = UΛ2UT,
, R = UΛ2UT, ![]() and P is chosen to be
and P is chosen to be ![]() with
with ![]() , then
, then ![]() and the quadratic form YTY is
and the quadratic form YTY is ![]() .
.
Let Q = (X − m)TR−1(X − m) where X is ![]() . Equivalently,
. Equivalently,

is a quadratic form in the i.i.d. ![]() random variables X1, X2, ···, XN. We have shown that Q is
random variables X1, X2, ···, XN. We have shown that Q is ![]() . Form the random variable
. Form the random variable
![]()
The new random variable V asymptotically has mean 0 and variance 1, that is, asymptotically ![]() .
.
The Matrix Normal Distribution
Let X(n × N) be a matrix whose rows ![]() , are independently distributed as
, are independently distributed as ![]() . Then X has the matrix normal distribution and represents a random matrix observation from
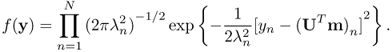
. Then X has the matrix normal distribution and represents a random matrix observation from ![]() . Using (3.24), we find that the density function of X is [110]
. Using (3.24), we find that the density function of X is [110]

where 1 is a column vector having the number 1 as its elements.
Transformation of Normal Data Matrices
We often encounter random vectors. Let
![]()
be a random sample from ![]() [110]. We call
[110]. We call

a data matrix from ![]() or simply a “normal data matrix.” This matrix is a basic building block in spectrum sensing. We must understand it thoroughly. In practice, we deal with data with high dimensionality. We use this notion as our basic information elements in data processing.
or simply a “normal data matrix.” This matrix is a basic building block in spectrum sensing. We must understand it thoroughly. In practice, we deal with data with high dimensionality. We use this notion as our basic information elements in data processing.
Consider linear functions
![]()
where A(m × n) and B(p × q) are fixed matrices of real numbers. The most important linear function is the sample mean
![]()
where A = n−11T and B = Ip.
Under the conditions of Theorem 3.3, ![]() is independent of HX, and thus is independent of S = n−1XTHX.
is independent of HX, and thus is independent of S = n−1XTHX.
The Wishart Distribution
We often encounter the form XTCX where C is a symmetric matrix. This is a matrix-valued quadratic function. The most important special case is the sample covariance matrix obtained by putting C = n−1H, where H is the centering matrix. These quadratic forms often lead to the Wishart distribution, which is a matrix generalization of the univariate chi-squared distribution, and has many similar properties.
If M(p × p) is
![]()
where X(m × p) is a data matrix from ![]() , then M is said to have a Wishart distribution with scale matrix
, then M is said to have a Wishart distribution with scale matrix ![]() and degrees of freedom parameter m. We write
and degrees of freedom parameter m. We write
![]()
When ![]() the distribution is said to be in standard form.
the distribution is said to be in standard form.
When p = 1, the W1(σ2, m) distribution is given by xTx, where the elements of x(m × 1) are i.i.d. ![]() variables; that is the W1(σ2, m) distribution is the same as the
variables; that is the W1(σ2, m) distribution is the same as the ![]() distribution.
distribution.
The scale matrix ![]() plays the same role in the Wishart distribution as σ2 does in the
plays the same role in the Wishart distribution as σ2 does in the ![]() distribution. We shall usually assume
distribution. We shall usually assume
![]()
![]()
The diagonal submatrices of M themselves have a Wishart distribution. Also,
![]()
If M ~ Wp(I, m) and B(p × q) satisfies BTB = Iq, then
![]()
![]()
Also, we have ![]()
![]()
![]()
![]()
![]()
The Hotelling T2 Distribution
[110, p. 73] Let us study the functions such as dTM−1d, where d is normal, M is Wishart, and d and M are independent. For example, d may be the sample mean, and d proportional to the sample covariance matrix. Hotelling (1931) initiated the work to derive the general distribution of quadratic forms.
If α is used to represent mdTM−1d where d and M are independently distributed as ![]() and Wp(I, m), respectively, then we say that α has the Hotelling T2 distribution with parameters p and m. We write α ~ T2(p, m).
and Wp(I, m), respectively, then we say that α has the Hotelling T2 distribution with parameters p and m. We write α ~ T2(p, m).
![]()
If ![]() and S are the mean vector and covariance matrix of a sample of size n from
and S are the mean vector and covariance matrix of a sample of size n from ![]() and Su = (n/(n − 1))S, then
and Su = (n/(n − 1))S, then
![]()
The T2 statistic is invariant under any nonsingular linear transformation x → Ax + b. ![]() where B(·, ·) is a beta variable.
where B(·, ·) is a beta variable.
Wilks' Lambda Distribution
![]()
If ![]() and
and ![]() are independent and if m ≥ p, we say that
are independent and if m ≥ p, we say that
![]()
has a Wilks' lambda distribution with parameters p, m, n.
The Λ family of distributions occurs frequently in the context of likelihood ratio test. The parameter p is dimension. The parameter m represents the “error” degrees of freedom and n the “hypothesis” degrees of freedom. Thus m + n represents the “total” degrees of freedom. Like the T2 statistic, Wilks' lambda distribution is invariant under changes of the scale parameters of A and B.
![]()
![]()
If ![]() is independent of
is independent of ![]() where m ≥ p. Then, the largest eigenvalue θ of (A + B)−1B is called the greatest root statistic and its distribution is denoted θ(p, m, n).
where m ≥ p. Then, the largest eigenvalue θ of (A + B)−1B is called the greatest root statistic and its distribution is denoted θ(p, m, n).
If λ is an eigenvalue of A−1B, then ![]() is an eigenvalue of (A + B)−1B. Since this is a monotone function of λ, θ is given by
is an eigenvalue of (A + B)−1B. Since this is a monotone function of λ, θ is given by
![]()
where λ1 is the largest eigenvalue of A−1B. Since λ1 > 0, we see that 0 ≤ θ ≤ 1.
For multisample hypotheses, we see [110, p. 138].
Geometric Ideas
The multivariate normal distribution in N dimensions has constant density on ellipses or ellipsoids of the form
where c is a constant. These ellipsoids are called the contour of the distribution or the ellipsoids of equal concentration. For ![]() , these contours are centered at x = 0, and when
, these contours are centered at x = 0, and when ![]() the contours are circles or in higher dimensions spheres or hyperspheres.
the contours are circles or in higher dimensions spheres or hyperspheres.
The principal component transformation facilitates interpretation of the ellipsoids of equal concentration. Using the spectral decomposition
![]()
where ![]() is the matrix of eigenvalues of
is the matrix of eigenvalues of ![]() , and
, and ![]() is an orthogonal matrix whose columns are the corresponding eigenvectors. As in Section 3.3.1, define the principal component transform by
is an orthogonal matrix whose columns are the corresponding eigenvectors. As in Section 3.3.1, define the principal component transform by
![]()
In terms of y, (3.26) becomes

so that the components of y represents axes of the ellipsoid.
In the GLRT, the following difference between two ellipsoids is encountered
where d is a constant. When the actual covariance matrices ![]() and
and ![]() are perfectly known, the problem is fine. Technical difficulty arises from the fact that sample covariance matrices
are perfectly known, the problem is fine. Technical difficulty arises from the fact that sample covariance matrices ![]() and
and ![]() are used in replacement of
are used in replacement of ![]() and
and ![]() . The fundamental problem is to guarantee that (3.27) has a geometric meaning; in other words, this implies
. The fundamental problem is to guarantee that (3.27) has a geometric meaning; in other words, this implies
As in Section A.3, the trace function, TrA = ∑iaii, satisfies the following properties [110] for matrices A, B, C, D, X and scalar α:
3.29 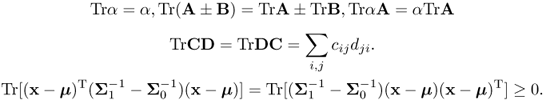
Using the fact that for A, B ≥ 0, we have
![]()
we have the necessary condition (for (3.28) to be valid)
since
3.31 ![]()
The necessary condition (3.30) is easily satisfied when the actual covariance matrices ![]() and
and ![]() are known. When, in practice, the sample covariance matrices
are known. When, in practice, the sample covariance matrices ![]() and
and ![]()
are known, instead, the problem arises
3.32 ![]()
This leads to a natural problem of sample covariance matrix estimation and the related GLRT. The fundamental problem is that the GLRT requires the exact probability distribution functions for two alternative hypotheses. This condition is rarely met in practice. Another problem is intuition that the random vectors fit the exact probability distribution function. In fact, the empirical probability distribution function does not satisfy this condition. This problem is more obvious when we deal with high data dimensionality such as N = 105, 106 which are commonly feasible in real-world spectrum sensing problems. For example, N = 100, 000 corresponding to 4.65 milliseconds sampling time.
3.6 Sample Covariance Matrix Estimation and Matrix Compressed Sensing
Fundamental Fact: The noise lies in a high-dimensional space; the signal, on the contrast, lies in a much lower-dimensional space.
If a random matrix A has i.i.d column Ai, then
![]()
where A* is the adjoint matrix of A. We often study A through the n × n symmetric, positive semidefinite matrix, the matrix A*A; in other words
![]()
The absolute matrix is defined as
![]()
A matrix C is positive semidefinite,
![]()
if and only all its eigenvalues λi are nonnegative
![]()
The eigenvalues of |A| are therefore nonnegative real numbers or
![]()
An immediate application of random matrices is the fundamental problem of estimating covariance matrices of high-dimensional distributions [107]. The analysis of the row-independent models can be interpreted as a study of sample covariance matrices.
There are deep results in random matrix theory. The main motivation of this subsection is to exploit the existing results in this field to better guide the estimate of covariance matrices, using nonasymptotic results [107].
We focus on a general model of random matrices, where we only assume independence of the rows rather than all entries. Such matrices are naturally generated by high-dimensional distributions. Indeed, given an arbitrary probability distribution in ![]() , one takes a sample of N independent points and arranges them as the rows of an N × n matrix A. Recall that n is the dimension of the probability space.
, one takes a sample of N independent points and arranges them as the rows of an N × n matrix A. Recall that n is the dimension of the probability space.
Let X be a random vector in ![]() . For simplicity we assume that X is centered, or
. For simplicity we assume that X is centered, or ![]() . Here
. Here ![]() denotes the expectation of X. The covariance matrix of X is the n × n matrix
denotes the expectation of X. The covariance matrix of X is the n × n matrix
![]()
The simplest way to estimate ![]() is to take some N independent samples Xi from the distribution and form the sample covariance matrix
is to take some N independent samples Xi from the distribution and form the sample covariance matrix

By the law of large numbers,
![]()
almost surely as N → ∞. So, taking sufficiently many samples we are guaranteed to estimate the covariance matrix as well as we want. This, however, does not address the quantitative aspect: what is the minimal sample size N that guarantees approximation with a given accuracy?
The relation of this question to random matrix theory becomes clear when we arrange the samples
![]()
as rows of the N × n random matrix A. Then, the sample covariance matrix is expressed as
![]()
Note that A is a matrix with independent rows but usually not independent entries. The reference of [107] has worked out the analysis of such matrices, separately for sub-Gaussian and general distributions.
We often encounter covariance matrix estimation for sub-Gaussian distribution due to the presence of Gaussian noise. Consider a sub-Gaussian distribution in ![]() with covariance matrix
with covariance matrix ![]() , and let
, and let ![]() ∈ (0, 1), t ≥ 1. Then with probability of at least
∈ (0, 1), t ≥ 1. Then with probability of at least
![]()
one has
3.33 ![]()
Here C depends only on the sub-Gaussian norm of a random vector taken from this distribution; the spectral norm of A is denoted as ||A||, which is equal to the maximum singular value of A, that is,
![]()
Covariance matrix estimation for arbitrary distribution is also encountered when a general noise interference model is used. Consider a sub-Gaussian distribution in ![]() with covariance matrix
with covariance matrix ![]() and supported in some centered Euclidean ball whose radius we denote
and supported in some centered Euclidean ball whose radius we denote ![]() . Let
. Let ![]() ∈ (0, 1) and t ≥ 1. Then, with probability at least
∈ (0, 1) and t ≥ 1. Then, with probability at least ![]() , one has
, one has
Here C is an absolute constant and log denotes the natural logarithm. In (3.34), typically
![]()
Thus the required sample size is
![]()
Low rank estimation is often used, since the distribution of a signal in ![]() lies close to a low-dimensional subspace. In this case, a much smaller sample size suffices for covariance estimation. The intrinsic dimension of the distribution can be measured with the effective rank of the matrix
lies close to a low-dimensional subspace. In this case, a much smaller sample size suffices for covariance estimation. The intrinsic dimension of the distribution can be measured with the effective rank of the matrix ![]() , defined as
, defined as
3.35 ![]()
where ![]() denotes the trace of
denotes the trace of ![]() . One always has
. One always has
![]()
and this bound is sharp. The effective rank
![]()
always controls the typical norm of X, as
![]()
Most of the distribution is supported in a ball of radius ![]() , where
, where
![]()
The conclusion of (3.34) holds with sample size
![]()
Summarizing the above discussion, (3.34) shows that the sample size
![]()
suffices to approximate the covariance matrix of a sub-Gaussian distribution in ![]() by the sample covariance matrix. While for arbitrary distribution,
by the sample covariance matrix. While for arbitrary distribution,
![]()
is sufficient. For distributions that are approximately low-dimensional, such as that of a signal, a much smaller sample size is sufficient. Namely, if the effective rank of ![]() equals r, then a sufficient size is
equals r, then a sufficient size is
![]()
As in Section 3.3.1, our standard problem (3.15) is
![]()
where Rs and Rw are, respectively, covariance matrices of signal and noise. When the sample covariance matrices are used in replacement of actual covariance matrices, it follows that
3.36 ![]()
We must exploit the fundamental fact that ![]() requires only O(rlogn) samples, while
requires only O(rlogn) samples, while ![]() requires O(n). Here the effective rank r of Rs is small. For one real sinusoid signal, the rank is only two, that is, r = 2. We can sum up the K sample covariance matrices
requires O(n). Here the effective rank r of Rs is small. For one real sinusoid signal, the rank is only two, that is, r = 2. We can sum up the K sample covariance matrices ![]() , for example, K = 200. Let us consider the three-step algorithm:
, for example, K = 200. Let us consider the three-step algorithm:
3.37 ![]()
3.38 ![]()
3.39 ![]()
In Step 3, the signal part coherently adds up and the noise part randomly adds up. This step enhances SNR, which is especially relevant at low SNR signal detection. This basic idea will be behind the chapter on quantum detection.
Another underlying idea is to develop a nonasymptotic theory for signal detection. Given a finite number of (complex) data samples collected into a random vector ![]() , the vector length n is very large, but not infinity, in other words, n < ∞. We cannot simply resort to the central limit theorem to argue that the probability distribution function of this vector x is Gaussian since this theorem requires n → ∞.
, the vector length n is very large, but not infinity, in other words, n < ∞. We cannot simply resort to the central limit theorem to argue that the probability distribution function of this vector x is Gaussian since this theorem requires n → ∞.
The recent work on compressed sensing is highly relevant to this problem. Given n, we can develop a theory that is valid with an overwhelming probability. As a result, one cornerstone of our development here is compressed sensing to recover the “information” from n data points x. Another cornerstone is the concentration of measure to study sums of random matrices. For example what are the statistics of the resultant random matrix ![]() ?
?
This problem is closely related to classical multivariate analysis [110, p. 108]. Section 3.6.1 will show that the sum of the random matrices is the ML estimation of the actual covariance matrix.
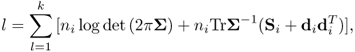
3.6.1 The Maximum Likelihood Estimation
The problem of Section 3.6.1 is closely related to classical multivariate analysis [110, p. 108]. Given k independent data matrices
![]()
where the rows of Xi(n × p) are i.i.d.
![]()
what is the ML estimation of the sample covariance matrix?
In practice, the most common constraints are
![]()
or
![]()
If (b) holds, we can treat all the data matrices as constituting one matrix sample from a single population (distribution).
Suppose that x1, …, xn is a random vector sample from a population (distribution) with the pdf ![]() , where
, where ![]() is a parameter vector. The likelihood function of the whole sample is
is a parameter vector. The likelihood function of the whole sample is

Given a matrix sample X, both ![]() and
and ![]() are considered as functions of the vector parameter
are considered as functions of the vector parameter ![]() .
.
Suppose x1, …, xn is a random sample from ![]() . We have
. We have

and
Let us simplify these equations. When the identity

is summed over the index i = 1, …, n, the final term on the right-hand side vanishes, giving
Since each term ![]() is a scalar, it equals the trace of itself. Thus using
is a scalar, it equals the trace of itself. Thus using
![]()
we have
Summing (3.42) over index i and substituting in (3.41) gives
Writing
![]()
and using (3.40) in (3.43), we have
For the special case ![]() and
and ![]() then (3.44) becomes
then (3.44) becomes
3.45 ![]()
To calculate the ML estimation if (a) holds, from (3.44), we have
where Si is the covariance matrix of the i-th matrix sample, i = 1, .., k, and ![]() Since there is no restriction on the population means, the ML estimation of
Since there is no restriction on the population means, the ML estimation of ![]() is
is ![]() . Setting
. Setting

(3.46) becomes

Differentiating (3.47) with respect to ![]() and equating to zero yields
and equating to zero yields
3.48 
which is the ML estimation of ![]() under the conditions stated.
under the conditions stated.
3.6.2 Likelihood Ratio Test (Wilks' Λ Test) for Multisample Hypotheses
Consider k independent normal matrix samples X1, …, Xk, whose likelihood is considered in Section 3.6.1.
![]()
In Section 3.6.1, the ML estimation under ![]() is
is ![]() and S, since the observation can be viewed under
and S, since the observation can be viewed under ![]() as constituting a single random matrix sample. The ML estimation of
as constituting a single random matrix sample. The ML estimation of ![]() under the alternative hypothesis
under the alternative hypothesis ![]() is
is ![]() , the i-th sample mean, and the ML estimation of the common sample covariance matrix is n−1W, where, following (3.47), we have
, the i-th sample mean, and the ML estimation of the common sample covariance matrix is n−1W, where, following (3.47), we have

is the “within-groups” sum of squares and products (SSP) matrix and ![]() Using (3.46), the LRT is given by
Using (3.46), the LRT is given by
Here
![]()
is the “total” SSP matrix, derived by regarding all the data matrices as if they constituted a single matrix sample. In contrast, the matrix W is the “within-group” SSP and

may be regarded as the “between-groups” SSP matrix. Thus, from (3.49), we have
![]()
The matrix W−1B is an obvious generalization of the univariate variance ratio. It will tend to zero if ![]() is true.
is true.
If n ≥ p + k, under ![]() ,
,
where Wilks' Λ statistics is described in Section 3.5.
Let us derive the statistics of (3.50). Write the k matrix samples as a single data matrix

where Xi(ni × p) is the i-th matrix sample, i = 1, …, k. Let 1i be the n-vector with 1 in the places corresponding to the i-th sample and 0 elsewhere, and set Ii = diag(1i). Then I = ∑Ii, and 1 = ∑1i. Let
![]()
be the centering matrix for the i-th matrix sample. The sample covariance matrix can be expressed as
![]()
Set
![]()
We can easily verify that
![]()
Further, C1 and C2 are idempotent matrices of rank n − k and k − 1, respectively, and C1C2 = 0.
Under ![]() , H is data matrix from
, H is data matrix from ![]() Thus by Theorem 3.7 and Theorem 3.8, we have
Thus by Theorem 3.7 and Theorem 3.8, we have
![]()
and, furthermore, W and B are independent. Therefore, (3.50) is derived.
3.7 Likelihood Ratio Test
3.7.1 General Gaussian Detection and Estimator-Correlator Structure
The most general signal assumption is to allow the signal to be composed of a deterministic component and a random component. The signal then can be modeled as a random process with the deterministic part corresponding to a nonzero mean and the random part corresponding to a zero mean random processes with a given signal covarance matrix. For generality the noise covariance matrix can be assumed to be arbitrary. These assumptions lead to the general Gaussian detection problem [118, 167], which mathematically is written as
![]()
Define the column vector
3.51 ![]()
and similarly for x and w. In vector and matrix form
![]()
where ![]() , and
, and ![]() , and x and w are independent. The LRT decides
, and x and w are independent. The LRT decides ![]() if
if
![]()
where
Taking the logarithm, retaining only the data-dependent terms, and scaling produces the test statistic
From the matrix inverse lemma [114, p. 43] [118, 167]
for ![]() , (3.52) is rewritten as
, (3.52) is rewritten as
![]()
where ![]()
is the MMSE estimator of x. This is a prewhitener followed by an estimator-correlator.
Using the properties of the trace operation (see Section A.3)
where α is a constant, we have

where the matrix yy* is of size N × N and of rank one. We can easily choose T0 > 0, since T(y) > 0 that will be obvious later. Therefore, (3.55) can be rewritten as
Let A ≥ 0 and B ≥ 0 be of the same size. Then [112, 329] (see Section A.6.2)
With the help of (3.57), on one hand, (3.56) becomes
![]()
Or,
if
Using (3.57), on the other hand, (3.55) becomes
3.60 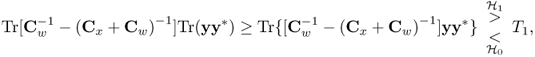

if
3.62 ![]()
(which is identical to (3.59)) whose necessary condition to be valid is:
due to the following fact: If A ≤ B for A ≥ 0 and B ≥ 0, then (see Section A.6.2)
Note that A−1 + B−1 ≠ (B + A)−1.
Starting from (3.53), we have

with
where (3.54) is used in the second step and, in the third step, we use the following [114, p. 43]
![]()
Let A > 0 and B > 0 be of the same size. Then [114, p. 181]
where λmax(A) is the largest eigenvalue of A. Due to the facts A > 0 and B > 0 given in (3.66), with the help of (3.65) and (3.67), (3.61) becomes

Combining (3.65) and (3.67) yields
Using (3.69), (3.58) turns out to be
![]()
since
![]()
Here |a| is the absolutue value of a. The necessary condition of (3.63) is satisfied even if the covariance matrix of the signal Cx is extremely small, compared with that of the noise Cw. This is critical to the practical problem at hand: sensing of an extremely weak signal in the spectrum of interest. At first sight, the necessary condition of (3.63) seems be trivial to achieve; this intuition, however, is false. At extremely low SNR, this condition is too strong to be satisfied. The lack of sufficient samples to estimate the covariance matrices Cw and Cx is the root of the technical difficulty. Fortunately, the signal covariance matrix Cx lies in the space of lower rank than that of the noise covariance matrix Cw. This fundamental difference in their ranks is the departure point for most of developments in Chapter 4.
(3.68) is expressed in a form that is convenient in practice. Only the traces of these covariance matrices are needed! The traces are, of course, positive scalar real values, which, in general, are random variables. The necessary condition for (3.68) to be valid is (3.63) Cw < Cx + Cw.
3.7.1.1 Divergence
Let y:![]() [0, Cy] denote an N × 1 normal random vector with mean zero and covariance matric Cy. The problem considered here is the test:
[0, Cy] denote an N × 1 normal random vector with mean zero and covariance matric Cy. The problem considered here is the test:
![]()
In particular, we have C0 = Cw and C1 = Cw + Cx. Divergence [123] is a coarse measure of how the log likelihood distinguishes between ![]() and
and ![]() :
:
![]()
where
![]()
The matrix Q can be rewritten as

The log likelihood ratio can be rewritten as
![]()
The transformed vector z is distributed as ![]() [0, Cz], with Cz = I for
[0, Cz], with Cz = I for ![]() and Cz = S for
and Cz = S for ![]() . S is called the signal-to-noise-ratio matrix.
. S is called the signal-to-noise-ratio matrix.
3.7.1.2 Orthogonal Decomposition
The matrix S has an orthogonal decomposition
![]()
where Λ is a diagonal matrix with diagonal elements λi and U satisfies UTU = I. This implies that ![]() solves the generalized eigenvalue problem
solves the generalized eigenvalue problem
![]()
With this representation for S, the log likelihood ratio may be expressed as
![]()
where the random vector y has covariance matrix ![]() under
under ![]() and I under
and I under ![]() :
:
![]()
3.7.1.3 Rank Reduction
A reduced-rank version of the log likelihood ratio is
![]()
where Ir and ![]() are reduced-rank versions of I and
are reduced-rank versions of I and ![]() that retain r nonzero terms and N − r zero terms.
that retain r nonzero terms and N − r zero terms.
This rank reduction is fine, whenever the discarded eigenvalues λi are unity (noise components). The problem is that nonunity eigenvalues are sometimes discarded with much penalty. We introduce a new criterion, divergence, a coarse measure of how the log likelihood distinguishes between ![]() and
and ![]()

We emphasize that it is the sum of ![]() , not
, not ![]() , that determines the contribution of an eigenvalue. It will lead to penalty when we discard the small eigenvalues. At extremely low SNR, the eigenvalues are almost uniformly distributed, it is difficult to do reduced-rank processing. The trace sum of S and S−1 must be considered as a whole. Obviously, we require that
, that determines the contribution of an eigenvalue. It will lead to penalty when we discard the small eigenvalues. At extremely low SNR, the eigenvalues are almost uniformly distributed, it is difficult to do reduced-rank processing. The trace sum of S and S−1 must be considered as a whole. Obviously, we require that
![]()
since
![]()
where A, B are Hermitian matrices. The matrix inequality condition ![]() implies
implies
![]()
or,
![]()
The rank r divergence is identical to the full-rank divergence when N − r of the eigenvalues in the original diagonal matrix ![]() are unity. To illustrate, consider the case
are unity. To illustrate, consider the case

The difference between C1 and C0 is

Assuming ![]() , then rank(R1 − R0) = rank(L) and a rank(L) detector has the same divergence as a full-rank detector.
, then rank(R1 − R0) = rank(L) and a rank(L) detector has the same divergence as a full-rank detector.
![]()
![]()
![]()
![]()
![]()
3.7.2 Tests with Repeated Observations
Consider a binary hypothesis problem [124] with a sequence of independent distributed random vectors ![]() If
If
![]()
denotes the likelihood radio function of a single observation, an LRT for this problem takes the form

where τ(K) denotes a threshold that may depend on the number of observations, K. Taking the logarithms on both sides of (3.70), and denoting Zk = ln(Λ(yk)), we find that

When τ(K) tends to a constant as K → ∞, ![]()
Taking the logarithm, retaining only the data-dependent terms, and scaling produces the test statistic (setting μx for brevity)

Using the following fact
3.72 
(3.71) becomes
3.73 
If the following sufficient condition for the LRT for repeated observations is satisfied
implying (see Section A.6.2)
![]()
using (3.57), we have
3.75 
Or,
3.76 
The covariance matrix of y is defined as
![]()
The asymptotic case of K → ∞ is
since the sample covariance matrix converges to the true covariance matrix, that is

To guarantee (3.74), the following stronger condition is enough
3.78 ![]()
due to (3.64).
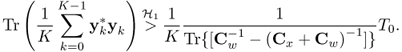
3.7.2.1 Case 1. Diagonal Covariance Matrix on  : Equal Variances
When x[n] is a complex Gaussian random process with zero mean and covariance matrix Cx and w[n] is complex white Gaussian noise (CWGN) with variance matrix ![]() . The probability distribution functions (PDFs) are given by
. The probability distribution functions (PDFs) are given by

where I is the identity matrix of N × N, and TrI = N.
The log-likelihood ratio is
![]()
Consider the following special case:
![]()
and
![]()
The LRT of (3.79) becomes
Using the matrix inverse lemma
![]()
we have
3.80 
when the signal is very weak, or ![]() . TrCy is the total power (variation) of the received signal plus noise. Note yk are vectors of length N.
. TrCy is the total power (variation) of the received signal plus noise. Note yk are vectors of length N.
Consider the single observation case, K = 1, we have

which is the energy detector. Intuitively, if the signal is present, the energy of the received data increases. In fact, the equivalent test statistic ![]() can be regarded as an estimator of the variance. Comparing this to a threshold recognizes that the variance under
can be regarded as an estimator of the variance. Comparing this to a threshold recognizes that the variance under ![]() is
is ![]() but under
but under ![]() is
is ![]()
3.7.2.2 Case 2. Correlated Signal
Now assume N = 2 and
![]()
where ρ is the correlation coefficient between x[0] and x[1].
![]()
where
![]()
where
![]()
If A > 0, then

Obviously, Cw + Cx > 0. From (3.77), we have
3.81 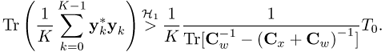
3.7.3 Detection Using Sample Covariance Matrices
If we know the covariance matrices perfectly, we have
![]()
In practice, estimated covariance matrices such as sample covariance matrices must be used:
![]()
where A0 and A1 are sample covariance matrices for the noise while B is the sample covariance matrix for the signal. The eigenvalues λi of
![]()
where A is positive semidefinite and B positive definite, satisfy
![]()
Let A be positive definite and B symmetric such that det (A + B) ≠ 0, then
![]()
The inequality, known as Olkin's inequality, is strict if and only if B is nonsingular.
Wilks' lambda test [110, p. 335]

where λj are the eigenvalues of A−1B.
The equicorrelation matrix is [112, p. 241]
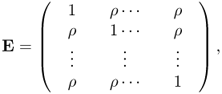
or,
![]()
where ρ is any real number and J is a unit matrix Jp = 11T, 1 = (1, …, 1)T. Then eii = 1, eij = ρ, for i ≠ j. For statistical purposes this matrix is most useful for − (p − 1)−1 < ρ < 1. Direct verification shows that, if ρ ≠ 1, − (p − 1)−1, then E−1 exists and is given by
![]()
Its determinant is given by
![]()
Since J has rank 1 with eigenvalues p and corresponding eigenvector 1, we see that the equicorrelation matrix E = (1 − ρ)I + ρJ has eigenvalues:
![]()
and the same eigenvectors as J. logdet A is bounded:
![]()
where A and A + B are positive definite, with equality if and only if B = 0. If A ≥ 0 and B ≥ 0, then [112, 329]
![]()
3.7.4 GLRT for Multiple Random Vectors
The data is modeled as a complex Gaussian random vector ![]() with probability density function
with probability density function
![]()
mean ![]() , and covariance matrix Rxx. Consider M independent, identically distributed (i.i.d.) random vectors
, and covariance matrix Rxx. Consider M independent, identically distributed (i.i.d.) random vectors
![]()
drawn from this distribution. The joint probability density function of these vectors is written as

where Sxx is the sample covariance matrix

and mx is the sample mean vector

Our task is to test whether Rxx has structure 0 or the alternative structure 1:
![]()
The GLRT statistic is

The actual covariance matrices are not known, they are replaced with their ML estimates computed using the M random vectors. If we denote by ![]() the ML estimate of Rxx under
the ML estimate of Rxx under ![]() and by
and by ![]() the ML estimate of Rxx under
the ML estimate of Rxx under ![]() , we have
, we have
![]()
If we assume further that ![]() is the set of positive definite matrices (no special restrictions are imposed), then
is the set of positive definite matrices (no special restrictions are imposed), then ![]() , and
, and
![]()
The generalized likelihood ratio for testing whether Rxx has structure ![]() is
is
![]()
where a and g are the arithmetic and geometric means of the eigenvalues of ![]() :
:

Based on the desirable probability of false alarm or probability of detection, we can choose a threshold l0. So if l > l0, we accept hypothesis ![]() , and if l < l0, we reject it. Consider a special case
, and if l < l0, we reject it. Consider a special case
![]()
where ![]() is the variance of each component of x. The ML estimate of Rxx under
is the variance of each component of x. The ML estimate of Rxx under ![]() is
is ![]() , where the variance is estimated as
, where the variance is estimated as ![]() . Therefore, the GLRT is
. Therefore, the GLRT is
![]()
This test is invariant under scale and unitary transformation.
3.7.5 Linear Discrimination Functions
Two random vectors can be stochastically ordered by using their likelihood ratio. Here, we take our liberty in freely borrowing materials from [123]. Linear discrimination may be used to approximate a quadratic likelihood ratio when testing y:![]() (0, Ci) under hypothesis
(0, Ci) under hypothesis ![]() i. The Neyman-Pearson test of
i. The Neyman-Pearson test of ![]() versus
versus ![]() will have us compare the log likelihood ratio to a threshold:
will have us compare the log likelihood ratio to a threshold:

We hope, on the average, L(y) will be larger than η under ![]() and smaller than η under
and smaller than η under ![]() . An incomplete measure of how the test of
. An incomplete measure of how the test of ![]() versus
versus ![]() will perform is the difference in terms of L(y) under two hypotheses:
will perform is the difference in terms of L(y) under two hypotheses:
![]()
This function is the J-divergence between ![]() versus
versus ![]() introduced previously in Section 3.7.1. It is related to information that a random sample can bring about the hypothesis
introduced previously in Section 3.7.1. It is related to information that a random sample can bring about the hypothesis ![]() i. The J-divergence for the multivariate normal problem
i. The J-divergence for the multivariate normal problem ![]() i:y:N(0, Ci) is computed by carrying out the expectations:
i:y:N(0, Ci) is computed by carrying out the expectations:

This expression does not completely characterize the performance of a likelihood ratio statistic, but it does bring useful information about the “distance” between ![]() and
and ![]() .
.
3.7.5.1 Linear Discrimination
Assume that the data y is used to form the linear discriminant function (or statistic)
![]()
This statistic is distributed as ![]() under
under ![]() i. If a log likelihood ratio is formed using the new variable z, then the divergence between
i. If a log likelihood ratio is formed using the new variable z, then the divergence between ![]() versus
versus ![]() is
is
![]()
Let us define the following ratio of quadratic forms
![]()
Then we may rewrite the divergence as
![]()
It is remarkable to note that the choice of the discriminant w that maximizes divergence is also the choice of w that maximizes a function of a quadratic form. The maximization of quadratic forms is formulated as a generalized eigenvalue problem [123, p. 163]. Let us rewrite divergence as
![]()
The function of J is convex in λ. It achieves its maximum either at λmax or at λmin, where λmax and λmin, respectively, are maximum and minimum values of
![]()
The divergence is maximized as follows:
![]()
The linear discriminant function is either the maximum eigenvector of ![]() or the minimum eigenvector of
or the minimum eigenvector of ![]() , depending on the nature of the maximum and minimum values. It is not always the maximum eigenvector. The choice of w = wmax or w = wmin is also called a principal component analysis (PCA). Without loss of generality, w may be normalized as w*w = 1. Then, if R0 = I, the linear discriminant function is distributed as follows
, depending on the nature of the maximum and minimum values. It is not always the maximum eigenvector. The choice of w = wmax or w = wmin is also called a principal component analysis (PCA). Without loss of generality, w may be normalized as w*w = 1. Then, if R0 = I, the linear discriminant function is distributed as follows
![]()
3.7.6 Detection of Correlated Structure for Complex Random Vectors
For the assessment of multivariate association between two complex random vectors x and y, our treatment here draws materials from [125, 126]. Consider two real zero-mean vectors ![]() and
and ![]() with two correlation matrices
with two correlation matrices
![]()
We assume both correlation matrices are invertible. The cross-correlation properties between x and y are described by the cross-correlation matrix
![]()
but this matrix is generally difficult to explain. In order to illuminate the underlying structure, many correlation analysis techniques transform x and y into p-dimensional internal representation
![]()
with p = min{m, n}. The full rank matrices A, B are chosen such that all partial sums over the absolute values of the correlations
![]()
are maximized
The solution to the maximization problem (3.82) leads to a diagonal cross-correlation matrix between ![]() and
and ![]()
3.83 ![]()
with
![]()
In order to summarize the correlation between x and y, an overall correlation coefficient ρ is defined as a function of the diagonal correlations {ki}. This correlation coefficient shares the invariance of the {ki}. Because of the maximization (3.82), the assessment of correlation is allowed in a lower-dimensional subspace of rank
![]()
There is a variety of possible correlation coefficients that can be defined based on the first r canonical correlations ![]() for a given rank r.
for a given rank r.

For r = p, these coefficients can be expressed in terms of the original correlation matrices

where
![]()
These coefficients share the invariance of the canonical correlations, that is, they are invariant under a nonsingular linear transformation of x and y. For jointly Gaussian x and y, ![]() determines the mutual information between x and y
determines the mutual information between x and y
![]()
The complex version of correlation analysis is discussed in [125, 126].
1 This is true, if we know the true covariance matrices, rather than the sample covariance matrices.