
Chapter 8: OpenTelemetry Collector
So, now that we've learned how to use OpenTelemetry to generate traces, metrics, and logs, we want to do something with all this telemetry data. To make the most of this data, we will need to be able to store and visualize it because, let's be honest – reading telemetry data from the console isn't going to cut it. As we'll discuss in Chapter 10, Configuring Backends, many destinations can be used for telemetry data. To send telemetry to a backend, the telemetry pipeline for metrics, traces, and logs needs to be configured to use an exporter that's specific to that signal and the backend. For example, if you wanted to send traces to Zipkin, metrics to Prometheus, and logs to Elasticsearch, each would need to be configured in the appropriate application code. Configuring this across dozens of services written in different languages adds to the complexity of managing the code. But now, imagine deciding that one of the backends must be changed because it no longer suits the needs of your business. Although it may not seem like a lot of work on a small scale, in a distributed system with applications that have been produced over many years by various engineers, the amount of effort to update, test, and deploy all that code could be quite significant, not to mention risky.
Wouldn't it be great if there were a way to configure an exporter once, and then use only configuration files to modify the destination of the data? There is – it's called OpenTelemetry Collector and this is what we'll be exploring in this chapter.
In this chapter, we will cover the following topics:
- The purpose of OpenTelemetry Collector
- Understanding the components of OpenTelemetry Collector
- Transporting telemetry via OTLP
- Using OpenTelemetry Collector
Let's start by ensuring we have all the tools in place to work with the collector.
Technical requirements
This chapter will introduce OpenTelemetry Collector as a standalone binary, which can be downloaded from https://github.com/open-telemetry/opentelemetry-collector-releases/releases/tag/v0.43.0. It's also possible to build the collector from the source, but this will not be covered in this chapter. The following commands will download the binary that's been compiled for macOS on Intel processors, extract the otelcol file, and ensure the binary can be executed:
$ wget -O otelcol.tar.gz https://github.com/open-telemetry/opentelemetry-collector-releases/releases/download/v0.43.0/otelcol_0.43.0_darwin_amd64.tar.gz
$ tar -xzf otelcol.tar.gz otelcol
$ chmod +x ./otelcol
$ ./otelcol --version
otelcol version 0.43.0
With the correct binary downloaded, let's ensure that the collector can start by using the following command. It is expected that the process will exit:
$ ./otelcol
Error: failed to get config: invalid configuration: no enabled receivers specified in config
2022/02/13 11:52:47 collector server run finished with error: failed to get config: invalid configuration: no enabled receivers specified in config
Important Note
The OpenTelemetry Collector project produces a different binary for various operating systems (Windows, Linux, and macOS) and architectures. You must download the correct one for your environment.
The configuration for the collector is written in YAML format (https://en.wikipedia.org/wiki/YAML), but we'll try to steer clear of most of the traps of YAML by providing complete configuration examples. The collector is written in Go, so this chapter includes code snippets in Go. Each piece of code will be thoroughly explained, but don't worry if the details of the language escape you – the concept of the code is what we'll be focusing on. To send data to OpenTelemetry Collector from Python applications, we'll need to install the OTLP exporter, which can be done via pip:
$ pip install opentelemetry-exporter-otlp
opentelemetry-propagator-b3
opentelemetry-instrumentation-wsgi
flask
requests
Important Note
The opentelemetry-exporter-otlp package itself does not contain any exporter code. It uses dependencies to pull in a different package for each different encoding and transport option that's supported by OTLP We will discuss these later in this chapter.
The completed code and configuration for this chapter is available in this book's GitHub repository in the chapter08 directory:
$ git clone https://github.com/PacktPublishing/Cloud-Native-Observability
$ cd Cloud-Native-Observability/chapter08
As with the previous chapters, the code in these examples builds on top of the previous chapters. If you'd like to follow along with the code changes, copy the code from the chapter06 folder. Now, let's dive in and figure out what this collector is all about, and why you should care about it.
The purpose of OpenTelemetry Collector
In essence, OpenTelemetry Collector is a process that receives telemetry in various formats, processes it, and then exports it to one or more destinations. The collector acts as a broker between the source of the telemetry, applications, or nodes, for example, and the backend that will ultimately store the data for analysis. The following diagram shows where the collector would be deployed in an environment containing various components:

Figure 8.1 – Architecture diagram of an environment with a collector
Deploying a component such as OpenTelemetry Collector is not free as it requires additional resources to be spent on running, operating, and monitoring it. The following are some reasons why deploying a collector may be helpful:
- You can decouple the source of the telemetry data from its destination. This means that developers can configure a single destination for the telemetry data in application code and allow the operators of the collector to determine where that data will go as needed, without having to modify the existing code.
- You can provide a single destination for many data types. The collector can be configured to receive traces, metrics, and logs in many different formats, such as OTLP Jaeger, Zipkin, Prometheus, StatsD, and many more.
- You can reduce latency when sending data to a backend. This mitigates unexpected side effects from occurring when an event causes a backend to be unresponsive. A collector deployment can also be horizontally scaled to increase capacity as required.
- You can modify telemetry data to address compliance and security concerns. Data can be filtered by the collector via processors based on the criteria defined in the configuration. Doing so can stop data leakage and prevent information that shouldn't be included in the telemetry data from ever being stored in a backend.
We will discuss deployment scenarios for the collector in Chapter 9, Deploying the Collector. For now, let's focus on the architecture and components that provide the functionality of the collector.
Understanding the components of OpenTelemetry Collector
The collector allows users to configure pipelines for each signal separately by combining any number of receivers, processors, and exporters as shown in the following diagram. This gives the collector a lot of flexibility in how and where it can be used:

Figure 8.2 – Dataflow through the collector
The initial implementation of the collector was a fork of the OpenCensus Service (https://opencensus.io/service/), which served a similar purpose in the OpenCensus ecosystem. The collector supports many open protocols out of the box for inputs and outputs, which we'll explore in more detail as we take a closer look at each component. Each component in the collector implements the Component interface, which is fairly minimal, as shown in the following code:
type Component interface {
Start(ctx context.Context, host Host) error
Shutdown(ctx context.Context) error
}
This interface makes it easy for implementors to add additional components to the collector, making it very extensible. Let's look at each component in more detail.
Receivers
The first component in a pipeline is the receiver, a component that receives data in various supported formats and converts this data into an internal data format within the collector. Typically, a receiver registers a listener that exposes a port in the collector for the protocols it supports. For example, the Jaeger receiver supports the following protocols:
- Thrift Binary on port 6832
- Thrift Compact on port 6831
- Thrift HTTP on port 14268
- gRPC on port 14250
Important Note
Default port values can be overridden via configuration, as we'll see later in this chapter.
It's possible to enable multiple protocols for the same receiver so that each of the protocols listed previously will listen on different ports by default. The following table shows the supported receiver formats for each signal type:

Figure 8.3 – Receiver formats per signal
Note that all the receivers shown here are receivers that support data in a specific format. However, an exception is the host metrics receiver, which will be discussed later in this chapter. Receivers can be reused across multiple pipelines and it's possible to configure multiple receivers for the same pipeline. The following configuration example enables the OTLP gRPC receiver and the Jaeger Thrift Binary receiver. Then, it configures three separate pipelines named traces/otlp, traces/jaeger, and traces/both, which use those receivers:
receivers:
otlp:
protocols:
grpc:
jaeger:
protocols:
thrift_binary:
service:
pipelines:
traces/otlp:
receivers: [otlp]
traces/jaeger:
receivers: [jaeger]
traces/both:
receivers: [otlp, jaeger]
One scenario where it would be beneficial to create separate pipelines for different receivers is if additional processing needs to occur on the data from one pipeline but not the other. As with the component interface, the interface for receivers is kept minimal, as shown in the following code. The TracesReceiver, MetricsReceiver, and LogsReceiver receivers all embed the same Receiver interface, which embeds the Component interface we saw previously:
type Receiver interface {
Component
}
type TracesReceiver interface {
Receiver
}
The simplicity of the interface makes it easy to implement additional receivers as needed. As we mentioned previously, the main task of a receiver is to translate data that's being received into various formats, but what about the host metrics receiver?
Host metrics receiver
The host metrics receiver can be configured to collect metrics about the host running the collector. It can be configured to scrape metrics for the CPU, disk, memory, and various other system-level details. The following example shows how the hostmetrics receiver can be configured to scrape load, memory, and network information from a host every 10 seconds (10s):
receivers:
hostmetrics:
collection_interval: 10s
scrapers:
load:
memory:
network:
service:
pipelines:
metrics:
receivers: [hostmetrics]
The receiver supports additional configuration so that you can include or exclude specific devices or metrics. Configuring this receiver can help you monitor the performance of the host without running additional processes to do so. Once the telemetry data has been received through a receiver, it can be processed further via processors.
Processors
It can be beneficial to perform some additional tasks, such as filtering unwanted telemetry or injecting additional attributes, on the data before passing it to the exporter. This is the job of the processor. Unlike receivers and exporters, the capabilities of processors vary significantly from one processor to another. It's also worth noting that the order of the components in the configuration matters for processors, as the data is passed serially from one processor to another. In addition to embedding the component interface, the processor interface also embeds a consumer interface that matches the signal that's being processed, as shown in the following code snippet. The purpose of the consumer interface is to provide a function that consumes the signal, such as ConsumeMetrics. It also provides information about whether the processor will modify the data it processes via the MutatesData capability:
type Capabilities struct {
MutatesData bool
}
type baseConsumer interface {
Capabilities() Capabilities
}
type Metrics interface {
baseConsumer
ConsumeMetrics(ctx context.Context, md pdata.Metrics) error
}
type MetricsProcessor interface {
Processor
consumer.Metrics
}
The following example configures an attributes processor called attributes/add-key to insert an attribute with the example-key key and sets its value to first. The second attributes processor, attributes/update-key, updates the value of the example-key attribute to the second value. The traces pipeline is then configured to add the attribute and update its value:
processors:
attributes/add-key:
actions:
- key: example-key
action: insert
value: first
attributes/update-key:
actions:
- key: example-key
action: update
value: second
service:
pipelines:
traces:
processors: [attributes/add-key, attributes/update-key]
The output that's expected from this configuration is that all the spans that are emitted have an example-key attribute set to a value of second. Since the order of the processors matters, inverting the processors in the preceding example would set the value to first. The previous example is a bit silly since it doesn't make a lot of sense to configure multiple attributes processors in that manner, but it illustrates that ordering the processors matters. Let's see what a more realistic example may look like. The following configuration copies a value from one attribute with the old-key key into another one with the new-key key before deleting the old-key attribute:
processors:
attributes/copy-and-delete:
actions:
- key: new-key
action: upsert
from_attribute: old-key
- key: old-key
action: delete
service:
pipelines:
traces:
processors: [attributes/copy-and-delete]
A configuration like the previous one could be used to migrate values or consolidate data coming in from multiple systems, where different names are used to represent the same data. As we mentioned earlier, processors cover a range of functionality. The following table lists the current processors, as well as the signals they process:
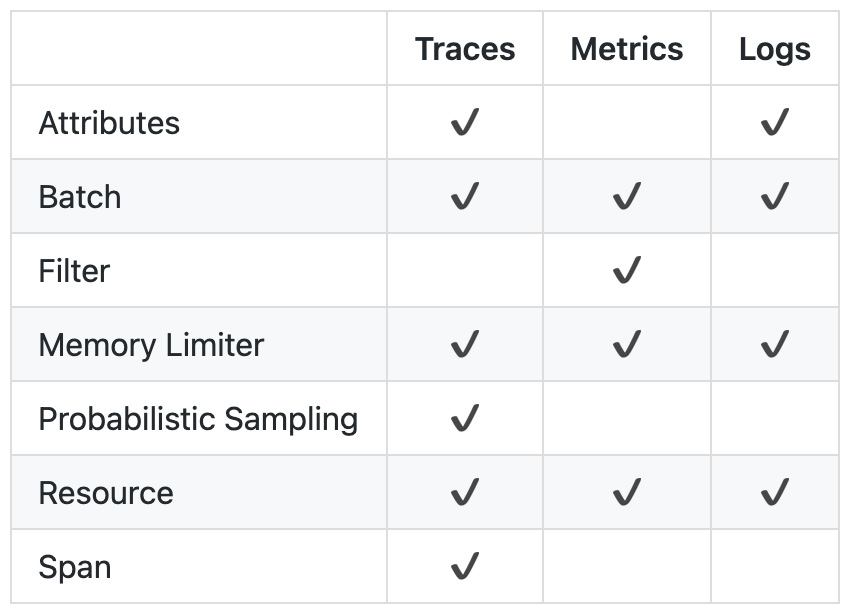
Figure 8.4 – Processors per signal
Some of these processors will be familiar to you if you've already used an OpenTelemetry SDK. It's worth taking a moment to explore these processors further.
Attributes processor
As we discussed earlier, the attributes processor can be used to modify telemetry data attributes. It supports the following operations:
- delete: This deletes an attribute for a specified key.
- extract: This uses a regular expression to extract values from the specified attribute and upsert new attributes resulting from that extraction.
- hash: This computes a SHA-1 hash of the value for an existing attribute and updates the value of that attribute to the computed hash.
- insert: This inserts an attribute for a specified key when it does not exist. It does nothing if the attribute exists.
- update: This updates an existing attribute with a specified value. It does nothing if the attribute does not exist.
- upsert: This combines the functionality of insert and update. If an attribute does not exist, it will insert it with the specified value; otherwise, it will update the attribute with the value.
The attributes processor, along with the span processor, which we'll see shortly, allows you to include or exclude spans based on match_type, which can either be an exact match configured as strict or a regular expression configured with regexp. The matching is applied to one or more of the configured fields: services, span_names, or attributes. The following example includes spans for the super-secret and secret services:
processors:
attributes/include-secret:
include:
match_type: strict
services: ["super-secret", "secret"]
actions:
- key: secret-attr
action: delete
The attributes processor can be quite useful when you're scrubbing personally identifiable information (PII) or other sensitive information. A common way sensitive information makes its way into telemetry data is via debug logs that capture private variables it shouldn't have, or by user information, passwords, or private keys being recorded in metadata. Data leaks often happen accidentally and are much more frequent than you'd think.
Important Note
It's possible to configure both an include and exclude rule at the same time. If that is the case, include is checked before exclude.
Filter processor
The filter processor allows you to include or exclude telemetry data based on the configured criteria. This processor, like the attributes and span processors, can be configured to match names with either strict or regexp matching. It's also possible to use an expression that matches attributes as well as names. Further scoping on the filter can be achieved by specifying resource_attributes. In terms of its implementation, at the time of writing, the filter processor only supports filtering for metrics, though additional signal support has been requested by the community.
Probabilistic sampling processor
Although sampling is a topic that we'll cover in more detail in Chapter 12, Sampling, it's important to know that the collector provides a sampling processor for traces known as the probabilistic sampling processor. It can be used to reduce the number of traces that are exported from the collector by specifying a sampling percentage, which determines what percentage of traces should be kept. The hash_seed parameter is used to determine how the collector should hash the trace IDs to determine which traces to process:
processors:
probabilistic_sampler:
sampling_percentage: 20
hash_seed: 12345
The hash_seed configuration parameter becomes especially important when multiple collectors are connected. For example, imagine that a collector (A) has been configured to send its data to another collector (B) before sending the data to a backend. With both A and B configured using the previous example, if 100 traces are sent through the two collectors, a total of 20 of those will be sent through to the backend. If, on the other hand, the two collectors use a different hash_seed, collector A will send 20 traces to collector B, and collector B will sample 20% of those, resulting in four traces being sent to the backend. Either case is valid, but it's important to understand the difference.
Important Note
The probabilistic sampling processor prioritizes the sampling priority attribute before the trace ID hashing if the attribute is present. This attribute is defined in the semantic conventions and was originally defined in OpenTracing. More information on this will be provided in Chapter 12, Sampling, but for now, it's just good to be aware of it.
Resource processor
The resource processor lets users modify attributes, just like the attributes processor. However, instead of updating attributes on individual spans, metrics, or logs, the resource processor updates the attributes of the resource associated with the telemetry data. The options that are available for configuring the resource processor are the same as for the attributes processor. This can be seen in the following example, which uses upsert for the deployment.environment attribute and renames the runtime attribute to container.runtime using the insert and delete actions:
processors:
resource:
attributes:
- key: deployment.environment
value: staging
action: upsert
- key: container.runtime
from_attribute: runtime
action: insert
- key: runtime
action: delete
Now, let's discuss the span processor.
Span processor
It may be useful to manipulate the names of spans or attributes of spans based on their names. This is the job of the span processor. It can extract attributes from a span and update its name based on those attributes. Alternatively, it can take the span's name and expand it to individual attributes associated with the span. The following example shows how to rename a span based on the messaging.system and messaging.operation attributes, which will be separated by the : character. The second configuration of the span processor shows how to extract the storeId and orderId attributes from the span's name:
processors:
span/rename:
name:
from_attributes: ["messaging.system", "messaging.operation"]
separator: ":"
span/create-attributes:
name:
to_attributes:
rules:
- ^/stores/(?P<storeId>.*)/.*$
- ^.*/orders/(?P<orderId>.*)/.*$
As we mentioned previously, the span processor also supports the include and exclude configurations to help you filter spans. Not all processors are used to modify the telemetry data; some change the behavior of the collector itself.
Batch processor
The batch processor helps you batch data to increase the efficiency of transmitting the data. It can be configured both to send batches based on batch size and a schedule. The following code configures a batch processor to send data every 10s or every 10000 records and limits the size of the batch to 11000 records:
processors:
batch:
timeout: 10s # default 200ms
send_batch_size: 10000 # default 8192
send_batch_max_size: 11000 # default 0 – no limit
It is recommended to configure a batch processor for all the pipelines to optimize the throughput of the collector.
Memory limiter processor
To ensure the collector is conscious of resource consumption, the memory limiter processor lets users control the amount of memory the collector consumes. This helps ensure the collector does as much as it can to avoid running out of memory. Limits can be specified either via fixed mebibyte values or percentages that are calculated based on the total available memory. If both are specified, the fixed values take precedence. The memory limiter enforces both soft and hard limits, with the difference defined by a spike limit configuration. It is recommended to use the ballast extension alongside the memory limiter. The ballast extension allows the collector to pre-allocate memory to improve the stability of the heap. The recommended size for the ballast is between one-third to one-half of the total memory for the collector. The following code configures the memory limiter to use up to 250 Mib of the memory configured via limit_mib, with 50 Mib as the difference between the soft and hard limits, which is configured via spike_limit_mib:
processors:
memory_limiter:
check_interval: 5s
limit_mib: 250
spike_limit_mib: 50
extensions:
memory_ballast:
size_mib: 125
The memory limiter processor, along with the batch processor, are both recommended if you wish to optimize the performance of the collector.
Important Note
When the processor exceeds soft limits, it returns errors and starts dropping data. If it exceeds hard limits, it will also force garbage collection to free memory.
The memory limiter should be the first processor you configure in the pipeline. This ensures that when the memory threshold is exceeded, the errors that are returned are propagated to the receivers. This allows the receivers to send appropriate error codes back to the client, who can then throttle the requests they are sending. Now that we understand how to process our telemetry data to fit our needs, let's learn how to use the collector to export all this data.
Exporters
The last component of the pipeline is the exporter. The role of the exporter in the collector pipeline is fairly similar to its role in the SDK, as we explored in previous chapters. The exporter takes the data in its internal collector format, marshals it into the output format, and sends it to one or more configured destinations. The interface for the exporter is very similar to the processor interface as it is also a consumer, separated again by a signal. The following code shows us the LogsExporter interface, which embeds the interfaces we explored earlier:
type LogsExporter interface {
Exporter
consumer.Logs
}
Multiple exporters of the same type can be configured for different destinations as necessary. It's also possible to configure multiple exporters for the same pipeline to output the data to multiple locations. The following code configures a jaeger exporter, which is used for exporting traces, and an otlp exporter, which will be used for both traces and metrics:
exporters:
jaeger:
endpoint: jaeger:14250
otlp:
endpoint: otelcol:4317
service:
pipelines:
traces:
exporters: [jaeger, otlp]
metrics:
exporters: [otlp]
Several other formats are supported by exporters. The following table lists the available exporters, as well as the signals that each supports:

Figure 8.5 – Exporters per signal
Note that in addition to exporting data across different signals to destinations that can be reached over a network, it's also possible to export telemetry data locally to the console via the logs exporter or as JSON to a file via the file exporter. Receivers, processors, and exporters cover the components in the pipeline, but there is yet more to cover about the collector.
Extensions
Although most of the functionality of the collector revolves around the telemetry pipelines, there is additional functionality that is made available via extensions. Extensions provide you with another way to extend the collector. The following extensions are currently available:
- ballast: This allows users to configure a memory ballast for the collector to improve the overall stability and performance of the collector.
- health_check: This makes an endpoint available for checking the health of the collector. This can be useful for service discovery or orchestration of the collector.
- pprof: This enables the Go performance profiler, which can be used to identify performance issues within the collector.
- zpages: This enables an endpoint in the collector that provides debugging information about the components in the collector.
Thus far, all the components we've explored are part of the core collector distribution and are built into the binary we'll be using in our examples later in this chapter. However, those are far from the only components that are available.
Additional components
As you can imagine, providing this much functionality in an application can become quite complex. To reduce the complexity of the collector's core functionality without impeding progress and enthusiasm in the community, the main collector repository contains components that are defined as part of the OpenTelemetry specification. With all the flexibility the collector provides, many individuals and organizations are contributing additional receivers, processors, and exporters. These can be found in the opentelemetry-collector-contrib repository at https://github.com/open-telemetry/opentelemetry-collector-contrib. As the code in this repository is changing rapidly, we won't be going over the components available there, but I strongly suggest browsing through the repository to get an idea of what is available.
Before learning how to use the collector and configuring an application to send data to it, it's important to understand a little bit more about the preferred protocol to receive and export data via the collector. This is known as OTLP.
Transporting telemetry via OTLP
We've mentioned OTLP multiple times in this chapter and this book, so let's look at what it is. To ensure that telemetry data is transmitted as efficiently and reliably as possible, OpenTelemetry has defined OTLP. The protocol itself is defined via protocol buffer (https://developers.google.com/protocol-buffers) definition files. This means that any client or server that's interested in sending or receiving OTLP only has to implement these definitions to support it. OTLP is the recommended protocol of OpenTelemetry for transmitting telemetry data and is supported as a core component of the collector.
Important Note
Protocol buffers or protobufs are a language and platform-agnostic mechanism for serializing data that was originally intended for gRPC. Libraries are provided to generate the code from the protobuf definition files in a variety of languages. This is a much deeper topic than we will have time for in this book, so if you're interested in reading the protocol files, I strongly recommended learning more about protocol buffers – they're pretty cool! The Google developer site that was linked previously is a great resource to get started.
The definition for OTLP (https://github.com/open-telemetry/opentelemetry-proto) is divided into multiple sections to cover the different signals. Each component of the protocol provides backward compatibility guaranteed via its maturity level, which allows adopters to get a sense of how often they should expect breaking changes. An alpha level makes no guarantees around breaking changes while a stable level guarantees backward-incompatible changes will be introduced no more frequently than every 12 months. The maturity level of each component is available in the project's README.md file and the current state, at the time of writing, can be seen in the following table. It's very likely to change by the time you're reading this as progress is being made quite rapidly!

Figure 8.6 – Maturity level of OTLP components
Taking a closer look at the preceding table (https://github.com/open-telemetry/opentelemetry-proto#maturity-level), note that it includes a different section for protobuf and JSON encoding. Let's talk about why that is.
Encodings and protocols
The specification defines the encodings and protocols that are supported by OTLP. Initially, the following three combinations are supported:
- protobufs over gRPC
- protobufs over HTTP
- JSON over HTTP
Depending on the requirements of your application or the infrastructure that will be used to deploy your code, certain restrictions may guide the decision of which encoding or protocol to choose. For example, users may be deploying applications in an environment that doesn't support gRPC. This was true for a long time with serverless Python environments in various cloud providers. Similarly, gRPC was not supported in the browser, meaning users of OpenTelemetry for JavaScript cannot use gRPC when instrumenting a browser application. Another tradeoff that may cause users to choose one package over another is the impact of serializing and deserializing data using JSON, which can have some serious performance implications in certain languages compared to using protobufs. The different combinations of encodings and protocols exist to provide additional flexibility for users, depending on the requirements of their environments.
One of the requirements for any OpenTelemetry language implementation is to support at least one of these formats before marking a signal as generally available. This ensures that users can use OTLP to export data across their entire system, from application instrumentation to the backend.
Additional design considerations
Backpressure can happen when clients are generating telemetry data faster than the recipients can receive it. To address this, the specification for OTLP also defines how clients should handle responses from servers to manage backpressure when receiving systems become overloaded. Another design goal of the protocol is to ensure it is load balancer-friendly so that you can horizontally scale various components that could be involved in handling telemetry data using OTLP. Equipped with this knowledge of the protocol, let's start sending data to the collector.
Using OpenTelemetry Collector
Now that we're familiar with the core components of OpenTelemetry Collector and OTLP, it's time to start using the collector with the grocery store. The following diagram gives us an idea of how telemetry data is currently configured and where we are trying to go with this chapter:

Figure 8.7 – Before and after diagrams of exporting telemetry data
At the beginning of this chapter, we installed the OTLP exporters for Python via the opentelemetry-exporter-otlp package. This, in turn, installed the packages that are available for each protocol and encoding:
- opentelemetry-exporter-otlp-proto-grpc
- opentelemetry-exporter-otlp-proto-http
- opentelemetry-exporter-otlp-json-http
The package that includes all the protocols and the encoding is a convenient way to start, but once you're familiar with the requirements for your environment, you'll want to choose a specific encoding and protocol to reduce dependencies.
Configuring the exporter
The following examples will leverage the otlp-proto-grpc package, which includes the exporter classes we'll use to export telemetry – OTLPSpanExporter, OTLPMetricExporter, and OTLPLogExporter. The code builds on the example applications from Chapter 6, Logging —Capturing Events, by updating the common.py module to use the OTLP exporters instead of the control exporters, which we've used so far:
common.py
from opentelemetry.exporter.otlp.proto.grpc.trace_exporter import OTLPSpanExporter
from opentelemetry.exporter.otlp.proto.grpc._metric_exporter import OTLPMetricExporter
from opentelemetry.exporter.otlp.proto.grpc._log_exporter import OTLPLogExporter
def configure_tracer(name, version):
...
exporter = OTLPSpanExporter()
...
def configure_meter(name, version):
...
exporter = OTLPMetricExporter()
...
def configure_logger(name, version):
...
exporter = OTLPLogExporter()
...
By default, as per the specification, the exporters will be configured to send data to a collector running on localhost:4317.
Configuring the collector
The following collector configuration sets up the otlp receiver, which will be used to receive telemetry data from our application. Additionally, it configures the logging exporter to output useful information to the console:
config/collector/config.yml
receivers:
otlp:
protocols:
grpc:
exporters:
logging:
service:
pipelines:
traces:
receivers: [otlp]
exporters: [logging]
metrics:
receivers: [otlp]
exporters: [logging]
logs:
receivers: [otlp]
exporters: [logging]
Important Note
In the following examples, each time config.yml is updated, the collector must be restarted for the changes to take effect.
It's time to see whether the collector and the application can communicate. First, start the collector using the following command from the terminal:
./otelcol --config ./config/collector/config.yml
If everything is going according to plan, the process should be up and running, and the output from it should list the components that have been loaded. It should also contain a message similar to the following:
collector output
2021-05-30T16:19:03.088-0700 info service/application.go:197 Everything is ready. Begin running and processing data.
Next, we need to run the application code in a separate terminal. First, launch the legacy inventory, followed by the grocery store, and then the shopper application. Note that legacy_inventory.py and grocery_store.py will remain running for the remainder of this chapter as we will not make any further changes to them:
python legacy_inventory.py
python grocery_store.py
python shopper.py
Pay close attention to the output from the terminal running the collector. You should see some output describing the traces, metrics, and logs that have been processed by the collector. The following code gives you an idea of what to look for:
collector output
2022-02-13T14:35:47.101-0800 INFO loggingexporter/logging_exporter.go:69 LogsExporter {"#logs": 1}
2022-02-13T14:35:47.110-0800 INFO loggingexporter/logging_exporter.go:40 TracesExporter {"#spans": 4}
2022-02-13T14:35:49.858-0800 INFO loggingexporter/logging_exporter.go:40 TracesExporter {"#spans": 1}
2022-02-13T14:35:50.533-0800 INFO loggingexporter/logging_exporter.go:40 TracesExporter {"#spans": 3}
2022-02-13T14:35:50.535-0800 INFO loggingexporter/logging_exporter.go:69 LogsExporter {"#logs": 2}
Excellent – let's do some more fun things with the collector by adding some processors to our configuration! If you look closely at the preceding output, you'll notice that TracesExporter is mentioned in three separate instances. Since each of our applications is sending telemetry data, the exporter is called with the new data. The batch processor can improve it's efficiency here by waiting a while and sending a single batch containing all the telemetry data simultaneously. The following code configures the batch processor with a timeout of 10 seconds (10s), so the processor will wait up until that time to send a batch. Then, we can add this processor to each pipeline:
config/collector/config.yml
processors:
batch:
timeout: 10s
...
pipelines:
traces:
receivers: [otlp]
processors: [batch]
exporters: [logging]
metrics:
receivers: [otlp]
processors: [batch]
exporters: [logging]
logs:
receivers: [otlp]
processors: [batch]
exporters: [logging]
Try running the shopper application once again. This time, the output from the collector should show a single line including the sum of all the spans we saw earlier:
collector output
2022-02-13T14:40:07.360-0800 INFO loggingexporter/logging_exporter.go:69 LogsExporter {"#logs": 2}
2022-02-13T14:40:07.360-0800 INFO loggingexporter/logging_exporter.go:40 TracesExporter {"#spans": 8}
If you run the shopper application a few times, you'll notice a 10-second delay in the collector outputting information about the telemetry data that's been generated. This is the batch processor at work. Let's make the logging output slightly more useful by updating the logging exporter configuration:
config/collector/config.yml
exporters:
logging:
loglevel: debug
Restarting the collector and running the shopper application again will output the full telemetry data that's been received. What should appear is a verbose list of all the telemetry data the collector is receiving. Look specifically for the span named add item to cart as we'll be modifying it in the next few examples:
collector output
Span #0
Trace ID : 1592a37b7513b73eaefabde700f4ae9b
Parent ID : 2411c263df768eb5
ID : 8e6f5cdb56d6448d
Name : HTTP GET
Kind : SPAN_KIND_SERVER
Start time : 2022-02-13 22:41:42.673298 +0000 UTC
End time : 2022-02-13 22:41:42.677336 +0000 UTC
Status code : STATUS_CODE_UNSET
Status message :
Attributes:
-> http.method: STRING(GET)
-> http.server_name: STRING(127.0.0.1)
-> http.scheme: STRING(http)
-> net.host.port: INT(5000)
-> http.host: STRING(localhost:5000)
-> http.target: STRING(/products)
-> net.peer.ip: STRING(127.0.0.1)
So far, our telemetry data is being emitted to a collector from three different applications. Now, we can see all the telemetry data on the terminal running the collector. Let's take this a step further and modify this telemetry data via some processors.
Modifying spans
One of the great features of the collector is its ability to operate on telemetry data from a central location. The following example demonstrates some of the power behind the processors. The following configuration uses two different processors to augment the span we mentioned previously. First, the attributes processor will add an attribute to identify a location attribute. Next, the span processor will use the attributes from the span to rename the span so that it includes the location, item, and quantity attributes. The new processors must also be added to the traces pipeline's processors array:
config/collector/config.yml
processors:
attributes/add-location:
actions:
- key: location
action: insert
value: europe
span/rename:
name:
from_attributes: [location, item, quantity]
separator: ":"
...
pipelines:
traces:
processors: [batch, attributes/add-location, span/rename]
Important Note
Remember that the order of the processors matters. In this case, the reverse order wouldn't work as the location attribute would not be populated.
Run the shopper and look at the output from the collector to see the effect of the new processors. The new exported span contains a location attribute with the europe value, which we configured. Its name has also been updated to location:item:quantity:
collector output
Span #1
Trace ID : 47dac26efa8de0ca1e202b6d64fd319c
Parent ID : ee10984575037d4a
ID : a4f42124645c4d3b
Name : europe:orange:5
Kind : SPAN_KIND_INTERNAL
Start time : 2022-02-13 22:44:57.072143 +0000 UTC
End time : 2022-02-13 22:44:57.07751 +0000 UTC Status code : STATUS_CODE_UNSET
Status message :
Attributes:
-> item: STRING(orange)
-> quantity: INT(5)
-> location: STRING(europe)
This isn't bad for 10 lines of configuration! The final example will explore the hostmetrics receiver and how to configure the filter processor for metrics.
Filtering metrics
So far, we've looked at how to modify spans, but what about metrics? As we discussed previously, the hostmetrics receiver captures metrics about the localhost. Let's see it in action. The following example configures the host metrics receiver to scrape memory and network information every 10 seconds:
config/collector/config.yml
receivers:
hostmetrics:
collection_intervals: 10s
scrapers:
memory:
network:
...
service:
pipelines:
metrics:
receivers: [otlp, hostmetrics]
After configuring this receiver, just restart the collector – you should see metrics in the collector output, without running shopper.py. The output will include memory and network metrics:
collector output
InstrumentationLibraryMetrics #0
InstrumentationLibrary
Metric #0
Descriptor:
-> Name: system.memory.usage
-> Description: Bytes of memory in use.
-> Unit: By
-> DataType: IntSum
-> IsMonotonic: false
-> AggregationTemporality: AGGREGATION_TEMPORALITY_CUMULATIVE
IntDataPoints #0
Data point labels:
-> state: used
StartTimestamp: 1970-01-01 00:00:00 +0000 UTC
Timestamp: 2022-02-13 22:48:16.999087 +0000 UTC
Value: 10880851968
Metric #1
Descriptor:
-> Name: system.network.packets
-> Description: The number of packets transferred.
-> Unit: {packets}
-> DataType: IntSum
-> IsMonotonic: true
-> AggregationTemporality: AGGREGATION_TEMPORALITY_CUMULATIVE
IntDataPoints #0
Data point labels:
-> device: lo0
-> direction: transmit
StartTimestamp: 1970-01-01 00:00:00 +0000 UTC
Timestamp: 2022-02-13 22:48:16.999087 +0000 UTC
Value: 120456
Well done – the collector is now generating metrics for you! Depending on the type of system you're running the collector on, you may have many network interfaces available that are generating a lot of metrics. Let's update the configuration to scrape metrics for a single interface to reduce some of the noise. On my host, I will use lo0 as the interface:
config/collector/config.yml
receivers:
hostmetrics:
collection_intervals: 10s
scrapers:
memory:
network:
include:
match_type: strict
interfaces: [lo0]
Important Note
Network interface names vary based on the operating system being used. Some common interface names are lo0, eth0, en0, and wlan0. If you're unsure, look for the device label in the previous output, which should show you some of the interfaces that are available on your system.
The output will be significantly reduced, but there are still many network metrics to sift through. system.network.connections is quite noisy as it collects data points for each tcp state. Let's take this one step further and use the filter processor to exclude system.network.connections:
config/collector/config.yml
processors:
filter/network-connections:
metrics:
exclude:
match_type: strict
metric_names:
- system.network.connections
...
pipelines:
metrics:
receivers: [hostmetrics]
processors: [batch, filter/network-connections]
Restarting the collector one last time will yield a much easier-to-read output. Of course, there are many more scenarios to experiment with when it comes to the collector and its components, but this gives you a good idea of how to get started. I recommend spending some time experimenting with different configurations and processors to get comfortable with it. And with that, we now have an understanding of one of the most critical components of OpenTelemetry – the collector.
Summary
In this chapter, you learned about the fundamentals of OpenTelemetry Collector and its components. You now know what role receivers, processors, exporters, and extensions play in the collector and know about the specifics of individual processors.
Additionally, we looked at the definition of the OTLP, its benefits, and the design decisions behind creating the protocol. Equipped with this knowledge, we configured OpenTelemetry Collector for the first time and updated the grocery store to emit data to it. Using a variety of processors, we manipulated the data the collector was receiving to get a working understanding of how to harness the power of the collector.
The next chapter will expand on this knowledge and take the collector from a component that's used in development to a core component of your infrastructure. We'll explore how to deploy the collector in a variety of scenarios to make the most of it.