Chapter 6: Logging – Capturing Events
Metrics and traces go a long way in helping understand the behaviors and intricacies of cloud-native applications. Sometimes though, it's useful to log additional information that can be used at debug time. Logging gives us the ability to record information in a way that is perhaps more flexible and freeform than either tracing or metrics. That flexibility is both wonderful and terrible. It allows logs to be customized to fit whatever need arises using natural language, which often, but not always, makes it easier to interpret by the reader. But the flexibility is often abused, resulting in a mess of logs that are hard to search through and even harder to aggregate in any meaningful way. This chapter will take a look at how OpenTelemetry tackles the challenges of logging and how it can be used to improve the telemetry generated by an application. We will cover the following topics:
- Configuring OpenTelemetry to export logs
- Producing logs via the OpenTelemetry API and a standard logging library
- The logging signal in practice within the context of the grocery store application
Along the way, we will learn about standard logging in Python as well as logging with Flask, giving us a chance to use an instrumentation library as well. But first, let's ensure we have everything we need set up.
Technical requirements
If you've already completed Chapter 4, Distributed Tracing, or Chapter 5, Metrics - Recording Measurements, the setup here will be quite familiar. Ensure the version of Python in your environment is at least Python 3.6 by running the following commands:
$ python --version
$ python3 --version
This chapter will rely on the OpenTelemetry API and SDK packages that are installable via pip with the following command. The examples in this chapter are using the version 1.9.0 opentelemetry-api and opentelemetry-sdk packages:
$ pip install opentelemetry-api
opentelemetry-sdk
opentelemetry-propagator-b3
Important Note
The OpenTelemetry examples in this chapter rely on an experimental release of the logging signal for OpenTelemetry. This means it's possible that by the time you're reading this, the updated packages have moved methods to different packages. The release notes available for each release should help you identify where the packages have moved to (https://github.com/open-telemetry/opentelemetry-python/releases).
Additionally, in this chapter, we will use an instrumentation package made available by the OpenTelemetry Python community. This instrumentation will assist us when adding logging information to Flask applications that are part of the grocery store. Install the package via pip with the following command:
$ pip install opentelemetry-instrumentation-wsgi
The code for this chapter is available in the companion repository. The following uses git to copy the repository locally:
$ git clone https://github.com/PacktPublishing/Cloud-Native-Observability
The completed code for the examples in this chapter is available in the chapter06 directory. If you're interested in writing the code yourself, I suggest you start by copying the code in the chapter04 directory and following along.
Lastly, we will need to install the libraries that the grocery store relies on. This can be done via the following pip command:
$ pip install flask requests
We're now ready to start logging!
Configuring OpenTelemetry logging
Unlike with the two signals we covered in Chapter 4, Distributed Tracing, and Chapter 5, Metrics - Recording Measurements, the logging signal in OpenTelemetry does not concern itself with standardizing a logging interface. Many languages already have an established logging API, and a decision early on in OpenTelemetry was made to leverage those pre-existing tools. Although OpenTelemetry provides an API capable of producing logging, which we'll use shortly, the signal is intent on hooking into the existing logging facilities. Its focus is to augment the logs produced and provide a mechanism to correlate those logs with other signals. Figure 6.1 shows us the components of the logging pipeline:

Figure 6.1 – The logging pipeline
These components combine to produce log records and emit them to external systems. The logging pipeline is comprised of the following:
- A LogEmitterProvider, which provides a mechanism to instantiate one or more log emitters
- The LogEmitter, which produces LogRecord data
- The LogProcessor, which consumes log records and passes them on to a LogExporter for sending the data to a backend
First, as with all the other OpenTelemetry signals, we must configure the provider. The following code instantiates a LogEmitterProvider from the SDK, passes in a resource via the resource argument, and then sets the global log emitter via the set_log_emitter_provider method:
logs.py
from opentelemetry.sdk._logs import LogEmitterProvider, set_log_emitter_provider
from opentelemetry.sdk.resources import Resource
def configure_log_emitter_provider():
provider = LogEmitterProvider(resource=Resource.create())
set_log_emitter_provider(provider)
Configuring LogEmitter alone won't allow us to produce telemetry. We'll need a log processor and an exporter to go a step further. Let's add BatchLogProcessor, which, as the name suggests, batches the processing of log records. We will also use a ConsoleLogExporter to output logging information to the console:
logs.py
from opentelemetry.sdk._logs.export import ConsoleLogExporter, BatchLogProcessor
from opentelemetry.sdk._logs import LogEmitterProvider, set_log_emitter_provider
from opentelemetry.sdk.resources import Resource
def configure_log_emitter_provider():
provider = LogEmitterProvider(resource=Resource.create())
set_log_emitter_provider(provider)
exporter = ConsoleLogExporter()
provider.add_log_processor(BatchLogProcessor(exporter))
With OpenTelemetry configured, we're now ready to start instrumenting our logs.
Producing logs
Following the pattern from previous signals, we should be ready to get an instance of a log producer and start logging, right? Well, not quite – let's find out why.
Using LogEmitter
Using the same method that we used for metrics and tracing, we can now obtain LogEmitter, which will allow us to use the OpenTelemetry API to start producing logs. The following code shows us how to accomplish this using the get_log_emitter method:
logs.py
from opentelemetry.sdk._logs import (
LogEmitterProvider,
get_log_emitter_provider,
set_log_emitter_provider,
)
if __name__ == "__main__":
configure_log_emitter_provider()
log_emitter = get_log_emitter_provider().get_log_emitter(
"shopper",
"0.1.2",
)
With LogEmitter in hand, we're now ready to generate LogRecord. The LogRecord contains the following information:
- timestamp: A time associated with the log record in nanoseconds.
- trace_id: A hex-encoded identifier of the trace to correlate with the log record. There will be more on this, the span identifier, and trace flags shortly.
- span_id: A hex-encoded identifier of the span to correlate with the log record.
- trace_flags: Trace flags associated with the trace active when the log record was produced.
- severity_text: A string representation of the severity level.
- severity_number: A numeric value of the severity level.
- body: The contents of the log message being recorded.
- resource: The resource associated with the producer of the log record.
- attributes: Additional information associated with the log record in the form of key-value pairs.
Each one of those fields can be passed as an argument to the constructor; note that all those fields are optional. The following creates LogRecord with some minimal information and calls emit to produce a log entry:
logs.py
import time
from opentelemetry.sdk._logs import (
LogEmitterProvider,
LogRecord,
get_log_emitter_provider,
set_log_emitter_provider,
)
if __name__ == "__main__":
configure_log_emitter_provider()
log_emitter = get_log_emitter_provider().get_log_emitter(
"shopper",
"0.1.2",
)
log_emitter.emit(
LogRecord(
timestamp=time.time_ns(),
body="first log line",
)
)
After all this work, we can finally see a log line! Run the code, and the output should look something like this:
output
{"body": "first log line", "name": null, "severity_number": "None", "severity_text": null, "attributes": null, "timestamp": 1630814115049294000, "trace_id": "", "span_id": "", "trace_flags": null, "resource": ""}
As you can see, there's a lot of information missing to give us a full picture of what was happening. One of the most important pieces of information associated with a log entry is the severity level. The OpenTelemetry specification defines 24 different log levels categorized in 6 severity groups, as shown in the following figure:

Figure 6.2 – Log severity levels defined by OpenTelemetry
When defining the severity level, all log levels above that number are reported.
Let's ensure the log record we generate sets a meaningful severity level:
logs.py
from opentelemetry.sdk._logs.severity import SeverityNumber
if __name__ == "__main__":
...
log_emitter.emit(
LogRecord(
timestamp=time.time_ns(),
body="first log line",
severity_number=SeverityNumber.INFO,
)
)
There – now at least readers of those logs should be able to know how important those log lines are. Run the code and look for the severity number in the output:
output
{"body": "first log line", "name": null, "severity_number": "<SeverityNumber.INFO: 9>", "severity_text": null, "attributes": null, "timestamp": 1630814944956950000, "trace_id": "", "span_id": "", "trace_flags": null, "resource": ""}
As mentioned earlier in this chapter, one of the goals of the OpenTelemetry logging signal is to remain interoperable with existing logging APIs. Looking at how much work we just did to get a log line with minimal information, it really seems like there should be a better way, and there is!
The standard logging library
What if we tried using the standard logging library available in Python to interact with OpenTelemetry instead? The logging library has been part of the standard Python library since version 2.3 and is used by many popular frameworks, such as Django and Flask.
Important Note
The standard logging module in Python is quite powerful and flexible. If you're not familiar with it, it may take some time to get used to it. I recommend reading the Python docs available on python.org here: https://docs.python.org/3/library/logging.html.
The Python implementation of the OpenTelemetry signal provides an additional component to use, OTLPHandler. The following figure shows where OTLPHandler fits in with the rest of the logging pipeline:

Figure 6.3 – OTLPHandler uses LogEmitter to produce logs
OTLPHandler extends the standard logging library's logging.Handler class and uses the configured LogEmitter to produce log records.
Important note:
The OTLPHandler was renamed LoggingHandler in releases of the opentelemetry-sdk package newer than 1.10.0. Be sure to update any references to it in the examples if you've installed a newer version.
The following code block first imports the logging module. Then, using the getLogger method, a standard Logger object is obtained. This is the object we will use anytime a log line is needed from the application. Finally, OTLPHandler is added to logger, and a warning message is logged:
logs.py
import logging
from opentelemetry.sdk._logs import (
LogEmitterProvider,
LogRecord,
OTLPHandler,
get_log_emitter_provider,
set_log_emitter_provider,
)
if __name__ == "__main__":
...
logger = logging.getLogger(__file__)
handler = OTLPHandler()
logger.addHandler(handler)
logger.warning("second log line")
Let's see how the information generated differs from the previous example; many of the fields are automatically filled in for us:
- The timestamp is set to the current time.
- The severity number and text are set based on the method used to record a log – in this case, the warning method sets the log severity to WARN.
- Trace and span information is set by pulling information from the current context. As our example does not include starting a trace, we should expect the values in these fields to be invalid.
- Resource data is set via the log emitter provider.
This provides us with a significant improvement in the data generated.
output
{"body": "second log line", "name": null, "severity_number": "<SeverityNumber.WARN: 13>", "severity_text": "WARNING", "attributes": {}, "timestamp": 1630810960785737984, "trace_id": "0x00000000000000000000000000000000", "span_id": "0x0000000000000000", "trace_flags": 0, "resource": "BoundedAttributes({'telemetry.sdk.language': 'python', 'telemetry.sdk.name': 'opentelemetry', 'telemetry.sdk.version': '1.9.0', 'service.name': 'unknown_service'}, maxlen=None"}
Not only does this output contain richer data, but we also didn't need to work nearly as hard to obtain it, and we used a standard library to generate the logs. The attributes field doesn't appear to contain anything useful yet – let's fix that. OTLPHandler creates the attribute dictionary by looking at any extra attributes defined in the standard LogRecord. The following code passes an extra argument at logging time:
logs.py
if __name__ == "__main__":
...
logger.warning("second log line", extra={"key1": "val1"})
As with other attribute dictionaries we may have encountered previously, they should contain information relevant to the specific event being logged. The output should now show us the additional attributes:
output
{"body": "second log line", "name": null, "severity_number": "<SeverityNumber.WARN: 13>", "severity_text": "WARNING", "attributes": {"key1": "val1"}, "timestamp": 1630946024854904064, "trace_id": "0x00000000000000000000000000000000", "span_id": "0x0000000000000000", "trace_flags": 0, "resource": "BoundedAttributes({'telemetry.sdk.language': 'python', 'telemetry.sdk.name': 'opentelemetry', 'telemetry.sdk.version': '1.9.0', 'service.name': 'unknown_service'}, maxlen=None"}
Let's produce one last example with the standard logger and update the previous code to record a log using the info method. This should give us the same severity as the example where we used the log emitter directly:
logs.py
import logging
if __name__ == "__main__":
...
logger.info("second log line")
Run the code again to see the result. If you're no longer seeing a log with the second log line as its body and are perplexed, don't worry – you're not alone. This is due to a feature of the standard logging library. The Python logging module creates a root logger, which is used anytime a more specific logger isn't configured. By default, the root logger is configured to only log messages with a severity of a warning or higher. Any logger instantiated via getLogger inherits that severity, which explains why our info level messages are not displayed. Our example can be fixed by calling setLevel for the logger we are using in our program:
logs.py
if __name__ == "__main__":
...
logger = logging.getLogger(__file__)
logger.setLevel(logging.DEBUG)
handler = OTLPHandler()
logger.addHandler(handler)
logger.info("second log line")
The output should now contain the log line as we expected:
output
{"body": "second log line", "name": null, "severity_number": "<SeverityNumber.INFO: 9>", "severity_text": "INFO", "attributes": {}, "timestamp": 1630857128712922112, "trace_id": "0x00000000000000000000000000000000", "span_id": "0x0000000000000000", "trace_flags": 0, "resource": "BoundedAttributes({'telemetry.sdk.language': 'python', 'telemetry.sdk.name': 'opentelemetry', 'telemetry.sdk.version': '1.9.0, 'service.name': 'unknown_service'}, maxlen=None)"}
An alternative way to configure the log level of the root logger is to use the basicConfig method of the logging module. This allows you to configure the severity level, formatting, and so on (https://docs.python.org/3/library/logging.html#logging.basicConfig). Another benefit of using the existing logging library means that with a little bit of additional configuration, any existing application should be able to leverage OpenTelemetry logging. Speaking of an existing application, let's return to the grocery store.
A logging signal in practice
Getting familiar with the logging signal theory is great; now it's time to put it into practice. Before using OpenTelemetry logging in the grocery store, let's take a minute to move the configuration code into the common.py module:
common.py
import logging
from opentelemetry.sdk._logs.export import ConsoleLogExporter, BatchLogProcessor
from opentelemetry.sdk._logs import (
LogEmitterProvider,
OTLPHandler,
set_log_emitter_provider,
)
def configure_logger(name, version):
provider = LogEmitterProvider(resource=Resource.create())
set_log_emitter_provider(provider)
exporter = ConsoleLogExporter()
provider.add_log_processor(BatchLogProcessor(exporter))
logger = logging.getLogger(name)
logger.setLevel(logging.DEBUG)
handler = OTLPHandler()
logger.addHandler(handler)
return logger
With the code in place, we can now obtain a logger in the same fashion as we obtained a tracer and a meter previously. The following code updates the shopper application to instantiate a logger via configure_logger. Additionally, let's update the add_item_to_cart method to use logger.info rather than print:
shopper.py
from common import configure_tracer, configure_meter, configure_logger
tracer = configure_tracer("shopper", "0.1.2")
meter = configure_meter("shopper", "0.1.2")
logger = configure_logger("shopper", "0.1.2")
@tracer.start_as_current_span("add item to cart")
def add_item_to_cart(item, quantity):
span = trace.get_current_span()
span.set_attributes(
{
"item": item,
"quantity": quantity,
}
)
logger.info("add {} to cart".format(item))
Use the following commands in separate terminals to launch the grocery store, the legacy inventory, and finally, the shopper applications:
$ python legacy_inventory.py
$ python grocery_store.py
$ python shopper.py
Pay special attention to output running from the previous command; it should include similar output, confirming that our configuration is correct:
output
{"body": "add orange to cart", "name": null, "severity_number": "<SeverityNumber.INFO: 9>", "severity_text": "INFO", "attributes": {}, "timestamp": 1630859469283874048, "trace_id": "0x67a8df13b8d5678912a8101bb5724fa4", "span_id": "0x0fc5e89573d7f794", "trace_flags": 1, "resource": "BoundedAttributes({'telemetry.sdk.language': 'python', 'telemetry.sdk.name': 'opentelemetry', 'telemetry.sdk.version': '1.9.0', 'service.name': 'unknown_service'}, maxlen=None)"}
This is a great starting point; let's see how we can correlate the information from this log line with the information from our traces.
Distributed tracing and logs
We saw earlier in this chapter that the LogRecord class contains fields for span and trace identifiers as well as trace flags. The intention behind this is to allow logs to be correlated with specific traces and spans, permitting the end user to gain a better understanding of what their application is doing when it's running in production. So often, the process of correlating telemetry involves searching tirelessly through events using a timestamp as a mechanism to match up different sources of information. This is not always practical for the following reasons:
- Many operations happen concurrently on the same system, making it difficult to know which operation caused the event.
- The difficulty caused by operations happening simultaneously is exacerbated in distributed systems as even more operations are occurring.
- The clocks across different systems may, and often do, drift. This drift causes timestamps to not match.
A mechanism developed to address this has been to produce a unique event identifier for each event and add this identifier to all logs recorded. One challenge of this is ensuring that this information is then propagated across the entire system; this is exactly what the trace identifier in OpenTelemetry does. As shown in Figure 6.4, the trace and span identifiers can pinpoint the specific operation that triggers a log to be recorded:
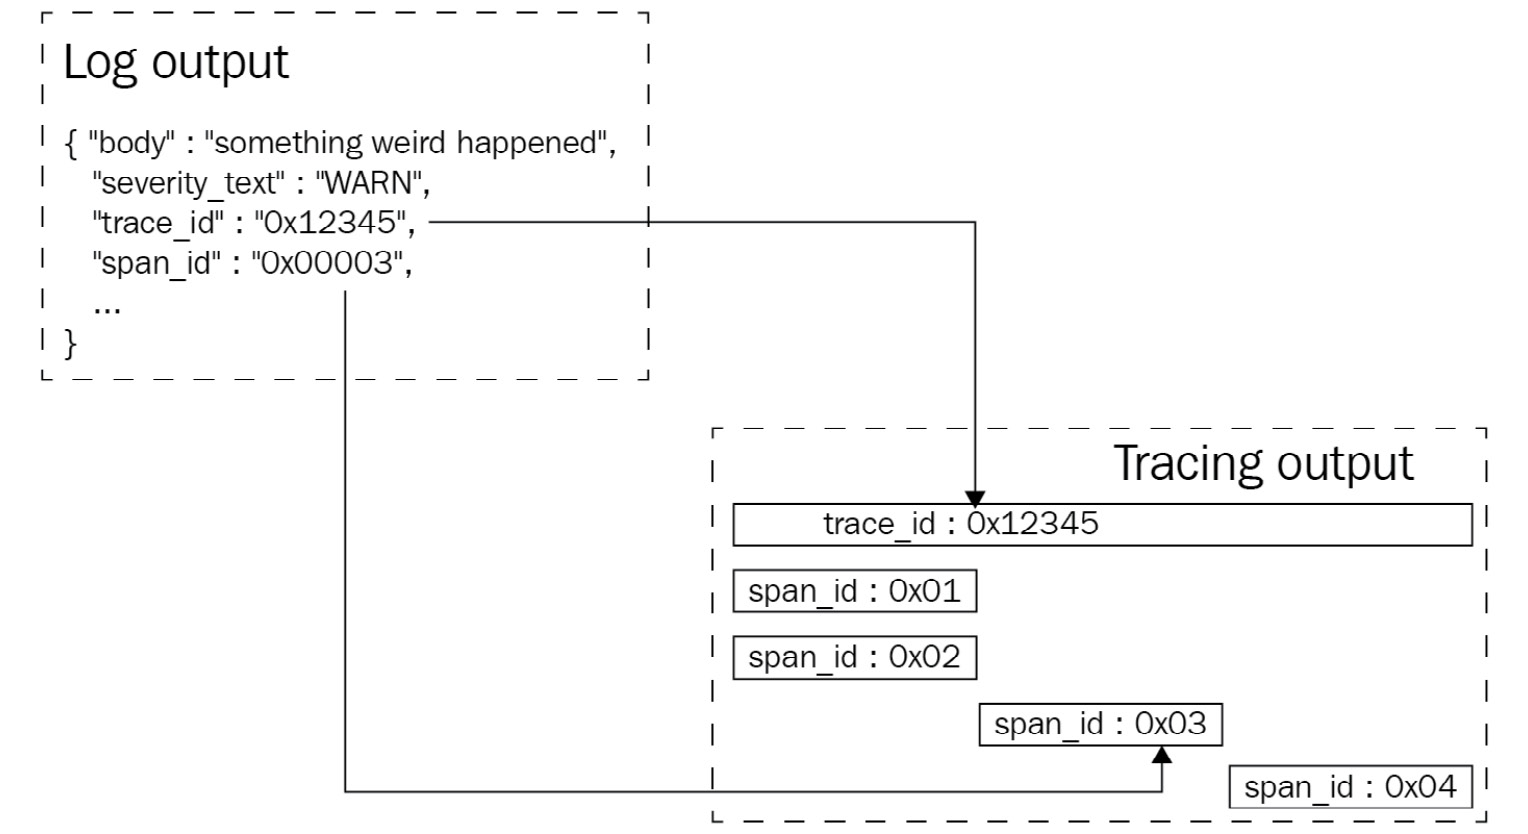
Figure 6.4 – Log and trace correlation
Returning to the output from the previous example, the following shows the logging output as well as a snippet of the tracing output containing the name of the operations and their identifiers. See whether you can determine from the output which operation triggered the log record:
output
{"body": "add orange to cart", "name": null, "severity_number": "<SeverityNumber.INFO: 9>", "severity_text": "INFO", "attributes": {}, "timestamp": 1630859469283874048, "trace_id": "0x67a8df13b8d5678912a8101bb5724fa4", "span_id": "0x0fc5e89573d7f794", "trace_flags": 1, "resource": "BoundedAttributes({'telemetry.sdk.language': 'python', 'telemetry.sdk.name': 'opentelemetry', 'telemetry.sdk.version': '1.9.0', 'service.name': 'unknown_service'}, maxlen=None)"}
{
"name": "web request",
"context": {
"trace_id": "0x67a8df13b8d5678912a8101bb5724fa4",
"span_id": "0x6e4e03cacd3411b5",
},
}
{
"name": "add item to cart",
"context": {
"trace_id": "0x67a8df13b8d5678912a8101bb5724fa4",
"span_id": "0x0fc5e89573d7f794",
},
}
{
"name": "browse",
"context": {
"trace_id": "0x67a8df13b8d5678912a8101bb5724fa4",
"span_id": "0x5a2262c9dd473b40",
},
}
{
"name": "visit store",
"context": {
"trace_id": "0x67a8df13b8d5678912a8101bb5724fa4",
"span_id": "0x504caee882574a9e",
},
}
If you've guessed that the log line was generated by the add item to cart operation, you've guessed correctly. Although this particular example is simple since you're already familiar with the code itself, you can imagine how valuable this information can be to troubleshoot an unfamiliar system. Equipped with the information provided by the distributed trace associated with the log record, you're empowered to jump into the source code and debug an issue faster. Let's see how we can use OpenTelemetry logging with the other applications in our system.
OpenTelemetry logging with Flask
As covered previously in the chapter, many frameworks, including Flask, use the standard logging library in Python. This makes configuring OpenTelemetry for the grocery store similar to how any changes to logging in Flask would be done. The following code imports and uses configure_logger to set up the logging pipeline. Next, we use the logging module's dictConfig method to add OTLPHandler to the root logger, and configure the severity level to DEBUG to ensure all our logs are output. In a production setting, you will likely want to make this option configurable rather than hardcode it to debug level to save costs:
grocery_store.py
from logging.config import dictConfig
from common import (
configure_meter,
configure_tracer,
configure_logger,
set_span_attributes_from_flask,
start_recording_memory_metrics,
)
tracer = configure_tracer("grocery-store", "0.1.2")
meter = configure_meter("grocery-store", "0.1.2")
logger = configure_logger("grocery-store", "0.1.2")
dictConfig(
{
"version": 1,
"handlers": {
"otlp": {
"class": "opentelemetry.sdk._logs.OTLPHandler",
}
},
"root": {"level": "DEBUG", "handlers": ["otlp"]},
}
)
app = Flask(__name__)
Ensure some requests are sent to the grocery store either by running shopper.py or via curl and see what the output from the server looks like now. The following output shows it before the change on the first line and after the change on the second line:
output
127.0.0.1 - - [05/Sep/2021 10:58:28] "GET /products HTTP/1.1" 200 -
{"body": "127.0.0.1 - - [05/Sep/2021 10:58:48] "GET /products HTTP/1.1" 200 -", "name": null, "severity_number": "<SeverityNumber.INFO: 9>", "severity_text": "INFO", "attributes": {}, "timestamp": 1630864728996940032, "trace_id": "0x00000000000000000000000000000000", "span_id": "0x0000000000000000", "trace_flags": 0, "resource": "BoundedAttributes({'telemetry.sdk.language': 'python', 'telemetry.sdk.name': 'opentelemetry', 'telemetry.sdk.version': '1.9.0', 'service.name': 'unknown_service'}, maxlen=None)"}
We can see the original message is now recorded as the body of the message, and all the additional information is also presented. Although, if we look closely, we can see that the span_id, trace_id, and trace_flags information is missing. It looks like the context for our request is lost somewhere along the way, so let's fix that. What is confusing about this is that we already have hooks defined to handle before_request and teardown_request, which, in theory, should ensure that the trace information is available. However, the log record we see is generated by Flask's built-in web server (wsgi), not the Flask application, and is triggered after the original request has been completed as far as Flask knows. We can address this by creating middleware ourselves, but thankfully, we don't have to.
Logging with WSGI middleware
The OpenTelemetry community publishes a package that provides support for instrumenting an application that uses a wsgi-compatible implementation, such as the built-in Flask server. The opentelemetry-instrumentation-wsgi package provides the middleware that hooks into the appropriate mechanisms to make trace information for the duration of the request. The following code imports the middleware and updates the Flask app to use it:
grocery_store.py
from opentelemetry.instrumentation.wsgi import OpenTelemetryMiddleware
...
app = Flask(__name__)
app.wsgi_app = OpenTelemetryMiddleware(app.wsgi_app)
With the middleware in place, a new request to our application should allow us to see the span_id, trace_id, and trace_flags components that we expect:
output
{"body": "127.0.0.1 - - [05/Sep/2021 11:39:36] "GET /products HTTP/1.1" 200 -", "name": null, "severity_number": "<SeverityNumber.INFO: 9>", "severity_text": "INFO", "attributes": {}, "timestamp": 1630867176948227072, "trace_id": "0xf999a4164ac2f20c20549f19abd4b434", "span_id": "0xed5d3071ece38633", "trace_flags": 1, "resource": "BoundedAttributes({'telemetry.sdk.language': 'python', 'telemetry.sdk.name': 'opentelemetry', 'telemetry.sdk.version': '1.9.0', 'service.name': 'unknown_service'}, maxlen=None)"}
We will look at how this works in more detail in Chapter 7, Instrumentation Libraries, and see how we can simplify the application code using instrumentation libraries. For the purpose of this example, it's enough to know that the middleware enables us to see the tracing information in the log we are recording.
Resource correlation
Another piece of data that OpenTelemetry logging uses when augmenting telemetry is the resource attribute. As you may remember from previous chapters, the resource describes the source of the telemetry. This will allow us to correlate events occurring across separate signals for the same resource. In Chapter 4, Distributed Tracing, we defined a LocalMachineResourceDetector class that produces an OpenTelemetry resource that includes information about the local machine. Let's update the code in configure_logger that instantiates the LogEmitterProvider to use this resource, rather than create an empty resource:
common.py
def configure_logger(name, version):
local_resource = LocalMachineResourceDetector().detect()
resource = local_resource.merge(
Resource.create(
{
ResourceAttributes.SERVICE_NAME: name,
ResourceAttributes.SERVICE_VERSION: version,
}
)
)
provider = LogEmitterProvider(resource=resource)
set_log_emitter_provider(provider)
...
With the change in place, run shopper.py once again to see that the log record now contains more meaningful data about the source of the log entry:
{"body": "add orange to cart", "name": null, "severity_number": "<SeverityNumber.INFO: 9>", "severity_text": "INFO", "attributes": {}, "timestamp": 1630949852869427968, "trace_id": "0x2ff0e5c9886f2672c3af4468483d341d", "span_id": "0x40d72ae565b4c19a", "trace_flags": 1, "resource": "BoundedAttributes({'telemetry.sdk.language': 'python', 'telemetry.sdk.name': 'opentelemetry', 'telemetry.sdk.version': '1.9.0', 'net.host.name': 'MacBook-Pro.local', 'net.host.ip': '127.0.0.1', 'service.name': 'shopper', 'service.version': '0.1.2'}, maxlen=None)"}
Looking at the previous output, we now know the name and version of the service. We also have valuable information about the machine that generated this information. In a distributed system, this information can be used in combination with metrics generated by the same resource to identify problems with a specific system, compute node, environment, or even region.
Summary
With the knowledge of this chapter ingrained in our minds, we have now covered the core signals that OpenTelemetry helps produce. Understanding how to produce telemetry by manually instrumenting code is a building block on the road to improving observability. Without telemetry, the job of understanding what a system is doing is much more difficult.
In this chapter, we learned about the purpose of the logging implementation in OpenTelemetry, as well as how it is intended to co-exist with existing logging implementations. After configuring the logging pipeline, we learned how to use the OpenTelemetry API to produce logs and compared doing so with using a standard logging API. Returning to the grocery store, we explored how logging can be correlated with traces and metrics. This allowed us to understand how we may be able to leverage OpenTelemetry logging within existing applications to improve our ability to use log statements when debugging applications.
Finally, we scratched the surface of how instrumentation libraries can help to make the production of telemetry easier. We will take an in-depth look at this in the next chapter, dedicated to simplifying the grocery store application by leveraging existing instrumentation libraries.