
G. Using the Visual Studio Debugger
Objectives
In this appendix you’ll learn:
![]() To set breakpoints to debug programs.
To set breakpoints to debug programs.
![]() To run a program through the debugger.
To run a program through the debugger.
![]() To set, disable and remove a breakpoint.
To set, disable and remove a breakpoint.
![]() To use the Continue command to continue execution.
To use the Continue command to continue execution.
![]() To use the Locals window to view and modify the values of variables.
To use the Locals window to view and modify the values of variables.
![]() To use the Watch window to evaluate expressions.
To use the Watch window to evaluate expressions.
![]() To use the Step Into, Step Out and Step Over commands to control execution.
To use the Step Into, Step Out and Step Over commands to control execution.
![]() To use the Autos window to view variables that are used in the surrounding statements.
To use the Autos window to view variables that are used in the surrounding statements.
And so shall I catch the fly.
—William Shakespeare
We are built to make mistakes, coded for error.
—Lewis Thomas
What we anticipate seldom occurs; what we least expect generally happens.
—Benjamin Disraeli
He can run but he can’t hide.
—Joe Louis
It is one thing to show a man that he is in error, and another to put him in possession of truth.
—John Locke
Outline
In Chapter 2, you learned that there are two types of errors—compilation errors and logic errors—and you learned how to eliminate compilation errors from your code. Logic errors (also called bugs) do not prevent a program from compiling successfully, but can cause the program to produce erroneous results when it runs. Most C++ compiler vendors provide software called a debugger, which allows you to monitor the execution of your programs to locate and remove logic errors. The debugger will be one of your most important program development tools. This appendix demonstrates key features of the Visual Studio debugger. The features shown here work the same way in both Visual Studio 2005 and Visual Studio 2008. Appendix H discusses the features and capabilities of the GNU C++ debugger. Our C++ Resource Center (www.deitel.com/cplusplus/) provides links to tutorials that can help you familiarize yourself with the debuggers provided with various other development tools.
We begin our study of the debugger by investigating breakpoints, which are markers that can be set at any executable line of code. When program execution reaches a breakpoint, execution pauses, allowing you to examine the values of variables to help determine whether a logic error exists. For example, you can examine the value of a variable that stores the result of a calculation to determine whether the calculation was performed correctly. Note that attempting to set a breakpoint at a line of code that is not executable (such as a comment) will actually set the breakpoint at the next executable line of code in that function.
To illustrate the features of the debugger, we use the program listed in Fig. G.3, which creates and manipulates an object of class Account (Figs. G.1–G.2). Execution begins in main (lines 12–30 of Fig. G.3). Line 14 creates an Account object with an initial balance of $50.00. Account’s constructor (lines 10–22 of Fig. G.2) accepts one argument, which specifies the Account’s initial balance. Line 17 of Fig. G.3 outputs the initial account balance using Account member function getBalance. Line 19 declares a local variable withdrawalAmount, which stores a withdrawal amount read from the user. Line 21 prompts the user for the withdrawal amount, and line 22 inputs the amount into withdrawalAmount. Line 25 subtracts the withdrawal from the Account’s balance using its debit member function. Finally, line 28 displays the new balance.
Fig. G.1 Header file for the Account class.
1 // Fig. G.1: Account.h
2 // Definition of Account class.
3
4 class Account
5 {
6 public:
7 Account( int ); // constructor initializes balance
8 void credit( int ); // add an amount to the account balance
9 void debit( int ); // subtract an amount from the account balance
10 int getBalance(); // return the account balance
11 private:
12 int balance; // data member that stores the balance
13 }; // end class Account
Fig. G.2 Definition for the Account class.
1 // Fig. G.2: Account.cpp
2 // Member-function definitions for class Account.
3 #include <iostream>
4 using std::cout;
5 using std::endl;
6
7 #include "Account.h" // include definition of class Account
8
9 // Account constructor initializes data member balance
10 Account::Account( int initialBalance )
11 {
12 balance = 0; // assume that the balance begins at 0
13
14 // if initialBalance is greater than 0, set this value as the
15 // balance of the account; otherwise, balance remains 0
16 if ( initialBalance > 0 )
17 balance = initialBalance;
18
19 // if initialBalance is negative, print error message
20 if ( initialBalance < 0 )
21 cout << "Error: Initial balance cannot be negative.
" << endl;
22 } // end Account constructor
23
24 // credit (add) an amount to the account balance
25 void Account::credit( int amount )
26 {
27 balance = balance + amount; // add amount to balance
28 } // end function credit
29
30 // debit (subtract) an amount from the account balance
31 void Account::debit( int amount )
32 {
33 if ( amount <= balance ) // debit amount does not exceed balance
34 balance = balance - amount;
35
36 else // debit amount exceeds balance
37 cout << "Debit amount exceeded account balance.
" << endl;
38 } // end function debit
39
40 // return the account balance
41 int Account::getBalance()
42 {
43 return balance; // gives the value of balance to the calling function
44 } // end function getBalance
Fig. G.3 Test class for debugging.
1 // Fig. G.3: figg_03.cpp
2 // Create and manipulate Account objects.
3 #include <iostream>
4 using std::cin;
5 using std::cout;
6 using std::endl;
7
8 // include definition of class Account from Account.h
9 #include "Account.h"
10
11 // function main begins program execution
12 int main()
13 {
14 Account account1( 50 ); // create Account object
15
16 // display initial balance of each object
17 cout << "account1 balance: $" << account1.getBalance() << endl;
18
19 int withdrawalAmount; // stores withdrawal amount read from user
20
21 cout << "
Enter withdrawal amount for account1: "; // prompt
22 cin >> withdrawalAmount; // obtain user input
23 cout << "
attempting to subtract " << withdrawalAmount
24 << " from account1 balance
";
25 account1.debit( withdrawalAmount ); // try to subtract from account1
26
27 // display balances
28 cout << "account1 balance: $" << account1.getBalance() << endl;
29 return 0; // indicate successful termination
30 } // end main
In the following steps, you’ll use breakpoints and various debugger commands to examine the value of the variable withdrawalAmount declared in Fig. G.3.
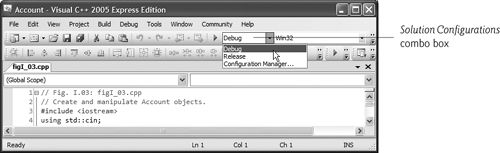
1. Enabling the debugger. The debugger is normally enabled by default. If it is not enabled, you have to change the settings of the Solution Configurations combo box (Fig. G.4) in the toolbar. To do this, click the combo box’s down arrow, then select Debug.
2. Inserting breakpoints in Visual Studio. To insert a breakpoint in Visual Studio, click inside the margin indicator bar (the gray margin at the left of the code window in Fig. G.5) next to the line of code at which you wish to break or right click that line of code and select Breakpoint > Insert Breakpoint. You can set as many breakpoints as necessary. Set breakpoints at lines 21 and 25 of your code. A red circle appears in the margin indicator bar where you clicked, indicating that a breakpoint has been set (Fig. G.5). When the program runs, the debugger pauses execution at any line that contains a breakpoint. The program is said to be in break mode when the debugger pauses the program. Breakpoints can be set before running a program, in break mode and while a program is running.

3. Starting to debug. After setting breakpoints in the code editor, select Build > Build Solution to compile the program, then select Debug > Start Debugging to begin the debugging process. [Note: If you do not compile the program first, it will still be compiled when you select Debug > Start Debugging.] When you debug a console application, a Command Prompt window appears (Fig. G.6) in which you can specify program input and view program output. The debugger enters break mode when execution reaches the breakpoint at line 21.

4. Examining program execution. Upon entering break mode at the first breakpoint (line 21), the IDE becomes the active window (Fig. G.7). The yellow arrow to the left of line 21 indicates that this line contains the next statement to execute.

5. Using the Continue command to resume execution. To resume execution, select Debug > Continue. The Continue command resumes program execution until the next breakpoint or the end of main is encountered, whichever comes first. The program continues executing and pauses for input at line 22. Enter 13 as the withdrawal amount. The program executes until it stops at the next breakpoint (line 25). Notice that when you place your mouse pointer over the variable name withdrawalAmount, the value stored in the variable is displayed in a Quick Info box (Fig. G.8). As you’ll see, this can help you spot logic errors in your programs.

6. Setting a breakpoint at the return statement. Set a breakpoint at line 29 in the source code by clicking in the margin indicator bar to the left of line 29. This will prevent the program from closing immediately after displaying its result. When there are no more breakpoints at which to suspend execution, the program will execute to completion and the Command Prompt window will close. If you do not set this breakpoint, you won’t be able to view the program’s output before the console window closes.
7. Continuing program execution. Use the Debug > Continue command to execute the code up to the next breakpoint. The program displays the result of its calculation (Fig. G.9).

8. Disabling a breakpoint. To disable a breakpoint, right click a line of code on which a breakpoint has been set (or the breakpoint itself) and select Disable Breakpoint. The disabled breakpoint is indicated by a hollow circle (Fig. G.10). Disabling rather than removing a breakpoint allows you to reenable the break-point later by clicking the hollow circle or by right-clicking the hollow circle and selecting Enable Breakpoint.

9. Removing a breakpoint. To remove a breakpoint that you no longer need, right click a line of code on which a breakpoint has been set and select Breakpoint > Delete Breakpoint. You also can remove a breakpoint by clicking the breakpoint in the margin indicator bar.
10. Finishing program execution. Select Debug > Continue to execute the program to completion.
In this section, you learned how to enable the debugger and set breakpoints so that you can examine the results of code while a program is running. You also learned how to continue execution after a program suspends execution at a breakpoint and how to disable and remove breakpoints.
In the preceding section, you learned that the Quick Info feature allows you to examine a variable’s value. In this section, you’ll learn to use the Locals window to assign new values to variables while your program is running. You’ll also use the Watch window to examine the value of more complex expressions.
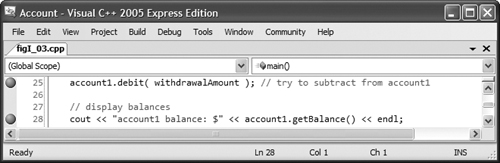
1. Inserting breakpoints. Clear the existing breakpoints. Then, set a breakpoint at line 25 in the source code by clicking in the margin indicator bar to the left of line 25 (Fig. G.11). Set another breakpoint at line 28 by clicking in the margin indicator bar to the left of line 28.
2. Starting debugging. Select Debug > Start. Type 13 at the Enter withdrawal amount for account1: prompt and press Enter so that your program reads the value you just entered. The program executes until the breakpoint at line 25.
3. Suspending program execution. The debugger enters break mode at line 25 (Fig. G.12). At this point, line 22 has input the withdrawalAmount that you entered (13), lines 23–24 have output that the program will attempt to withdraw money and line 25 is the next statement that will execute.


4. Examining data. In break mode, you can explore the values of your local variables using the debugger’s Locals window. To view the Locals window, select Debug > Windows > Locals. Figure G.13 shows the values for main’s local variables account1 and withdrawalAmount (13).

5. Evaluating arithmetic and boolean expressions. You can evaluate arithmetic and boolean expressions using the Watch window. You can display up to four Watch windows. Select Debug > Windows > Watch > Watch 1. In the first row of the Name column, type (withdrawalAmount + 3) * 5, then press Enter. The value of this expression (80 in this case) is displayed in the Value column (Fig. G.14). In the next row of the Name column, type withdrawalAmount == 3, then press Enter. This expression determines whether the value of withdrawalAmount is 3. Expressions containing the == operator (or any other relational or equality operator) are treated as bool expressions. The value of the expression in this case is false (Fig. G.14), because withdrawalAmount currently contains 13, not 3.

6. Resuming execution. Select Debug > Continue to resume execution. Line 25 debits the account by the withdrawal amount, and the debugger reenters break mode at line 28. Select Debug > Windows > Locals or click the Locals tab at the bottom of Visual Studio to redisplay the Locals window. The updated balance value in account1 is now displayed in red (Fig. G.15) to indicate that it has been modified since the last breakpoint. Click the plus box to the left of account1 in the Name column of the Locals window. This allows you to view each of account1’s data member values individually—this is particularly useful for objects that have several data members.

7. Modifying values. Based on the value input by the user (13), the account balance output by the program should be $37. However, you can use the Locals window to change the values of variables during the program’s execution. This can be valuable for experimenting with different values and for locating logic errors. In the Locals window, click the Value field in the balance row to select the value 37. Type 33, then press Enter. The debugger changes the value of balance and displays its new value in red (Fig. G.16).

8. Setting a breakpoint at the return statement. Set a breakpoint at line 29 in the source code to prevent the program from closing immediately after displaying its result. If you do not set this breakpoint, you won’t be able to view the program’s output before the console window closes.
9. Viewing the program result. Select Debug > Continue to continue program execution. Function main executes until the return statement in line 29 and displays the result. Notice that the result is $33 (Fig. G.17). This shows that Step 7 changed the value of balance from the calculated value (37) to 33.

10. Stopping the debugging session. Select Debug > Stop Debugging. This will close the Command Prompt window. Remove all remaining breakpoints.
In this section, you learned how to use the debugger’s Watch and Locals windows to evaluate arithmetic and boolean expressions. You also learned how to modify the value of a variable during your program’s execution.
Sometimes executing a program line by line can help you verify that a function’s code executes correctly, and can help you find and fix logic errors. The commands you learn in this section allow you to execute a function line by line, execute all the statements of a function at once or execute only the remaining statements of a function (if you have already executed some statements within the function).
1. Setting a breakpoint. Set a breakpoint at line 25 by clicking in the margin indicator bar to the left of the line.
2. Starting the debugger. Select Debug > Start. Enter the value 13 at the Enter withdrawal amount for account1: prompt. Execution will halt when the program reaches the breakpoint at line 25.
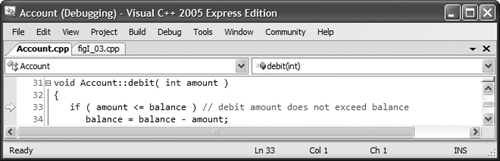
3. Using the Step Into command. The Step Into command executes the next statement in the program (the one that the yellow arrow points to in line 25 of Fig. G.18), then immediately halts. If that statement is a function call (as is the case here), control transfers into the called function. This enables you to execute each statement inside the function individually to confirm the function’s execution. Select Debug > Step Into to enter the debit function. Then, Select Debug > Step Into again so the yellow arrow is positioned at line 33, as shown in Fig. G.19.

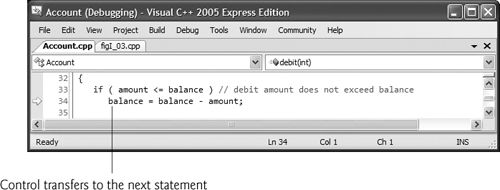
4. Using the Step Over command. Select Debug > Step Over to execute the current statement (line 33 in Fig. G.19) and transfer control to line 34 (Fig. G.20). The Step Over command behaves like the Step Into command when the next statement to execute does not contain a function call. You’ll see how the Step Over command differs from the Step Into command in Step 10.
5. Using the Step Out command. Select Debug > Step Out to execute the remaining statements in the function and return control to the next executable statement (line 28 in Fig. G.3). Often, in lengthy functions, you’ll want to look at a few key lines of code, then continue debugging the caller’s code. The Step Out command enables you to continue program execution in the caller without having to step through the entire called function line by line.
6. Setting a breakpoint. Set a breakpoint at the return statement of main at line 29 of Fig. G.3. You’ll make use of this breakpoint in the next step.
7. Using the Continue command. Select Debug > Continue to execute until the next breakpoint is reached at line 29. Using the Continue command is useful when you wish to execute all the code up to the next breakpoint.
8. Stopping the debugger. Select Debug > Stop Debugging to end the debugging session. This will close the Command Prompt window.
9. Starting the debugger. Before we can demonstrate the next debugger feature, you must start the debugger again. Start it, as you did in Step 2, and enter 13 in response to the prompt. The debugger enters break mode at line 25.
10. Using the Step Over command. Select Debug > Step Over (Fig. G.21) Recall that this command behaves like the Step Into command when the next statement to execute does not contain a function call. If the next statement to execute contains a function call, the called function executes in its entirety (without pausing execution at any statement inside the function), and the yellow arrow advances to the next executable line (after the function call) in the current function. In this case, the debugger executes line 25, located in main (Fig. G.3). Line 25 calls the debit function. The debugger then pauses execution at line 28, the next executable line in the current function, main.

11. Stopping the debugger. Select Debug > Stop Debugging. This will close the Command Prompt window. Remove all remaining breakpoints.
In this section, you learned how to use the debugger’s Step Into command to debug functions called during your program’s execution. You saw how the Step Over command can be used to step over a function call. You used the Step Out command to continue execution until the end of the current function. You also learned that the Continue command continues execution until another breakpoint is found or the program exits.
The Autos window displays the variables used in the previous statement executed (including the return value of a function, if there is one) and the variables in the next statement to execute.
1. Setting breakpoints. Set breakpoints at lines 14 and 22 in main by clicking in the margin indicator bar.
2. Using the Autos window. Start the debugger by selecting Debug > Start. When the debugger enters break mode at line 14, open the Autos window (Fig. G.22) by selecting Debug > Windows > Autos. Since we are just beginning the program’s execution, the Autos window lists only the variables in the next statement that will execute—in this case, the account1 object, its value and its type. Viewing the values stored in an object lets you verify that your program is manipulating these variables correctly. Notice that account1 contains a large negative value. This value, which may be different each time the program executes, is account1’s uninitialized value. This unpredictable (and often undesirable) value demonstrates why it is important to initialize all C++ variables before they are used.

3. Using the Step Over command. Select Debug > Step Over to execute line 14. The Autos window updates the value of account1’s balance data member (Fig. G.23) after it is initialized. The value of balance is displayed in red to indicate that it just changed.

4. Continuing execution. Select Debug > Continue to execute the program until the second breakpoint at line 22. The Autos window displays uninitialized local variable withdrawalAmount (Fig. G.24), which has a large negative value.

5. Entering data. Select Debug > Step Over to execute line 22. At the program’s input prompt, enter a value for the withdrawal amount. The Autos window updates the value of local variable withdrawalAmount with the value you entered (Fig. G.25).

6. Stopping the debugger. Select Debug > Stop Debugging to end the debugging session. Remove all remaining breakpoints.
In this appendix, you learned how to insert, disable and remove breakpoints in the Visual Studio debugger. Breakpoints allow you to pause program execution so you can examine variable values. This capability will help you locate and fix logic errors in your programs. You saw how to use the Locals and Watch windows to examine the value of an expression and how to change the value of a variable. You also learned debugger commands Step Into, Step Over, Step Out and Continue that can be used to determine whether a function is executing correctly. Finally, you learned how to use the Autos window to examine variables used specifically in the previous and next commands.