
Chapter 11
Color Reproduction
Photograph by David Kelbe, Imaging Science student, Rochester Institute of Technology.
Objectives of Color Reproduction
When considering the properties required of color photographic materials, it is necessary to include the purpose for making the photograph. Generally, the objective of color photography is to produce either an accurate color photograph or a pleasing color photograph. Accurate color reproduction implies a certain correspondence of the colors in the photograph to those of an original scene. When the viewer is familiar with objects in the photograph, having the colors in the reproduction match the viewer's memory of those in the original would be preferable. With a much more demanding form of accurate color reproduction, the photograph is held in the hand and critically compared directly to the original scene or object. Except with very simple subject matter, no color photographic systems are capable of fulfilling this definition of accurate color reproduction.
There are at least three major reasons why color photographic systems are unable to achieve accurate color reproduction—they are physical, physiological, and psychological in nature. The most troublesome of the physical reasons is that the dyes employed to construct the photographic image are not the same colorants that existed in the original subject. This will affect the range of colors or color gamut that can be reproduced. Furthermore, the dyes have unwanted absorptions that limit their ability to accurately simulate the real-life colors.
Among the physiological factors is the fact that the human eye records the original subject colors in a fashion far different from that of a color film. Because the spectral response of color film or digital sensors differs from that of the eye, the various wavelengths of light reflected from the subject will be encoded (analyzed) in a different way. Additionally, because the eye adapts its sensitivity to the current visual field, its spectral response changes frequently.
Generally, the objective of color photography is to produce either an accurate color photograph or a pleasing color photograph.
The human visual system adapts its color sensitivity to different visual environments, whereas color films do not.
Finally, it is obvious that a photograph is not an original scene, but rather something derived from it. It is two-dimensional, typically much smaller than the original scene, and viewed under significantly different lighting conditions than the original scene. Thus the perceptual conditions are significantly different when viewing a photograph than when viewing the original scene. In other words, the dyes or inks in the photograph may be physically identical to those in the original subject and present in the same quantities, but still not give an accurate color reproduction because of these psychological differences.
Most often the goal is pleasing color reproduction, which can also be defined in a variety of ways. For example, it is possible to differentiate between acceptable color reproduction and excellent color reproduction. Acceptable color prints can be defined as those containing a reasonable resemblance to the colors in the original scene. The color prints produced by amateur photofinishing labs using automated equipment and the color prints from instant cameras are examples of generally acceptable color photography. Every color photographic process has certain defects and limitations, which may work strongly against a particular subject color. However, for every subject, a most pleasing print can be made by whatever process is used.
To obtain such an excellent print may require the use of special procedures, such as retouching, color masking, or digitally manipulating it with computer digital image processing software. This is the nature of the work performed by professional photographers and custom-color printing laboratories, and these are examples of what is termed excellent color photography. Obviously the differences between acceptable and excellent color reproduction are a matter of opinion, and as such highly depend upon the audience. Thus, the definition of pleasing color reproduction will ultimately be determined by the user.
It is safe to say that if accurate color reproduction were the most important objective in color photography, the wide proliferation of color photographic systems would never have occurred. The majority of photographers require only pleasing color reproduction, which is the principal objective of most color photographic endeavors. Cost and convenience may be as important to users as the quality in selecting a color system.
Additive and Subtractive Color Formation
All color reproduction systems operate on the assumption that the human eye contains three different types of color receptors or cones. Many experiments show that almost all colors can be produced through the appropriate mixture of red, green, and blue light. Although many theories of color vision have been proposed and used to describe various visual phenomena, the trichromatic theory of color vision offers the most satisfactory explanation of color perception as it relates to color photography. Thus, in order for a color photographic system to be successful, it must be capable of recording and controlling the red, green, and blue components of the light being reflected, transmitted, or emitted by the subject. There are two basic methods for controlling the color of the light produced in a color reproduction system—additive color mixture, which involves combining red, green, and blue light, and subtractive color mixture, which involves colorants that selectively absorb red, green, and blue light.
In an additive system, it is possible to produce a wide variety of colors by mixing various amounts of red, green, and blue light. This can be illustrated by using three identical projectors, each equipped with a different colored filter (red, green, and blue) and aimed at a projection screen. Equipping each projector with a variable aperture will allow the illuminance of each color to be adjusted to create brighter or darker colors. Overlapping the blue and the green lights and altering the illuminance of each of the lights will produce a series of blue-green or cyan colors.
Adding the red light to the system and overlapping it with the blue light will result in a series or red-blue or magenta colors. Likewise, overlapping the red light with the green light will produce a series of yellow colors.
Figure 11-1 shows the results of such a system. Each of the three beams of light is falling individually on the screen and also overlaps the other beams. That cyan is formed where the blue and green overlap is not surprising, nor is the formation of magenta from the combination of blue and red light. Visually, the colors produced are consistent with the contributions made by the primary colors. However, for the mixture of red light and green light to appear yellow is a somewhat amazing result, since yellow in no way resembles the red light and the green light. This phenomenon is related to the theory of color vision. Where the beams of the three projectors overlap, the color white is produced. The area of the screen where no direct light from any projector falls would appear black. This illustrates the fundamental method of additive color formation.
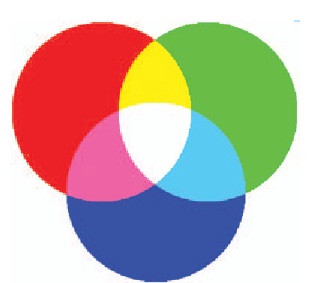
Figure 11-1 Additive color system
Table 11-1 Basic facts of additive color formation (the mixing of lights)
| Lights | Produce |
| Blue light plus green light | Cyan |
| Blue light plus red light | Magenta |
| Green light plus red light | Yellow |
| Blue light plus green light plus red light | White |
| No light | Black |
The word additive implies that adding together different amounts of the three colors of light produces different colors. All additive color reproduction systems require the use of the three colors represented in this example: red light, green light, and blue light. Consequently, these colors are referred to as the additive primaries. Table 11-1 lists the basic facts of additive color formation using these three additive primaries.
By effectively controlling the operation of the three projectors, practically any color can be produced. Thus the attributes of colors—hue, lightness, and saturation—can all be controlled by changing the amounts of red, green, and blue light falling on the screen. About the only colors that can't be produced are spectral colors, because they are too saturated to be simulated with this method.
Both additive and subtractive color reproduction systems are based on controlling red, green, and blue light.
There are various ways by which red, green, and blue light can be combined, including superimposing, spatial blending, and temporal blending.
There are two additional ways to employ the principles of additive color formation. A single projector can be used to project three colored images in rapid succession with red, green, and blue following each other so rapidly that the eye cannot distinguish the individual projected colors. Thus the mixing of the three lights is achieved through the perceptual phenomenon known as persistence of vision. This technique is referred to as temporal color mixing and is currently used in DLP systems.
In an alternative process, small transparent bits of red, green, and blue are placed side by side to form the picture. The bits are so small that the eye cannot readily distinguish them as colored spots. This is the method employed in CRTs used in color television and computer monitors. The picture is composed of small spots of red, green, and blue light from the phosphors coated on the screen. Observed from the proper viewing distance, these spots blend to form the color image, and with their intensities electronically controlled they reproduce the colors of the original subject. This method is referred to as spatial color mixing or partitive mixing.
Cyan, magenta, and yellow subtractive primary colorants respectively absorb red light, green light, and blue light.
In summary, additive color formation is characterized by the mixing of lights. Since the human color visual system has three different types of color receptors (red, green, and blue), the colors of the three lights used must be red, green, and blue. The additive mixture of lights can be achieved through either temporal fusion or spatial fusion, as well as by physically mixing the lights.
The alternative to additive color formation is subtractive color formation. It is characterized by the mixing colorants (dyes, pigments, paints, and inks). Although subtractive synthesis involves a significantly different principle, such a system can produce nearly the same range of colors as the additive system. In order for a subtractive system of color formation to be successful, the colorants must be capable of controlling the red, green, and blue light components of the white viewing light. As a result, only three colorants can meet this requirement: cyan, magenta, and yellow. Cyan is used because it absorbs red light and reflects (or transmits) blue and green light, creating its blue-green appearance. Magenta is used because it absorbs green light and reflects (or transmits) blue light and red light, causing its blue-red appearance. Yellow is used because it absorbs blue light and reflects red and green light. As a result, the subtractive primaries of cyan, magenta, and yellow can be summarized as follows:

Figure 11-2 illustrates the results of mixing various amounts of the cyan, magenta, and yellow colorants. Initially the paper is illuminated by white light, which contains nearly equal amounts of red, green, and blue light. Since the paper is white, it reflects white light, again consisting of nearly equal amounts of red, green, and blue light. Where the yellow colorant is mixed with the cyan colorant, the area of overlap produces the color green. The yellow colorant absorbs the blue portion of the white light and the cyan colorant absorbs the red portion of the white light, leaving only the green to be reflected back to our eyes. Similarly, where the yellow and magenta colorants overlap, the color red appears. The blue light is absorbed by the yellow colorant and the green light by the magenta colorant, leaving only the red light to be reflected to our eyes. Finally, where the cyan and magenta colorants overlap, the color blue appears. This occurs because of the red light absorption by the cyan colorant and the green light absorption by the magenta, leaving only the blue light component of the original white light to be reflected to our eyes. A wide variety of hues can be reproduced by mixing varying amounts of these three colorants.

Figure 11-2 Subtractive color system
Varying the amount of all three primaries in the required proportions will produce a range of neutral hues varying from white to black. Table 11-2 summarizes the results of mixing pigments.
Table 11-2 Basic facts of subtractive color formation (mixing of pigments)
| Colorant | Absorbs | Produces |
| Cyan | Red | Blue-green (cyan) |
| Magenta | Green | Blue-red (magenta) |
| Yellow | Blue | Green-red (yellow) |
| Cyan plus magenta | Red and green | Blue |
| Cyan plus yellow | Red and blue | Green |
| Magenta plus yellow | Green and blue | Red |
| Cyan plus magenta plus yellow | Red, green, and blue | Black |
| No colorant | Nothing | White |
The use of the term subtractive color formation for this system is appropriate, because it depends upon the use of substances that remove varying amounts and colors of light from an initially white source of light.
In many subtractive printing systems used today a fourth colorant or ink is used, black. These systems are referred to as CYMK, K representing the black. This occurs for two reasons. In practice it is often difficult to produce a true black using cyan, magenta, and yellow inks. The resulting color is often a muddy brown in appearance. These three colored inks are also expensive. Adding the black ink solves both problems; it provide a true pure black and is much less expensive to produce. Higher end printers will also separate the CMY inks into two separate inks. For example, including a light and dark magenta, cyan, and yellow ink. This provides better color reproduction.
The Recording of Color (Analysis Stage)
All color photographic systems consist of two major stages—analysis and synthesis. First, the colors of light from the subject must be recorded in terms of primary colors—typically, red, green, and blue—which is referred to as the analysis stage. Second, to reconstruct the photographic image the process must be able to control the red, green, and blue light that will ultimately reach the viewer of the image—which is referred to as the synthesis stage.
The oldest and most fundamental method of achieving the first stage is to use red, green, and blue filters with black-and-white panchromatic film, which is sensitive to red, green, and blue light. Figure 11-3 illustrates this approach to color analysis. The subject is first photographed through each of the filters on three separate sheets of film. After processing, the negatives, called separation negatives, reveal three separate records of the subject. The red separation negative is dense in the areas where red light was reflected from the subject. Similarly, the green and blue separation negatives are records of the green and blue content of the subject.
Notice that the yellow patch of the subject is recorded as a dense area in both the red and the green separation negatives. This is because a yellow object absorbs only blue light and reflects both red and green light. Therefore, both the red and green negatives record light from the yellow patch and produce a heavy density.
The exact density information recorded in this tricolor analysis is determined by various factors including the color quality of the illumination, the spectral characteristics of the subject, the transmission characteristics of the red, green, and blue filters, and the spectral sensitivity of the photographic emulsion. A wide variety of tricolor separation filters and photographic emulsion characteristics have been used for tricolor photography. One combination consists of Eastman Kodak Wratten No. 25 (red), No. 58 (green), and No. 47B (blue) filters with Eastman Kodak T-Max 400 black-and-white film. Figure 11-4 illustrates the spectral density curves for these filters and the spectral sensitivity curve of T-Max 400. Figure 11-4 shows the way in which this combination of filters and film would respond to the red, green, and blue components of the light reflected from the scene.

Figure 11-3 The additive system of color photography with both the analysis and synthesis stages illustrated.
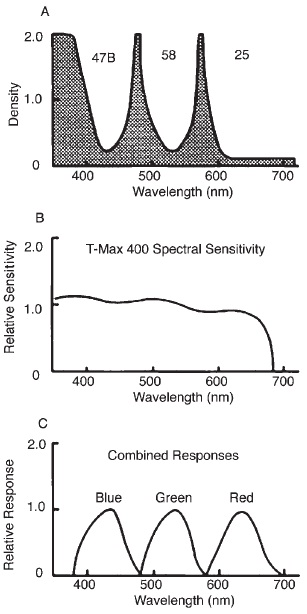
Figure 11-4 Tricolor separations with a black-and-white film. (A) Spectral density curves for tricolor separation filters 47B (blue), 58 (green), and 25 (red). (B) Spectral sensitivity of Eastman Kodak T-Max 400 black-and-white film. (C) Resulting spectral responses when tricolor filters are used with T-Max 400.
The color analysis method used with modern color films is the multilayer approach, whereby three emulsions are coated one above the other on a single base, as illustrated in Figure 11-5. The emulsions are typically separated by interlayers of clear gelatin or colored layers that act as filters. The color analysis is achieved by limiting the emulsion layer sensitivities to the three (red, green, and blue) spectral bands required.
Process red is actually magenta, and process blue is actually cyan.
Analysis and synthesis are involved in all color reproduction processes.
The spectral sensitivities of the multilayer camera speed film are shown in Figure 11-6. On the left are the inherent sensitivities of the blue-, green-, and red-sensitive layers, where it is shown that the green and red recording layers also have blue sensitivity. This problem is minimized through the use of a yellow filter layer above the green and red sensitive layers. The top emulsion is sensitive only to blue light, and the green and red light pass through it without effect, allowing the blue light alone to be recorded in that layer. The yellow filter layer immediately below the top emulsion layer absorbs the blue light and prevents it from reaching the two lower (green and red sensitive) emulsion layers. Thus the effective spectral sensitivities of the three layers are, from top to bottom, blue, green, and red, as shown on the left of Figure 11-6.

Figure 11-5 Cross section of a typical integral tri-pack color film (not drawn to scale).

Figure 11-6 Spectral sensitivity of color film with and without the yellow filter layer.
Since all three emulsion layers of conventional color films are sensitive to blue light, a yellow filter must be used to prevent the blue light from reaching the two bottom emulsion layers.
Consequently, multilayer films possess three more or less independently sensitized emulsions. Such a process requires only a single camera exposure to produce the red, green, and blue record negatives. The three negatives will be stacked on top of each other and, consequently, are inseparable.
At this point, it is important to understand what each of the separation negatives represents. Let us examine the red record negative first. There should only be density present on the negative where there was red light reflected from the subject. There should be no density present on the negative when only blue or green light was reflected. Similarly, the green record negative should only have density where there was green light reflected from the subject and the blue record negatives should only have density where there was blue light reflected from the subject.
In a digital photographic system, it is also necessary to record red, green, and blue “densities" or pixel values separately. Silicon, the light-sensitive material used to create the digital image sensor, responds to all wavelengths of light. One method used to separate the information is to place a Bayer pattern filter over the sensor. See Figure 11-7. The Bayer filter has alternating red, green, and blue filters in a ratio of 50% green, 25% red, and 25% blue. This ratio was chosen based on the higher sensitivity of human vision to green wavelengths than the red or blue wavelengths. The red filter passes only the red light onto the pixel below, the blue filter passes only the blue light, and the green filter passes only the green light onto the green sensor. See Figure 11-8.
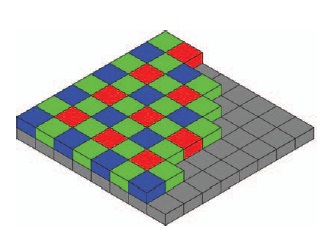
Figure 11-7 Bayer pattern layout.

Figure 11-8 Bayer filter array pixel pattern result.
The Bayer pattern filter does not provide a red, green, and blue digital count value for each pixel. The missing digital counts for the intermediate pixels are interpolated to provide a red, green, and blue digital count for each pixel. Interpolation can sometimes result in color fringing along edges.
An alternate sensor configuration is the Foveon X3 sensor, also referred to as a direct image sensor. This CMOS (complementary metal-oxide-semiconductor) sensor stacks three photodiode layers on top of each other. When silicon is exposed to white light, different wavelengths of light will penetrate to different depths. The Foveon sensor takes advantage of this. Blue data comes from the top layer, followed by green then red data layers. This system provides a red, green, and blue digital count for each pixel without the use of interpolation.
The Production of Color (Synthesis Stage)
Once the subject colors have been analyzed and separated into their red, green, and blue components, they must be put back together by some process that recreates the appearance of the original colors. This step is referred to as the color synthesis stage and may be achieved by either the additive or the subtractive methods of color formation previously described.
In all color photographic processes, the viewer is interested in seeing the picture as it originally appeared—as a positive image. In a film-based system, this can be achieved by making three positive silver images, one from each of the three silver separation negatives. Because the densities in the red record negative are formed where red light is reflected from the subject, the densities in the positive will have an inverse relationship with the red content of the scene. The red record positive has the greatest density in those areas where the least red light was reflected from the subject. Similarly, the green and blue record positives will have the greatest density in the areas reflecting the least green and blue light, respectively.
Table 11-3 The relationships between separation negatives and separation positives in terms of density
The reconstruction of the subject colors by using these three positives is illustrated in the portion of Figure 11-3 labeled the synthesis stage. Here, three projectors are equipped with red, green, and blue filters. The red record positive is placed in the projector equipped with the red filter. Because the red record positive contains the most density in the areas that reflected the least red light, it will prevent red light from reaching the screen in those same areas. This same positive is thin in the areas that reflected much red light from the subject, and will for those areas permit red light to reach the screen. Therefore, the red light is reaching the screen in approximately the same relative amounts as red light was reflected from the subject.
The densities in a red record separation negative indicate where red was present in the original subject.
Similarly, the green and blue record positives are placed in the projectors equipped with the green and blue filters. The three images are projected on the screen so that they are exactly superimposed. When this procedure is carefully performed, a full color reproduction of the original subject will be formed on the screen. Since this color formation is the result of mixing lights, it is defined as an additive color reproduction system.
With reversal color films a red image is obtained by removing blue and green from the white viewing light with yellow and magenta dyes.
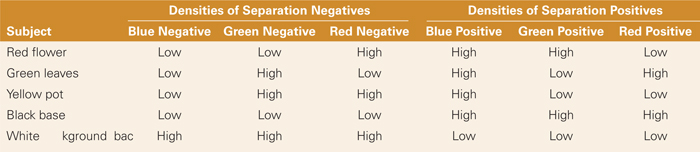
The relationship between the densities of the separation negatives and the densities of the separation positives is summarized in Table 11-3 for the simple subject matter shown in Figure 11-3. Notice that for the yellow pot the absence of density in the red and green record positives allows red and green light to reach the screen, where they mix together to produce the color yellow. For the black base, no light reaches the screen from any of the projectors. For the white background, all three projectors produce light on the screen, creating the color white.
If the color analysis stage involved a single exposure through a color mosaic screen, the separation negatives will exist side by side in the emulsion. A positive image must be obtained with reversal processing or by producing a negative and contact printing it onto another piece of film. The positive is then placed in register with the original color mosaic screen, and the combination is viewed by transmitted light. Such a system is illustrated in Figure 11-9. Again, the synthesis stage of this process involves a mixture of red, green, and blue light transmitted through the filter mosaic— therefore, it is described as an additive color reproduction system.
The color analysis method that employs a multilayer film as the recording medium contains a set of separation negatives stacked vertically on top of each other. Because the red, green, and blue records are superimposed and inseparable, it is impossible to employ the active system of mixing red, green, and blue lights to form the color reproduction. Consequently, for multilayer materials an alternative approach to color formation must be used.
Figure 11-9 Reproduction of color through the use of the mosaic screen process.
In additive color synthesis, silver positives are used to absorb the appropriate amounts of the red, green, and blue light in the three projector system. The alternative approach is to substitute colors (dyes), superimposed in the emulsion, for the three silver positives. In the red record positive, it is necessary to use a dye that absorbs only the red part of the spectrum. A properly formed cyan dye image is nearly as effective in absorbing red light as is the red record silver positive image. The cyan dye will allow the blue light and green light to be transmitted. In the green record positive, it is necessary to use a dye that absorbs only green light. Thus magenta dye is used since it absorbs green light and transmits blue and red light. In the blue record positive, yellow dye absorbs only blue light and allows red light and green light to pass.
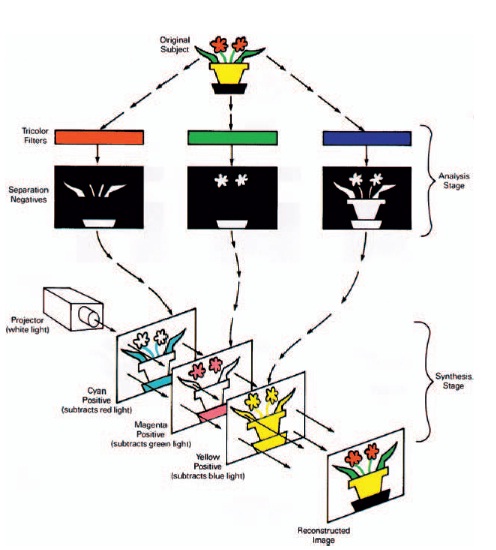
Figure 11-10 Subtractive system of color photography with both the analysis and synthesis stages illustrated.
Therefore, if the multilayer separation positive consists of cyan, magenta, and yellow dyes, the image can be projected using a single projector. This arrangement is illustrated in Figure 11-10. It is successful because the dye images, unlike silver, absorb only one color of light, and allow the other two to be transmitted. Therefore, by combining the three dye images in exact registration, a three layer image is produced that requires only one source of light for viewing. The red portion of the white light is controlled by the density of the cyan dye image alone, while the green portion of the white light is being controlled by the magenta dye image alone. The blue portion of the white light is controlled by the yellow dye image. In this fashion, the cyan, magenta, and yellow dye images act as light valves, absorbing appropriate amounts of red, green, and blue light. This system is defined as a subtractive color reproduction process because it involves removing red, green, and blue light from the initial white viewing light.
Table 11-4 summarizes the effects of the three dye positives for the simple subject considered in Figure 11-10. The process affected some of the subject areas in these ways:
Table 11-4 Analysis of the yellow, magenta, and cyan dye separation positives in terms of the amount of dye formed
| Subject | Yellow Positive | Magenta Positive | Cyan Positive |
| Red flower | Large | Large | No |
| Green leaves | Large | No | Large |
| Yellow pot | Large | No | No |
| Black base | Large | Large | Large |
| White background |
No | No | No |
- The green leaves. These were recorded only in the green record negative as a heavy density while the other two negatives were thin in the area representing this portion of the subject. When the positives were made, no dye was formed in the magenta positive and a large amount of dye was formed in both the cyan and yellow positive images. In the final reproduction shown in Figure 11-10, the cyan and yellow dyes are superimposed, producing the color green. Because the cyan dye absorbs the red light and the yellow dye absorbs the blue light, the combination absorbs all but the green from the white viewing light.
- The yellow flowerpot. This is recorded as a heavy density in both the red and the green record negatives, but as a thin area in the blue record negative. Since the positives are reversed in density, only the blue record positive will contain any dye. The yellow dye absorbs blue from the white viewing light and this area appears yellow (minus blue).
- The black base of the flower pot. This part of the scene was recorded as a thin area in all three negatives, and as a dense area in all of the positives. This area was, therefore, recorded as a heavy deposit of all three dyes, which when superimposed absorb red, green, and blue light, leaving very little light to reach the viewer.
- The white background. This was recorded as a heavy density in all of the negatives and as a thin area in all of the positives. Since no dye was formed in any of the positives, practically none of the white viewing light is absorbed.
Even with a subject as simple and containing as few colors as this, such a process of subtractive color reproduction can produce a tremendous variety of subject colors. Furthermore, the use of the subtractive process allows for the production of both transmission and reflection color images.
Printing images from digital files works essentially the same way, as a subtractive system. The build up of the cyan, magenta, and yellow dyes happens differently though. An inkjet printing system places extremely small droplets of ink onto paper to create an image. The amount of ink is determined by the digital count values of the pixels in the image.
Spectral Sensitivity
For a color photographic system to reproduce colors approximately as the eye perceives them, the responses to red, green, and blue light must bear the same relationship to each other as do the responses of the eye to these colors. For example, if a reversal color film has relatively too much sensitivity to blue light, blue objects in the scene will appear too light in the color reproduction, assuming the exposure is correct for the green and the red objects and white objects will appear bluish.
Thus one of the requirements for accurate color reproduction is that the red, green, and blue sensitivity of the initial color recording (analysis stage) must match those of the human eye.
Matching the color sensitivity of the three-receptor systems involved in human vision is a very complex task since the human visual system is constantly changing in its response to light. The perceptual phenomena of color adaptation and color constancy are impossible to duplicate with a color film. The human color visual system can adapt to many different forms of color balance while a color film or digital sensor is limited in its response to a single adaptation level and therefore has a given color balance that is determined at the time of manufacture. In the negative/positive process, it is relatively easy to adjust the color balance during the printing operation. In a digital system, the color balance can be adjusted during image capture or with image editing software later. However, reversal color films provide less opportunity for change, because the image exposed in the camera will determine the positive image on the processed film.
A color film can record the light reflected from the subject with only one particular set of sensitivities. The optimum reproduction of color in a reversal film can be obtained only when the illumination is of the particular color quality for which the film is balanced. As a result, film manufacturers market multilayer camera films of three different spectral responses. Daylight-type color films are designed to be exposed to light with a color temperature of 5500 K, which is the mixture of sunlight and skylight most commonly encountered outdoors. Type A films are designed to be used with light sources operating at 3400 K, which is produced by special photoflood lamps. Type B films are balanced for light sources operating at 3200 K, which is the most commonly encountered type of tungsten lamp in photographic studios.
Daylight type color films have lower blue sensitivity and higher red sensitivity than tungsten-type color films.
The difference between color films balanced for 5500 K (daylight) and 3200 K (tungsten lamps) is most easily seen by inspecting the spectral sensitivity curves of the films in Figure 11-11. Such curves indicate the relative sensitivity to light, wavelength by wavelength, for each of the film's three layers. The principal difference between the responses of the two films is in the red sensitive (cyan dye forming) layer, where the response is much lower in the tungsten film than in the daylight film. This is because tungsten sources produce relatively large amounts of red light compared to blue light, whereas daylight has more nearly equal amounts of blue light and red light. Thus the low red sensitivity of the tungsten-balanced film compensates for this high proportion of red light in tungsten sources, producing a correctly balanced color image.

Figure 11-11 Spectral sensitivity curves for daylight-balanced and tungsten—balanced reversal color films of the same speed without the yellow filter that is beneath the blue-sensitive emulsion. This filter prevents blue light from reaching the blue- and green-sensitive and the blue- and red-sensitive emulsions.
Cyan dyes absorb considerable blue light and green light even though they should transmit both colors freely.
The blue sensitivity of the green (magenta forming) layer and the red (cyan forming) layer of both films is essentially eliminated by the yellow filter interlayer that is coated between the top blue-sensitive layer and the bottom two layers in the multilayer films. If the tungsten-balanced film is used with daylight illumination without filtration, the resulting transparencies will show a strong bluish cast. Similarly, if the daylight-balanced film is used with a tungsten source without filtration, the resulting color transparencies will have a reddish cast to them. Therefore, when the color film is to be exposed to light of a color quality other than that for which it was balanced, a conversion filter must be used. Even when appropriate conversion filters are used over the camera lens, errors in the rendering of the colors of certain objects may result, and only a practical test of the film, filters, and light source will determine if the results are suitable. Also, notice that there are no color films balanced for fluorescent lighting. Consequently, all color films invariably require color compensating (CC) filters for fluorescent lights. Proper filter use depends upon the film's original color balance and the type of fluorescent lamp used. Recommended filtration for various combinations of color films and fluorescent lamps can be obtained from film manufacturers.
Color balance issues are easier dealt with in digital photography. Digital cameras have many preset color balances such as daylight, tungsten, or fluorescent. Some offer options for sunny daylight or cloudy daylight. These options provide the same correction as color compensation filters do for film-based systems. Upper-end digital SLR cameras often offer a custom white balance setting that allows the photographer to set the white point balance. The photographer points the camera at an object in the scene that should reproduce as white in the final image and sets the white balance to this, essentially creating custom filtration. The last option available is to capture the image in digital raw format and correct for color balance with image editing software prior to display or printing.
Dye Characteristics
As discussed previously, subtractive color formation involves the mixture of the three dyes—cyan, magenta, and yellow. The purpose of the dyes is to control the amount of red, green, and blue light that will be reflected (or transmitted) to the viewer. Therefore, each of the dyes should absorb only one color of light—the yellow dye should only absorb blue light, the magenta dye should only absorb green light, and the cyan dye should only absorb red light. In other words, each dye should only absorb its complementary color and allow the other two primary colors of light to be transmitted freely. However, even the best available dyes, pigments, and printing inks absorb some colors of light that they should transmit—(1) yellow dye absorbs a small amount of green light, (2) magenta dye absorbs a considerable amount of blue light and a smaller amount of red light, and (3) cyan dye absorbs significant amounts of green light and blue light. The easiest way to define the dye properties is to examine the spectral dye density curves of a typical set of cyan, magenta, and yellow dyes. Such a graph illustrates the wavelength-by-wavelength density of each dye. In Figure 11-12, graph A illustrates the spectral dye-density curves for a theoretically perfect set of dyes. The graph shows that each dye should absorb only one-third of the spectrum and allow the other two-thirds to be transmitted, providing for independent control for each of the red, green, and blue light regions.
Graph B shows the spectral dye density curves for a typical set of cyan, magenta, and yellow dyes. The yellow dye shows a high density to blue light (its primary or “wanted" absorption), a small amount of unwanted absorption in the green region, and practically no absorption in the red region. The magenta dye shows a high density in the green region (its primary absorption) and a significant amount of unwanted absorption in the blue and red regions. The cyan dye shows a high density to red light (its primary absorption) and a significant amount of unwanted absorption in the green and blue regions. Based upon the amount of unwanted absorptions, it appears that the yellow dye is the purest and the cyan dye is the least pure.
In order to understand the effects of these unwanted absorptions, consider the problems of attempting to form a neutral (gray) color. Assume that an initial deposit of cyan dye, which has a primary absorption of red light, is produced. Because the cyan dye has unwanted green light absorption, a lesser amount of magenta dye is required than would otherwise have been used. The magenta dye has significant unwanted blue light absorption, requiring that a lesser amount of yellow dye be formed than would otherwise have been necessary. Therefore, the neutral is formed from unequal amounts of the three dyes because of their unwanted absorptions. Although it is possible to produce a visual neutral in this fashion, the reduction in the magenta and yellow dyes of the process will influence the rendering of other colors such as red, since it is formed from magenta and yellow dyes—green, which is formed by mixing yellow and cyan dyes, and blue, which is formed by mixing cyan and magenta dyes. In other words, these colors and others will be reproduced inaccurately.
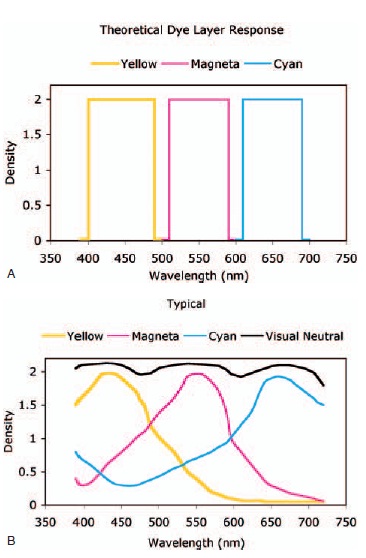
Figure 11-12 (A) Theoretical and (B )typical spectral dye response curves.
Neutral gray areas in color transparencies do not transmit equal amounts of all wavelengths of the white viewing light.
The density obtained with a blue filter densitometer reading of a neutral area on a color transparency is identified as an integral density since it represents the combined densities of all three dye layers with blue light.
This illustrates the fact that the nature of the dyes makes it impossible to obtain accurate reproduction of all colors. Fortunately, accuracy in color reproduction is seldom required. Pleasing color reproduction is the most obvious goal. Color films are invariably designed so that the dyes produce the most pleasing color renditions of such important subjects as skin, grass, the sky, and others familiar to memory. Because color processes are adjusted to produce pleasing reproductions of these memory colors, it is not surprising that slight departures from neutrality occur in the rendering of grays.
This compromise in color reproduction, which is the result of unwanted dye absorptions, does not seriously degrade the quality of a color print or transparency that is to be viewed directly. However, if the color print or transparency is to be duplicated again with the photographic process, the errors in the original are compounded by the errors due to the colorants used in the duplicate reproduction. Consequently, as the chain of color photographic stages gets longer (a duplicate from a duplicate from a duplicate, etc.), undesirable changes in color rendering as well as contrast increase in magnitude.
Color Densities
The measurement of density for colored photographic materials is complicated by the nature of the dye images formed. The spectral dye density curves for the three dyes of a typical color process, together with the curve representing the visually neutral image formed when these dyes are superimposed, are shown in Figure 11-12B. As noted previously, each dye has appreciable density to all wavelengths of light. Therefore, every measurement of the density of a color image (either negative or positive) is simultaneously affected by all three dyes. Furthermore, the visual neutral represented by the top curve, which is produced by mixing these three dyes, departs from a “perfect" neutral, which would yield a horizontal straight line. Since the combined densities of the three dyes are not constant at all wavelengths, density measurements of color images will be greatly influenced by the color characteristics of the light source as well as the color response of the receptor in the densitometer.
Problems arising from light scattering in color materials are much less serious in color materials because the structure of the dye clouds that comprise the color image is much finer than the grains of silver that comprise the image in a black-and-white material. Consequently, the differences between specular and diffuse densities for dye images are quite small, with the Q factor approaching 1.0.
Color films consist of three dye layers, each with different spectral characteristics. Since it is possible to generate either one, two, or all three of the dyes in a color image, it is necessary to distinguish between such images. If a color image has all three dyes present, it is referred to as an integral image. If a color image contains only one of the three dyes, it is referred to as an analytical image. The differences in the nature of these images are the source of the following two fundamental classifications of color densities:
- Integral densities. Integral densities are measures of the combined effect of the three superimposed dye layers. No information about the individual contributions of the dyes can be obtained because each dye has significant absorptions to all wavelengths of light.
- Analytical densities. Analytical densities are measures of the individual contributions of the dye layers to the total image and indicate the composition of the image in terms of the amounts of the dyes present.
In practice, integral densities are far more useful because they describe the performance of the image. Therefore, integral density measurements are usually satisfactory for the consumers of photographic materials. Integral densities are usually insufficient for the manufacturer of color materials because they give no direct information about the image composition. During their manufacture, color emulsions are made and coated separately, and thus the manufacturer must have insight into the nature of each layer. Analytical images can be obtained by exposing and processing individual coatings of each layer.
An alternative method is to expose a multilayer emulsion through a very saturated narrowband filter, thereby producing dye in only one layer.
If all three dyes are present in the image, it is defined as an integral image, and any density measurement made on it is termed an integral density. Likewise, when only one dye layer is present, it is defined as an analytical image and any measurement made on it is termed an analytical density.
Each of these two types of color densities can be classified in terms of the information supplied by the measurements. The following subclassifications are typically used:
- Spectral densities. These measure the wavelength-by-wavelength density of the image, and the results are typically displayed as a graph. If all three dyes are present in the image, the resulting data are termed integral spectral densities, and if only one of the three dye layers is present, the results are termed analytical spectral densities. Referring to Figure 11-12B, the uppermost curve would be termed an integral spectral density plot, and the three curves below would be defined as analytical spectral densities since they relate to each of the three dyes. Such information is fundamental to studies of the dyes used in color photographic materials.
- Wideband three-filter densities. These densities are based on the use of three arbitrarily chosen red, green, and blue filters. The densities are termed wideband since the filters have bandwidths of 30 nm to 60 nm. Thus the data that are derived from a color densitometer describe the red, green, and blue light stopping abilities as dictated by the filters that were used in the instrument.
In addition, the spectral response of the densitometer's photodetector can significantly affect the resulting measured values. Therefore, for the purposes of standardization, the American National Standards Institute has defined the following two conditions for color densitometry:
- Status A densitometry: A set of red, green, and blue response functions for the measurement of color photographic images intended for direct viewing (either transmission or reflection). The standard response functions for status A are illustrated in Figure 11-13. In order to achieve these aim response functions, densitometer manufacturers must select a light source, a filter set, and a photodetector whose combined response will approximate (within 5%) these response functions. This is most commonly achieved through the use of a tungsten lamp operating at 3000 K, an S4 photodetector, and the use of Eastman Kodak Certified AA red, green, and blue filters. The peak responses of these functions correspond fairly closely to the peak densities for each of the three dyes in a typical color-positive material. Furthermore, the response functions are narrow enough to allow fairly high densities (above 2.0) to be measured with good integrity (no crosstalk between the spectral bands). Thus a densitometer equipped with such a set of response functions provides color densities capable of detecting small changes in the densities of the image. It is important to note, however, that such red, green, and blue densities are not a direct indication of the appearance of the colors in the image.

Figure 11-13 Red, green, and blue aim response functions for status A densitometry.
- Status M densitometry: The standard used when reading the densities of color images that are to be printed. The red, green, and blue aim response functions for status M densitometry are illustrated in Figure 11-14. Again, densitometer manufacturers must select a combination of lamp, filter set, and photodetector response that approximates these response functions. The use of a tungsten lamp operating at 3000 K, the S4 photodetector, and Eastman Kodak Certified MM filters meets this requirement; and densitometers so equipped are said to read “Status M Density.”
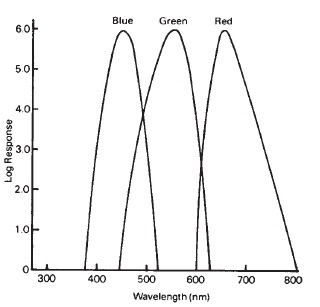
Figure 11-14 Red, green, and blue aim response functions for status M densitometry.
Notice that the response functions for status M show considerable overlap when compared to the status A response functions (that is, they have greater crosstalk). This is intended to simulate the red, green, and blue spectral response functions encountered in color print emulsions. Thus densitometers equipped with these response functions give densities that are descriptive of the printing properties of the image.
The benefit of using densitometers with these standardized response functions is principally a reduction of inter-instrument variability. The result is that densitometers from the same manufacturer and densitometers from different manufacturers tend to show better agreement when measuring the same image. As noted above, if the image being measured consists of all three dyes superimposed, the densities are referred to as integral and if only one of the three dyes is present, such wideband densities are termed analytical. This type of color densitometry is more commonly employed on integral images to obtain information about the performance of the color materials. Further, such readings are often used in conventional process monitoring where it is necessary to determine significant changes in the processing conditions by using standardized control strips.
Regardless of the use of the readings and the filter set actually employed, it is necessary to check the instrument's behavior periodically by using statistical control methods. Periodic readings should be made on standard control patches to detect unwanted changes in the densitometer's response.
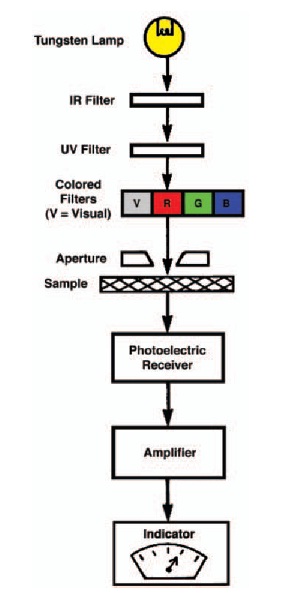
Figure 11-15 Major components of a photoelectric transmission densitometer.
Figure 11-15 is a simplified diagram of the basic components of a transmission color densitometer. The basic parts are (1) a light source that emits light in all regions of the visible spectrum, typically a tungsten lamp operated at 3000 K, (2) a set of wideband red, green, and blue filters plus a fourth filter that adjusts the instrument response to match that of the eye (visual density), and (3) a photoelectric receiver that senses the light transmitted by the sample being measured. Most commercial color densitometers allow for interchangeable filter sets, so that status A, status M, or non-status three-filter color densitometry can be used.
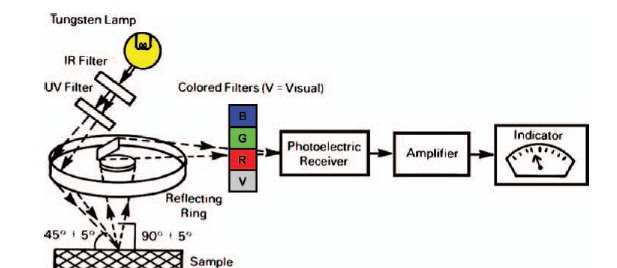
Figure 11-16 Major components of a photoelectric reflection densitometer.
The measurement of reflection color densities requires a significantly different design, as illustrated in Figure 11-16. A tungsten lamp is used to illuminate the sample at an angle of approximately 45°, and the light reflected from the sample is collected over a 5° angle around the perpendicular to the sample. A mirror in the center reflects the light to the receiver after passing through the filter (red, green, or blue) that has been placed in front of the receiver.
Such a design simulates the optimum condition for viewing a reflection image, which is with the illumination striking the image at about a 45° angle with the light that is reflected on the perpendicular being received by the viewer's eye. In practice, however, light reaches the image over a very wide angle as a result of light reflections from the walls, ceilings, floors, etc. Since it is impossible to simulate these conditions in a reflection densitometer, the values that result do not accurately represent most viewing conditions and, as a result, represent an acceptable compromise.
Reflection densitometers can provide useful information about the light-modifying characteristics of reflection photographic images. Additionally, red, green, and blue filters can be used over the receptor to obtain information about the color characteristics of the image.
By far the most commonly used means of determining color densities, integral three filter densities must be interpreted with great care. For example, it is often assumed that a color film will give a good visual neutral if the red, green, and blue densities are equal. In fact, color images with equal red, green, and blue densities usually show a slight color cast. There are at least two reasons for this discrepancy. First, the three dyes that comprise the image each have unwanted absorptions. Second, the overall red, green, and blue response characteristics of the densitometer are considerably different from those of the human eye.
Sensitometry of Color Photographic Materials
The determination of the sensitometric properties of color photographic films and papers essentially involves the same procedures that were discussed in Chapter 5—exposure, processing, image measurement, and data interpretation through the use of characteristic curves. When exposing the film, the sensitome-ter must be equipped with a light source that produces the color temperature for which the color film was designed. Any attenuators (neutral density filters and step tablets) must not depart significantly from neutrality, or they will alter the color balance of the light reaching the film.
Figure 11-17 shows the spectral density curves for a variety of neutral attenuators. Notice that the Wratten neutral density filter shows a higher density at the blue end of the spectrum than at the green or red end. Furthermore, photographic silver step tablets also show a slightly higher blue density. When extreme neutrality is required, as when following ANSI standard methods, M-type carbon attenuators are preferred. These attenuators are composed of carbon particles dispersed in gelatin and coated on an acetate base. Additionally, the Inconel-coated materials (iron alloys evaporated onto glass) provide excellent neutrality in the visible region.
It is important to note that all four of these attenuators depart considerably from neutrality in the ultraviolet region of the spectrum. Furthermore, only the Inconel coated material shows good neutrality in the infrared regions of the spectrum. Thus when selecting filters for specialized work involving either ultraviolet or infrared energy, extreme care must be taken in selecting the attenuators.
The exposure time used in the sen-sitometer must simulate those times that typically will be used with the material in practice. This is to avoid the problem of reciprocity failure. The processing of the sensitometric samples involves either standardized methods (ANSI methods) or techniques used in practice. The manufacturer of the sensitized material is likely the only one to use the standardized methods since this approach would provide information primarily about the emulsion properties. The photographer, however, requires information about the film and its corresponding processing in order to control the quality of the resulting photographic images.
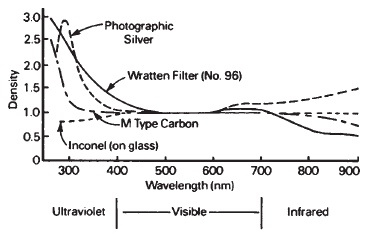
Figure 11-17 Spectral density curves for a variety of neutral attenuators.
Equal red, green, and blue densities in an area of a color photograph do not guarantee that the area will appear neutral.
In both cases, the resulting color photographic image consists of a set of superimposed cyan, magenta, and yellow dyes. As a result, the image measurement method used typically results in three values—the density to red light (Dr), the density to green light (Dg), and the density to blue light (Db), which are referred to as three-filter integral densities. The problems associated with obtaining and interpreting such data have previously been discussed.
Gelatin neutral density filters tend to absorb more blue light than green light or red light, and therefore are not entirely neutral.
Reversal color films are capable of producing considerably higher densities than reflection print materials.
The construction of the characteristic curve for a color film follows the convention discussed in Chapter 5 for black-and-white materials, except that three curves will be plotted for each image instead of one. In cases in which a visual neutral has been formed in the image, it is possible to simply measure the visual density of each step and therefore plot a single curve that is representative of the image. The basic properties of speed and contrast are determined in the evaluation of the resulting curve. The sensitomet-ric characteristics of a variety of color photographic materials follow.
Reversal Color Films
Examples of reversal films include Ektachrome, Kodachrome, Fujichrome, and Agfachrome. The visual density curve for a neutrally exposed and processed reversal color image is shown in Figure 11-18. With a reversal material, increasing amounts of exposure produce decreasing amounts of density in the image. In order to obtain adequate contrast and color saturation in the transparency, the midtone slope is generally between 1.8 and 2.0, which is much higher than for negative materials. Far to the right on the curve is the minimum density, which is the combined result of residual color couplers, stain that was picked up during processing, and the density of the supporting base. The minimum density (visual density) of this area is seldom less than 0.20.
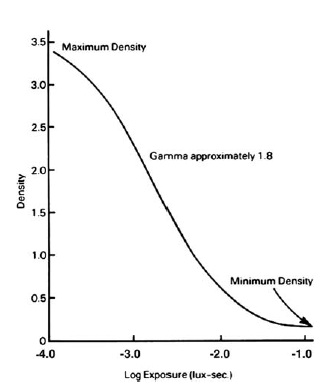
Figure 11-18 Visual density curve from a neutrally exposed and processed reversal color film.
Far to the left of the plot is the shoulder of the curve, where the maximum density, representing no exposure, occurs. For most reversal color films, the maximum density obtainable is at least 3.0, and often greater. Consequently, color transparencies are capable of substantially greater output density ranges (near 3.0) than are reflection print materials. The contrast of reversal films is typically measured as the gamma, with these values usually between 1.80 and 2.0. Additionally, average gradient can be determined between any two points on the curve, and as a result will be different from (lower than) the gamma.
The useful log exposure range of the film is the range of log exposures contained between the minimum and maximum useful densities of the curve. Since the slopes of reversal color films are very steep, they are typically characterized by narrow useful log exposure ranges. Most such films do not exceed a useful log range of 1.90, indicating that an exposure ratio of at best 80:1 can be accommodated. As a result, the amount of exposure latitude (margin for exposure error) is usually quite small.
The speed of a reversal color film is based on the location of two points on the curve that relate to shadow and highlight reproduction, as illustrated in Figure 11-19. Point A relates to highlight reproduction and is located at a density of 0.20 above the minimum density. From this point, a straight line is drawn so that it is tangent to the shoulder of the curve and locates the upper useful point. If this point of tangency falls at a density greater than 2.0, the upper useful point—labeled point B—is simply located at a density of 2.0 above the minimum density. The log exposures are determined for both positions and averaged by adding them and then dividing the sum by 2. The resulting value is termed the minimum log exposure (log Hm). The antilog is taken and used in the following speed formula (Eq. 11-1):
(Eq. 11-1)

Figure 11-19 Location of the speed points in the ISO (ASA) speed method for reversal color film.
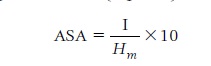
Other sensitometric properties of reversal color films can be evaluated by using red, green, and blue density readings and constructing the corresponding curves, as illustrated in Figure 11-20. These curves are the result of reading a visually neutral color film image of a sensitometric strip on a densitometer equipped with the status A response functions. Note that the three curves are not exactly superimposed, indicating that although the image is a visual neutral, it is not a densitomet-ric neutral. Because these curves were derived from a visually neutral strip, they can be used as a reference against which future strips can be compared in order to detect changes in image color.
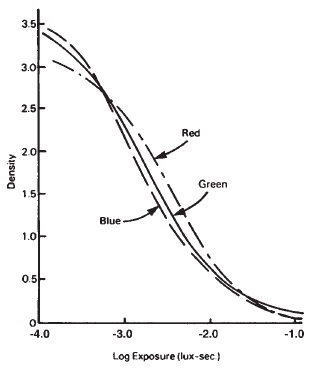
Figure 11-20 Red, green, and blue status A density curves from a neutrally exposed and processed reversal color film. This image is a visual neutral. Because the response of the densitometer is different from that of the human eye, the curves are not superimposed (that is, the image is not a densitometric neutral).
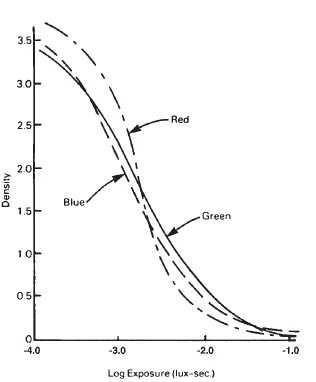
Figure 11-21 Red, green, and blue status A density curves from a non-neutral reversal color image. Since the red curve is significantly higher in the shoulder region, the shadows in the photograph would have a cyan cast. The highlights would show a reddish cast because the red curve is much lower in the toe region.
For example, Figure 11-21 illustrates the red, green, and blue status A curves for a second strip. The shape of the red density curve is considerably different from that in Figure 11-20— the principal difference being an increase in the gamma. Such a condition is referred to as crossed curves and is generally related to problems in the film processing. In this image, the shadows would probably appear somewhat cyan because of the high red density, and the highlights would likely contain a red cast because of the lowered red density (indicating less cyan dye) in that region. The resulting color transparency would likely have unacceptable color quality.
The speed of reversal color films is calculated from the average of the log exposures required to produce two different densities.
The term crossed curves refers to a lack of parallelism of the red-green-blue characteristic curves.
Figure 11-22 illustrates the red, green, and blue status-A curves for a third strip. In this case, the shapes of all three curves are approximately the same, except the blue density curve is displaced to the right. Thus there is an increase in blue density everywhere in the image. The image corresponding to the curves in Figure 11-22 would likely show an overall yellow-colored cast. Such an image could result from exposing a reversal color film balanced for daylight (5500 K) to a tungsten light source without the proper filtration.
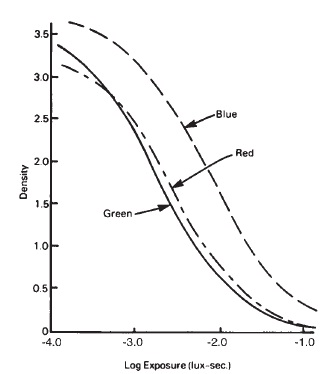
Figure 11-22 Red, green, and blue status A density curves from a non-neutral reversal color image. The image shows a high density to blue light in all regions and thus would appear yellow.
Negative Color Films
Examples of negative color films include Kodak PORTRA and ULTRA color films and Fujicolor Portrait and Press films. Color-negative films, sometimes referred to as color print films because prints are made from them, employ the traditional integral-tripack assembly. However, many modern-day films have double-coated emulsions in each of the three spectral bands to improve latitude and film speed. The spectral responses of the emulsions are selected principally for the ability to produce optimum color reproduction in the final color reflection print. Since the color negative represents only an intermediate step in the system, it makes no difference what the actual colors of the negative are, as long as they are matched to the properties of the color print material. This allows for the use of integral color masking, as discussed previously, which gives an overall orange cast to the negative.
The product of a set of neutral exposures and normal processing of the color negative material is a scale of non-neutral densities. The resulting sensitometric strip is evaluated by measuring the red, green, and blue densities on a densitometer equipped with the status M response functions. The red, green, and blue density plots for a sensitometric test of a typical negative color film are shown in Figure 11-23. The graph indicates that increasing amounts of exposure give increasing amounts of density, as is the case for negative-working materials.
Additionally, the slopes of the three curves are considerably less than those of a reversal color film, resulting in an increase in the exposure latitude. The three curves are separated vertically, because of the orange-colored integral mask in the image. The minimum densities for the curves are located at the far left of the graph and consist of the integral mask density, emulsion fog, residual color couplers, processing stain, and base density. The density to blue light is always the highest of the three because of the principal absorption of the yellow dye, the blue absorption of the integral mask, and the unwanted blue absorptions of the magenta and cyan dyes. Since the yellow and magenta dyes have only low absorptions to red light, the density to red light is generally the lowest of the three, resulting mostly from the cyan dye. It is sometimes assumed, erroneously, that the blue curve is the highest because it is the top emulsion layer, and the red curve is the lowest because it is the bottom layer of the three. The order in which the emulsion layers are coated has absolutely no effect upon the red, green, and blue light-stopping ability of the image that is formed in the emulsion. This is a result of the nature of the dye set and the integral color mask in the color negative.

Figure 11-23 Red, green, and blue status M density curves from a neutrally exposed and processed negative color film. The integral color-correcting mask gives the image an overall orange cast, causing the curves to be vertically displaced.
The contrast of color-negative films is generally determined by measuring the slope of the straight-line portion (gamma), which typically lies between 0.50 and 0.60. As with the black-and-white negative-positive process, the color negative has a relatively low slope and large exposure latitude, allowing for a variety of subject contrast. The lowered slope of the negative is compensated for in the printing stage by using print materials with steep slopes. Theoretically, the slopes of the three curves should be equal over their entire length to avoid undesirable shifts in color balance between the shadows and the highlights. However, practical experience indicates that some divergence in slopes can be tolerated, depending to a great extent upon the nature of the scene.
The speed of a color negative film is derived from locating the minimum useful points (0.15 above the minimum density) on the green status M density curve and on the slowest of the three status M density curves. Since the slowest curve invariably is the red status M density curve, it is the green and red status M density curves that are used. The log exposure (in lux-seconds) at each speed point is determined and averaged. The antilog of the resulting log H value (Hm) is then used in the following formula (Eq. 11-2):
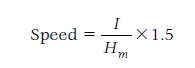
(Eq. 11-2)
The blue status M density curve is not used to determine film speed, because it is the fastest of the three and would produce a slightly inflated speed.
The red-green-blue characteristic curves for typical color negative materials are displaced vertically because of the absorption of blue light and green light by the color-correcting mask.
Since three filter color densities do not give precise information about either visual appearance or printing characteristics, such data for color negatives must be interpreted with the same care as discussed previously with reversal color images. Nevertheless, it is possible to make meaningful inferences about the printing properties when there are large differences between the aim curve shapes and those actually encountered. For example, the red, green, and blue status M-density curves in Figure 11-24 illustrate the sensitometric results of overdevelopment of a color negative. Comparing these curves to those shown in Figure 11-23 (normal processing conditions) reveals that the extended development time produces a noticeably higher contrast in the blue density plot.
Such a change in curve shape would lead to the problem of crossed curves, with the negative producing a color print with a noticeable color shift between the shadows and the highlights (that is, the shadows would have a yellowish cast, while the highlights would have a bluish cast). This problem can be illustrated graphically by superimposing the red, green, and blue density curves, which is essentially what happens when the negative is printed on conventional color print material using supplementary filtration in the enlarger.
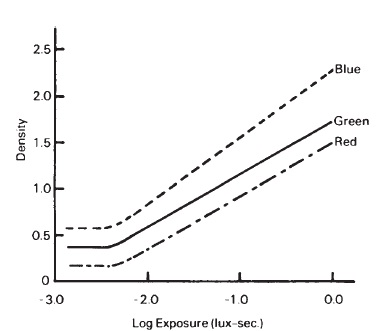
Figure 11-24 Red, green, and blue status M density curves from a neutrally exposed negative color film that was overdeveloped. Notice the increased slope of the blue density curve.
Figure 11-25A illustrates how the red, green, and blue density curves exactly superimpose for a normally exposed and processed color negative. Figure 11-25B illustrates what happens when an attempt is made to balance the color negative shown in Figure 11-24. Notice that the blue density curve is steeper, and if a midtone is printed to a neutral, as shown here, the blue light density in the shadows will be low, producing larger amounts of yellow dye in the print. The blue density in the highlights will be higher, resulting in a lack of yellow dye (a bluish cast) in the highlights. Thus when the red, green, and blue density curves are severely crossed, excellent color prints cannot be obtained.
Photographic Color Paper
In the other half of the negative-positive process, a color reflection print is made from the negative. Therefore, the properties of color photographic papers depend primarily upon the characteristics of the negatives to be printed. For example, the spectral sensitivities of the paper emulsions are typically matched to the spectral absorptions of the dyes in a color negative, thus allowing for optimum color reproduction. The inherent color balance of the color paper emulsion is designed so that using a tungsten enlarging lamp in combination with the red-, green-, and blue-light-stopping abilities of a typical color negative will result in a properly balanced color print with a minimum of supplementary filtration. Furthermore, by making the paper's red-sensitive layer the slowest, the use of supplemental cyan filtration with its unwanted absorptions can be avoided.
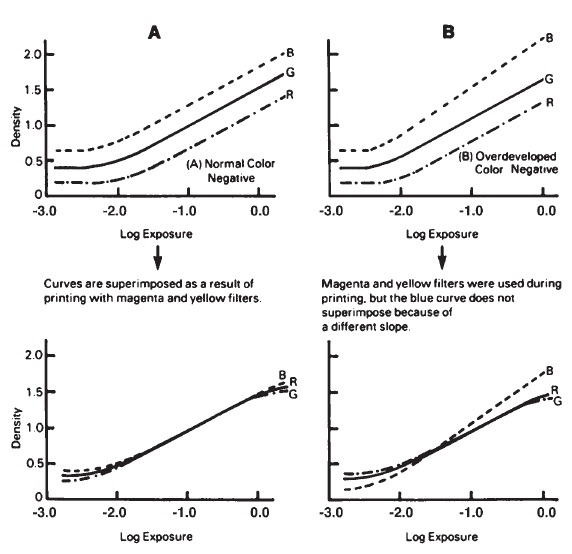
Figure 11-25 The sensitometric effects of printing color negatives in an enlarger using supplementary filtration. The curves in graph A are from a color negative with proper contrast in all three layers. The use of supplementary magenta and yellow filters in the printer brings the curves into nearly exact alignment, as shown at the bottom of graph A. The curves in graph B are from a negative with high blue contrast and normal green and red contrast. When this negative is printed, there is no combination of filters that can eliminate the mismatch seen in graph B, bottom.
If a color reflection paper is exposed and processed to produce a scale of visual neutrals, the visual densities of the steps can be measured and a characteristic curve constructed as shown in Figure 11-26. Notice that the curve shape is very similar to that of black-and-white reflection print material. The steep slope in the curve's midsection is necessary to expand the midtones, which were compressed in the negative as a result of the lowered slope in the negative. The result is a print with the desired tone reproduction characteristics, as discussed in Chapter 6.
Notice that the maximum density of color paper is somewhat greater than that of a black-and-white reflection paper. This is principally due to multiple internal reflections between the emulsion layers in the color paper, which cause less light to be reflected from the print. Since there are no standard methods for determining the speed and contrast of color print materials, there exists no common method for determining these properties. However, since the characteristics of color and black-and-white reflection print materials are similar, the same methods may be used.
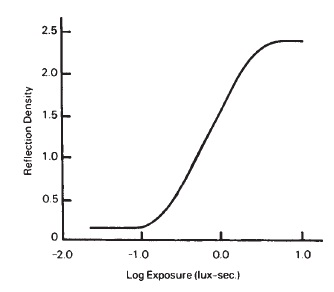
Figure 11-26 Visual density curve from a neutrally exposed and processed reflection color print material.
The color sensitivities of the three emulsion layers of color printing papers are controlled during manufacture so that it will not be necessary to use the inefficient cyan filters when printing.
On this basis, the useful log exposure range for a conventional color reflection print material turns out to be approximately 1.15 to 1.25 (current ANSI standard paper range of 120), indicating that it is similar to a contrast grade 2 black-and-white printing paper. Also, the ANSI standard paper speed is approximately 100, indicating that this is a medium-speed paper. Such information is of little practical use, because color print materials are invariably balanced individually when the negative is printed. In effect, individual tests are performed for each negative/ print combination, minimizing the need for standardized values of speed and contrast.
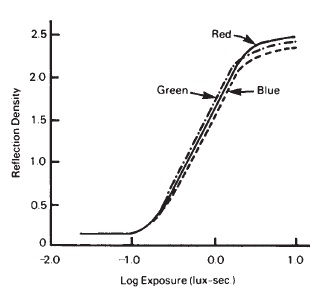
Figure 11-27 Red, green, and blue status-A curves from a neutrally exposed and processe reflection color print material. The image is a visual neutral.
Figure 11-27 illustrates the red, green, and blue status-A density curves for the same scale of visual neutrals. Again, notice that the three curves are not exactly superimposed, indicating that a set of visual neutrals is not the same as a set of densitometric neutrals. The inherent sensitivity of the red, green, and blue layers is illustrated in Figure 11-28, where it can be seen that the blue-sensitive and green-sensitive layers are faster (displaced to the left) than the red-sensitive layer. This is in part to compensate for the integral mask incorporated in the negative, which has a high density to blue and green light. Also, because the tungsten lamps used in color enlargers are rich in red light, the paper speed in this region can be reduced.
Thus by matching the speeds of the three layers of the color print material to the red light, green light, and blue light stopping characteristics of the integral mask in the color negative, minimum amounts of supplementary filtration will be required to obtain optimum color reproduction. In essence, the three curves illustrated in Figure 11-28 will be superimposed as they appear in Figure 11-27, as a result of the filtration caused by the integral orange mask and the supplementary filtration in the printer.

Figure 11-28 Red, green, and blue status-A curves from reflection color print paper balanced for an orange mask but printed without it. Thus the actual speeds of the three layers are revealed. The blue-sensitive and green-sensitive layers are the fastest, which compensates for the high blue and green densities of the orange negative mask.
REVIEW QUESTIONS
- The major physical reason why color photographs cannot exactly duplicate subject colors is that . . .
- photographic lenses alter the color balance of the image-forming light.
- there is variability in the processing of color films
- there is variability in the manufacture of color films
- existing dyes have limitations
- The subtractive primary colors absorb . . .
- red, green, and blue light
- cyan, magenta, and yellow light
- In comparison with daylight-reversal color films, tungsten-reversal color films have . . .
- relatively low red sensitivity
- relatively high red sensitivity
- about the same red sensitivity
- The poorest of the three dyes, with respect to unwanted absorption, is the . . .
- yellow dye
- magenta dye
- cyan dye
- A practical method of obtaining analytical densities with integral tripack color film such as Ektachrome is to . . .
- expose only a single emulsion layer.
- develop only a single emulsion layer
- expose and develop all three emulsion layers and then bleach the dyes in two layers
- isolate one of the three dye layers by using a filter on the densitometer
- The illumination system in reflection densitometers is based on the assumption that when prints are displayed they are illuminated . . .
- directly from the front
- at an angle of 45 degrees
- uniformly from all angles
- The gamma of reversal color films is typically about . . .
- 0.7
- 1.0
- 1.2
- 1.4
- 1.9
- Assuming that the red, green, and blue curves for a reversal color film should be superimposed for a neutral color balance, a transparency represented by a set of curves with the red curve higher than the other two would appear too . . .
- red
- green
- blue
- cyan
- magenta
- The gammas of negative color film curves . . .
- somewhat lower than the gammas of reversal color films
- about the same as the gammas of reversal color films
- somewhat higher than the gammas of reversal color films
- The color balance of color printing papers is controlled during manufacture so that when exposing the paper it is usually not necessary to use a . . .
- cyan filter
- magenta filter
- yellow filter