
16
The Plot Thickens
In This Chapter
![]() Configuring printers and plotters
Configuring printers and plotters
![]() Plotting model space
Plotting model space
![]() Plotting to scale
Plotting to scale
![]() Plotting paper space layouts
Plotting paper space layouts
![]() Plotting with lineweights and colors
Plotting with lineweights and colors
![]() Controlling plotters with plot styles
Controlling plotters with plot styles
![]() Troubleshooting plots
Troubleshooting plots
Despite the infinitesimally small number of offices without a computer (or two) on every desk or in a pocket, many people still want or need to work with easily readable electronic drawings (can you spell P-D-F?) or dead-tree paper drawings. You may need to give hard-copy printouts or PDF files to less savvy colleagues who don’t have AutoCAD, or to people on construction sites where relatively delicate computers wouldn’t survive long. You may want to print hard copies to review during your bus ride home. You may even find that checking drawings the old-fashioned way, with a hard-copy printout and a red pencil, turns up errors that managed to remain hidden on the computer screen.
Hard copies may also survive longer as historic records. Some 10-year-old CAD files can no longer be opened because the company that produced the software that was used to create them no longer exists, and the software won’t run on current operating systems. On the other hand, for the ultimate in hard copies, we can still read Egyptian stone obelisks that are several thousand years old.
Whatever the reason, you’ll want to print drawings at some point (sooner rather than later). Depending on where you are in a project, plotting is the pop quiz, midterm, or final exam of your drawing-making semester. This chapter helps you ace the test.
You Say “Printing,” We Say “Plotting”
Plotting originally meant creating hard-copy output on a device that was capable of printing on larger sheets, such as D size or E size (or A1 or A0 for the metrically inclined), that measure several feet (or a meter or more) on a side. These plotters often used pens to draw, robot-fashion, on large sheets of vellum or drafting film. The sheets could then be run through diazo blueline machines, which were copying machines that created blueline prints to create less-expensive copies. Printing meant creating hard-copy output on ordinary printers that used ordinary-sized paper, such as A size (letter size, 81⁄2 x 11 inches) or B size (tabloid or ledger size, 11 x 17 inches): A4 or A3, for you metric folk.
Nowadays, AutoCAD and most CAD users make no distinction between plotting and printing. AutoCAD veterans usually say “plotting,” so if you want to be cool, you can do so, too.
Whatever you call it, plotting an AutoCAD drawing is potentially more complicated than printing a word-processing document or a spreadsheet. CAD has a larger range of different plotters and printers, drawing types, paper sizes, and output procedures than other computer applications. AutoCAD tries to help you tame the vast jungle of plotting permutations, but you’ll probably find that you have to take some time to get the lay of the land and clear a path to the hard copy output you want. After you find the sweet spot, plotting becomes quite routine.
The Plot Quickens
Even if you already realize that you won’t master AutoCAD plotting in five minutes flat, your boss, employee, spouse, construction foreman, or 11-year-old daughter may still want a quick check plot of your drawing.
Plotting success in 16 steps
Here’s the quick, cut-to-the-chase section for plotting a simple drawing — a mere 16 steps! This isn’t as bad as it sounds, however, because you can later see how to save your printing steps so that you can reuse them with considerably less effort. For the purpose of this section, we’re assuming that you plot in model space: that is, that clicking the Model button on the status bar shows you the drawing in a way you want to plot. (We cover plotting paper space layout tabs in the later section “Plotting the Layout of the Land.”) This section doesn’t deal with controlling plotted lineweights; see the “Plotting Lineweights and Colors” section, later in this chapter, for those details. It should, however, result in a piece of paper that bears some resemblance to the information that AutoCAD displays on your computer monitor.
Follow these steps to make a simple, not-to-scale, monochrome (black-and-white) plot of a drawing:
1. Open the drawing in AutoCAD.
 2. Click the Model tab to ensure that you’re plotting the model space contents.
If you don’t have the Model and Layout tabs displayed, click the Model button (not the MODEL/PAPER button) on the status bar.
We explain model space and paper space in Chapter 12, and how to plot paper space layouts in the section “Plotting the Layout of the Land,” later in this chapter.
3. Zoom to the drawing’s current extents.
Click the Zoom Extents button on the Navigation bar. (If necessary, click the tiny down arrow below the Zoom button, and choose Zoom Extents from the menu.) Or easier yet, type Z E (note the space between the letters) and then press Enter.
The extents of a drawing consist of a rectangular area just large enough to include all objects in the drawing.
![]() 4. Click the Plot button on the Quick Access toolbar.
4. Click the Plot button on the Quick Access toolbar.
The Plot dialog box appears, as shown in Figure 16-1.
 AutoCAD automatically appends whatever you’re about to plot in the dialog box’s title bar. For example, in Figure 16-1, the dialog box title is Plot – Layout1. If you have changed the layout name, the dialog box title is Plot – First Floor Plan (or whatever you renamed it). In this book, we call it (simply) “the Plot dialog box.”
5. In the Printer/Plotter area, select a device from the Name drop-down list.
If your computer has a generic printer attached to it, select Default Windows System Printer pc3. If you don’t have a system printer connected, choose Microsoft XPS Document Writer. This step creates a file that can be viewed in Internet Explorer.
6. In the Paper Size area, select a paper size that’s loaded in the printer or plotter.
For most generic Windows desktop printers, it’s Letter (8.5 x 11 inches), ANSI A-size (11 x 8.5 inches), or metric A4 (210mm x 297mm).
7. In the Plot Area area (sponsored by the Department of Redundancy Department), select Extents from the What to Plot drop-down list.
This step plots the entire drawing.
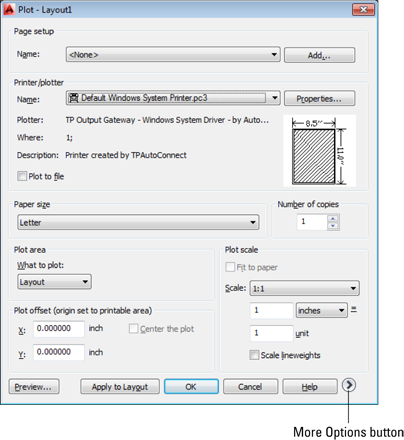
Figure 16-1: The Plot dialog box.
8. In the Plot Offset (Origin Set to Printable Area) area, select the Center the Plot check box.
Alternatively, you can specify offsets of 0 (zero) or other amounts in order to position the plot at a specific location on the paper.
9. In the Plot Scale area, select the Fit to Paper check box.
For most real plotting, you plot to a specific scale. We cover plotting to a specific scale in the “Instead of fit, scale it” section, later in this chapter, for guidance.
 10. Click the More Options button (at the lower-right corner of the dialog box, next to the Help button).
The Plot dialog box reveals additional settings, as shown in Figure 16-2.

Figure 16-2: The expanded Plot dialog box.
11. In the Plot Style Table (Pen Assignments) area, choose monochrome.ctb or monochrome.stb from the drop-down list.
If AutoCAD asks whether to assign this plot style table to all layouts, click No for now.
12. In the Plot Options area, make sure that the Plot with Plot Styles check box is selected and that the Save Changes to Layout check box is deselected. (See Figure 16-2.)
Leaving the Save Changes to Layout check box deselected tells AutoCAD to use any plot settings changes that you make only for this plot. AutoCAD reverts to the original plot settings the next time you plot the drawing.
 After you become confident with plotting, select this check box so that AutoCAD does save your plotting settings changes as the default. Alternatively, click the Apply to Layout button to make the current plot settings the defaults for future plotting of this tab (that is, the Model tab) in this drawing.
13. In the Drawing Orientation area, choose Portrait or Landscape.
The icon (the letter A on a sheet) in the lower-right corner may help you choose the orientation. (If not, see the full preview in Step 14.)
14. Click the Preview button and ensure that the drawing appears on the paper at the correct orientation and size, as shown in Figure 16-3, and then right-click and choose Exit to return to the Plot dialog box.

Figure 16-3: A preview of coming plot-tractions.
15. If you find any problems in the preview, adjust the plot settings (for example, Plot Area, Plot Scale, or Drawing Orientation) and repeat the preview until the plot looks right.
16. Click OK to create the plot.
When AutoCAD finishes generating and sending the plot, it displays the Plot and Publish Job Complete balloon notification from the status bar. To hide these notifications, right-click the Plot/Publish Details Report Available icon near the right end of the status bar and deselect Enable Balloon Notification.
There — only 16 steps, as promised. On the other hand, we never promised that this plot would be usable. For example, if you tried to plot a large, complex D-size or E-size architectural drawing on an A-size sheet of paper, it isn’t readable without a microscope. The bottom line, however, is that you produced a plot! Read the rest of this chapter for all the details about the numerous other plotting options available in AutoCAD. If you had trouble with this plot, jump ahead to the troubleshooting section “The Plot Sickens,” later in this chapter.
Getting with the system
One complication you may face in your attempt to create a hard copy is that AutoCAD has two distinct ways to communicate with plotters and printers. Operating systems, and the programs that run on them, use a special piece of software, the printer driver, to format data for printing and then send it to the printer or plotter. When you configure Windows to recognize a new printer connected to your computer or network, you’re installing the printer’s driver. AutoCAD, like other Windows programs, works with the printers you’ve configured in Windows. AutoCAD calls these system printers because they’re part of the Windows operating system.
But AutoCAD, unlike other Windows programs, can’t leave well enough alone. Some output devices, especially some larger plotters, aren’t controlled efficiently by the Windows system printer drivers. For that reason, AutoCAD comes with specialized non-system drivers (that is, drivers that aren’t installed as part of the Windows system) for plotters from companies such as Hewlett-Packard, Xerox, KIP, and Canon-Océ. These drivers ignore the tidy rules for communicating with Windows printers in order to get things done more accurately and a bit more quickly.
Most of the time, using already configured Windows system printers is easiest, and they work well with many devices, especially devices such as laser and inkjet printers that print on smaller paper. However, if you have a large-format plotter, you may be able to get faster plotting, better plot quality, or more plot features by installing a non-system driver. To find out more, search for your specific plotter using the AutoCAD online Help system.
Configuring your printer
To ensure that AutoCAD recognizes the devices you want to use for plotting, follow these steps:
1. Launch AutoCAD and open an existing drawing or start a new, blank drawing.
2. Choose Options on the Application Menu or type OP and press Enter to open the Options dialog box; then click the Plot and Publish tab.
3. Click the drop-down arrow to view the list just below the Use as Default Output Device option, as shown in Figure 16-4.
The list includes two kinds of device configurations, designated by two tiny, difficult-to-distinguish icons to the left of the device names:
• Windows: A little printer icon with a sheet of white paper coming out the top indicates a Windows system printer configuration.
• Non-system: A little plotter-with-legs icon with a piece of paper coming out the front indicates a non-system (that is, AutoCAD-specific) configuration.
The non-system configuration names always end in .pc3 because they're stored in special AutoCAD Plotter Configuration version 3 files. So, if you can't distinguish the difference between the icons, look for the .pc3 at the end of the name.

Figure 16-4: System and non-system printer configurations.
4. Verify that the list includes the printers and plotters you want to have available in AutoCAD.
If they’re not in the list, how you add one depends on your operating system:
• Windows XP: Choose Start⇒Printers and Faxes, and then click the Add a Printer link under Printer Tasks on the left side of the window.
• Windows Vista: Choose Start⇒Control Panel⇒Hardware and Sound⇒Printers⇒Add a Printer, and then click Add a Local Printer.
• Windows 7: Choose Start⇒Devices and Printers⇒Add a Printer, and then click Add a Local Printer.
• Windows 8: Hold down the Windows key and then press W. In the Search field, enter printers. Under Settings, choose Add Printer.
If your printer isn’t in the default Windows list, cancel the wizard and hunt down a driver disc that came with the printer. Better yet, download the current driver from the printer manufacturer’s website.
5. Choose the output device that you want to designate as the default for new drawings.
6. Click OK to close the dialog box and retain any changes you made in Step 5.
You use the AutoCAD Plotter Manager’s Add-a-Plotter Wizard to create non-system driver configurations. (Choose Plotter Manager on the Plot panel of the Ribbon’s Output tab to display an Explorer window containing a shortcut to the wizard.) This wizard is similar to the Windows Add Printer Wizard; if you can handle adding an ordinary printer in Windows, you can probably handle adding a non-system plotter configuration to AutoCAD. When you complete the wizard’s steps, AutoCAD saves the information in a PC3 (Plotter Configuration version 3) file. If you add an HP Designjet printer or certain Canon-Océ wide-format printers, you’re advised by the Add-a-Plotter Wizard to exit and install the device as a Windows system printer instead. Many people find that the standard drivers work fine, but as we mention later in this chapter, custom drivers may include additional paper sizes as well as other handy settings.
Preview one, two
One key to efficient plotting is the liberal use of AutoCAD’s preview feature. (To maintain political balance, we recommend conservative use of other AutoCAD options elsewhere in this book.)
The postage-stamp-size partial preview in the middle of the Plot dialog box is a quick reality check to ensure that the plot fits on the paper and in the right direction. If the plot area at the current scale is too large for the paper, AutoCAD displays thick, red warning lines along the side(s) of the sheet where the drawing will be truncated.
Click the Preview button to see a full preview in a separate window. You see exactly how the drawing lays out on the paper as well as how the various lineweights, colors, and other object plot properties appear. You can zoom and pan around the preview by using the right-click menu.
 Zooming and panning are simply ways to get a better look at different areas of the plot preview. Neither action affects the area of the drawing that’s plotted.
Instead of fit, scale it
In most plotting situations, you plot to a specific scale rather than let AutoCAD choose an oddball scale that just happens to maximize the drawing on the paper. And if you plan to plot to scale the Model tab of a drawing, you need to know its drawing scale factor. Chapter 4 describes setup concepts, and Chapter 13 provides some tips for determining the scale factor of a drawing that someone else created.
If the drawing was created at a standard scale, such as 1:50 or 1/4" = 1'-0", you simply choose the scale from the handy Scale drop-down list in the Plot dialog box. If the scale isn’t in the list, something is probably wrong, because you should almost always be using standard scales. On the other hand, if you must use a custom scale, type the ratio between plotted distance and AutoCAD drawing distance into the two text boxes below the Scale drop-down list, as shown in Figure 16-5. Usually, the easiest way to express the ratio is to type 1 in the upper box and the drawing scale factor in the lower box. (See Chapter 4 for more information.)
Your CAD manager may have edited the Scale drop-down list to add uncommon scales or remove scales that your company never uses. If you’re designing espresso machines in Milano, for example, you’ll probably never need to plot drawings at 1/128" = 1'-0". (Yes, that scale is on the AutoCAD list.)

Figure 16-5: Lots of ways to scale.
Creating half-size plots for certain purposes is common in some industries. To plot model space at half-size, double the drawing scale factor. For example, a 1/8" = 1'-0" drawing has a drawing scale factor of 96, which is equivalent to a plot scale of 1 = 96. To make a half-size model space plot of it, specify a plot scale of 1 = 192 (or choose 1/16" = 1'-0" from the Scale drop-down list).
Even if you work with drawings created to be plotted at a specific scale, plotting with a Fit to Paper scale may be the most efficient way to make a reduced-size check plot. For example, drafters in your office might create drawings that are plotted on D-size sheets (24 x 36 inches), whereas you have access to a laser printer with a B-size (11 x 17 inches) paper tray. By plotting the D-size drawings scaled to fit on B-size paper, you produce check plots that are slightly smaller than half-size. You can’t measure distances on the check plots with a scale, but you can give them a visual check for overall correctness.
Plotting the Layout of the Land
In the section “Plotting success in 16 steps,” earlier in this chapter, we show you how to plot the model space representation of a drawing by making sure that the Model tab is active when you open the Plot dialog box. In most industries, however, model space plotting went the way of the dodo 20 years ago. Paper space gives you many additional options for controlling the look of the output without having to modify the underlying geometry. So most of the time, you plot a paper space layout instead.
Paper space is the environment that’s specifically designed for outputting hard copy of your drawings. For information on paper space or layouts, see Chapter 12.
As we explain in Chapter 12, AutoCAD gives you two alternative ways of switching between full-screen model space and the paper space layouts stored in the drawing. If you choose to display the Model and Layout tabs, you simply click the appropriate tab to select one. If you have hidden the Model and Layout tabs, use the Model and Layout buttons, plus Quick View Layouts, on the status bar.
Plotting a paper space layout is much like plotting model space except that you first find the appropriate layout and verify that its tab is selected before you open the Plot dialog box. Follow these steps:
 1. Click Quick View Layouts on the status bar and scroll through the image panel.
The Quick View image panel opens in the lower part of the drawing area and displays a preview panel of model space and each layout stored in the drawing.
 You can also display Quick View layouts by hovering the cursor on the drawing tabs at the top of the graphics area.
2. Move the mouse pointer across the images in the Quick View panel, and pause over the image of the layout that you want to plot.
As you move the mouse pointer over each image, icons appear: Publish at the upper-right corner, and Plot at the upper-left. We describe the PUBLISH command briefly in Chapter 20. In this chapter, we stick with PLOT.
3. Click the Plot button in the upper-left corner of the image panel of the layout you want to plot.
The Plot dialog box appears with the name of the layout to be plotted displayed on the title bar. (In Figure 16-6, we’re plotting a layout named D-Size Layout.)
If no layout was previously set up, AutoCAD creates a default layout. (If the Show Page Setup Manager for New Layouts setting on the Display tab of the Options dialog box is turned on, you see the Page Setup Manager dialog box first; just click the Close button.) The default layout probably isn’t useful for real projects, but you can use it to find out about layout plotting. Refer to Chapter 12 for instructions on creating a real layout.
4. Specify a printer/plotter name and a paper size.
If you don’t have a printer capable of producing sheets larger than letter or tabloid size, you can still experiment by selecting a device that outputs to a file, such as DWG To PDF.pc3.
5. In the What to Plot drop-down list, choose Layout, as shown in Figure 16-6.
The Layout option is available only when plotting a layout tab; Limits is available only when plotting the Model tab.
6. Specify the plot offset (such as 0 in both the X and Y directions).
Specifying the plot offset as 0 in both X and Y directions places the lower-left corner of the plotted drawing at the lower-left corner of the printable area.
7. In the Plot Scale area, select 1:1 from the Scale drop-down list, as shown in Figure 16-6.
One primary advantage of using layouts is that you don’t need to know about drawing scale in order to plot the drawing — hence the name paper space. Figure 16-6 shows the proper settings for plotting a layout.
To create a half-size plot of a layout, select 1:2 from the Scale drop-down list. In addition, select the Scale Lineweights check box to reduce lineweights proportionally. (We cover plotting lineweights in the next section.)
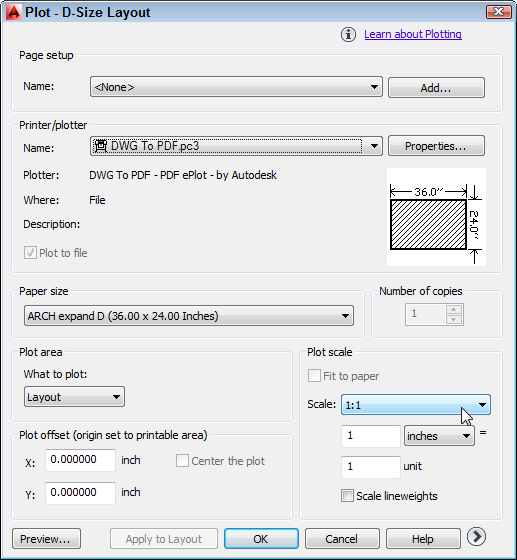
Figure 16-6: Settings for plotting a paper space layout.
If you find that the layout is too big for the plotter’s largest paper size at a plot scale of 1:1, you can select Extents from the What to Plot drop-down list and then select the Fit to Paper check box in the Plot Scale area. Alternatively, you can close the Plot dialog box and fix the problem if you want to have a paper space layout that permanently reflects a new paper size. Use the Page Setup dialog box to modify the layout settings, or copy the layout and modify the new copy.
8. Click the More Options button and change any additional plot options you want.
Refer to Steps 11–13 in the earlier section “Plotting success in 16 steps.”
9. Click the Preview button, ensure that the drawing displays on the paper at the correct orientation and size, right-click, and choose Exit from the menu that appears to return to the Plot dialog box.
If you find any problems in the preview, change the plot settings and preview again until it looks right.
10. Click OK to create the plot.
Plotting Lineweights and Colors
In previous sections of this chapter, we help you gain some plotting confidence. Those sections show you how to create scaled, monochrome plots with uniform lineweights in model space or paper space. Those skills may be all you need, but if you care about controlling plotted lineweights and colors or adding special effects such as screening (plotting shades of gray), read on.
Plotting with style
Plot styles provide a way to override object properties with alternative plot properties. (See Chapter 9 for information about object properties.) The properties include plotted lineweight, plotted color, and screening. Figure 16-7 shows the full range of options. Plot styles come in two exciting flavors:
![]() Color-dependent: Based on the standard way of plotting in earlier versions of AutoCAD (before AutoCAD 2000)
Color-dependent: Based on the standard way of plotting in earlier versions of AutoCAD (before AutoCAD 2000)
![]() Named: Provide a newer (but not necessarily better) way
Named: Provide a newer (but not necessarily better) way
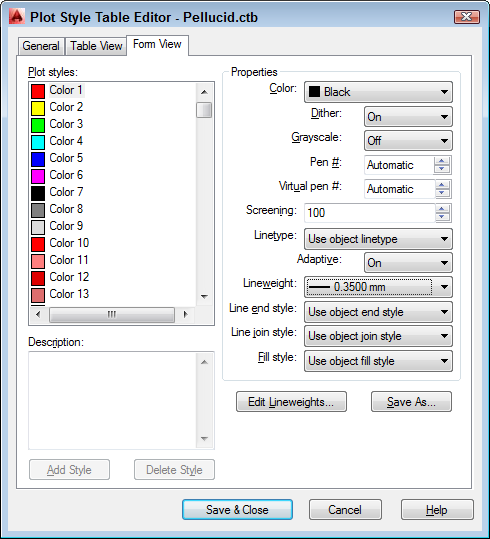
Figure 16-7: Editing a color-dependent plot style table.
You may not need to bother with plot styles. If the drawings you want to plot have layer and object properties (especially lineweights) that reflect how you want objects to plot, you can dispense with plot styles. But most people and most drawings use plot styles, so you should at least be familiar with them.
A couple of common reasons for using plot styles are to
![]() Map screen colors to plotted lineweights. If this idea seems completely loony to you, try to suspend judgment until you read the “Plotting through thick and thin” section, later in this chapter.
Map screen colors to plotted lineweights. If this idea seems completely loony to you, try to suspend judgment until you read the “Plotting through thick and thin” section, later in this chapter.
![]() Create screened lines on monochrome plots. Lines that are screened display in various shades of gray, not black. Drafters sometimes use screened lines to deemphasize secondary objects that otherwise would overwhelm the main objects in the drawing. Screening is expressed as a percentage: 100 percent is completely black, and 0 percent is invisible. (How can you tell when your pen has run out of invisible ink? You can see the writing.) Anyway, on a subdivision layout, you might want to deemphasize all the property and house outlines except one.
Create screened lines on monochrome plots. Lines that are screened display in various shades of gray, not black. Drafters sometimes use screened lines to deemphasize secondary objects that otherwise would overwhelm the main objects in the drawing. Screening is expressed as a percentage: 100 percent is completely black, and 0 percent is invisible. (How can you tell when your pen has run out of invisible ink? You can see the writing.) Anyway, on a subdivision layout, you might want to deemphasize all the property and house outlines except one.
Using plot styles
If you want objects in a drawing to plot with properties that differ from their display properties, you plot with styles. For example, they can plot with different lineweights or colors from the ones you’re using for display purposes. Or you may need to map display colors to plotted lineweights. AutoCAD lets you group lists of plot styles into plot style tables, each of which is stored in a separate file.
Color-based plot styles live in color-dependent plot style table (CTB) files, and they map the 255 AutoCAD display colors to 255 plot styles. AutoCAD automatically attaches these color-dependent plot styles to every object, based on — you guessed it — the object’s color. (Are those AutoCAD programmers brilliant or what?) Color-dependent plot style tables mimic the old color-mapped-to-lineweight plotting approach of AutoCAD R14 and earlier releases; this method remains the most common one in most companies.
The named plot style, introduced in AutoCAD 2000, is an object property, just like color, linetype, and lineweight. Named plot styles live in (wouldn’t you know it?) named plot style table (STB) files. After you create a new named plot style table, you add one or more plot styles and give them any names you like. Then you can assign the named plot styles to layers or to individual objects. (See Chapter 9 for more information about object and layer properties.)
To use the plot styles in a plot style table (whether they’re color-dependent or named), you must attach the plot style table to model space or a paper space layout. The attached plot style table affects plotting only for that model space or layout. This approach lets you plot the same drawing in different ways by attaching different plot styles to different tabs — one plot style per layout tab, one plot style table per drawing.
You can attach a plot style to model space or a paper space layout by selecting its image in the Quick View Layouts panel and opening the Plot dialog box; or by right-clicking an image, choosing Page Setup Manager, and then clicking the Modify button. Choose the plot style table name from the Plot Style Table (Pen Assignments) area of the expanded Page Setup or Plot dialog box. See the section “Controlling plotted lineweights with screen colors,” later in this chapter, for an example.
When you start a new drawing in the usual way by using a template drawing (see Chapter 4), the template drawing’s plot style behavior determines whether you can choose CTB or STB files. If you want to change from color-dependent plot styles to named plot styles (or vice versa) in a particular drawing, use the CONVERTPSTYLES command.
The CONVERTPSTYLES command can handle styles that contain spaces in their names.
Creating plot styles
If you’re lucky, someone will provide you with the plot files you need. If that’s the case, you must put the CTB or STB files in the Plot Styles folder for AutoCAD to recognize them. (To find the location of the Plot Styles folder, open the Options dialog box, select the Files tab, and look for the Printer Support File Path⇒Plot Style Table Search Path setting.)
If you’re unlucky, you need to be smart enough to know how to create your own plot style table files. (Personally, we’d rather be lucky than smart; hey, it’s worked so far in life!) Here’s how to create plot style table files:
![]() 1. Click the Application button to open the Application Menu, click Print, and then choose Manage Plot Styles.
1. Click the Application button to open the Application Menu, click Print, and then choose Manage Plot Styles.
Use the tiny down arrow at the bottom of the list to scroll farther down, if necessary. The Plot Styles folder opens in a separate Windows Explorer window.
2. Double-click the Add-a-Plot Style Table Wizard program shortcut.
3. Read the opening screen and then click Next.
4. On the Add Plot Style Table – Begin page, choose the Start from Scratch option or one of the other three options if you want to start with settings from another file. Then click Next.
The remaining steps assume that you chose Start from Scratch. If you chose another option, simply follow the wizard’s prompts.
If the creator of a drawing provides you with an AutoCAD R14/AutoCAD LT 98 PC2 (version 2) or AutoCAD R12/AutoCAD LT 95 PCP (version 1) file, choose the Use a PCP or PC2 File option. With this option, the wizard imports color-to-plotted-lineweight settings automatically.
5. On the Add Plot Style Table – Pick Plot Style Table page, choose whether you want to create a color-dependent plot style table (CTB file) or a named plot style table (STB file). Then click Next.
Choose Color-Dependent Plot Style Table to map screen colors to plotted lineweights. Choose Named Plot Style Table to create named plot styles that you can apply to layers or objects.
6. On the Add Plot Style Table – File Name page, type a name for the new CTB or STB file and then click Next.
7. Click the Plot Style Table Editor button on the Add Plot Style Table – Finish page.
The Plot Style Table Editor dialog box opens to the Form View tab if you’re creating a color-dependent plot style table (refer to Figure 16-7), or to the Table View tab if you create a named plot style table.
If you choose a named plot style in Step 5, the Plot Style Table Editor dialog box opens in Table view, with one plot style named Normal in the first data column, a blank column to its right, and Add Style and Delete Style buttons at the bottom. New named plot styles that you create continue to be added in columns to the right of the previous column. For more information, click the Help button in the Plot Style Table Editor.
8. If you created a color-dependent plot style table, assign Lineweight, Screening, or other plot properties to each color that’s used in the drawing. If you created a named plot style table, click the Add Style button and then assign plot properties to each of the named styles you create.
To determine which colors are used in a drawing, switch to the AutoCAD window and open the Layer Properties Manager palette by clicking the Layer Properties button, located on the Layers panel of the Ribbon’s Home tab.
To change a setting for all colors or named styles, select them all first by clicking the first color or named style, holding down the Shift key, scrolling to the end of the list, and then clicking the last color or named style. Any subsequent changes you make are applied to all the selected colors or named styles.
9. Click the Save & Close button to close the Plot Style Table Editor dialog box. Then click Finish to complete the steps in the wizard.
The Plot Styles folder now displays the new CTB or STB file.
10. Close the Plot Styles folder by clicking the X on its title bar.
Creating a plot style table the first time can be a harrowing experience because you have many options. Just remember that the most likely reason for creating one is to map screen colors to plotted lineweights (as we describe in greater detail in the next section). Also remember that you may be able to minimize your effort by getting a CTB or STB file from the person who created the drawing you want to plot.
In Chapter 9, we recommend limiting yourself to the first nine standard AutoCAD colors when defining layers, and not a patchwork of the 16.7 million colors that AutoCAD makes available. If you follow our advice, your work to create a color-dependent plot style table is greatly reduced because you have to assign plot properties for only nine colors rather than worry about hundreds of them.
For systematic testing of CTB files, you can download the file named plot_screening_and_fill_patterns.dwg from the AutoCAD 2010 Sample Files group at www.autodesk.com/autocad-samples. (AutoCAD LT users, help yourselves to this file too; it isn't included with the AutoCAD LT sample files.) This drawing shows an array of color swatches for all 255 AutoCAD colors. The layouts (such as Grayscale and Screening 25%) demonstrate how different CTB files attached to the same layout produce radically different results.
 Named plot styles hold a lot of promise, but in at least a couple of places (such as dimensions and tables, for example), they don’t work as well as traditional color-based plotting. Dimension properties allow you to assign different colors to dimension lines, extension lines, and text. The purpose is to allow different parts of a dimension object to print with different lineweights; for example, you can have dimension text print with a medium lineweight, the same as the annotation text, while retaining the fine lineweight of extension and dimension lines. But because named plot styles are based on objects or layers, you don’t have that lineweight control over individual dimension components. The same limitation applies to tables, where you can set text to be one color and grid lines to be another.
If you get carried away and decide to take advantage of the 16 million colors (or so) in the AutoCAD True Color or Color Book modes, you won’t control lineweights with color-dependent plot styles. CTB plot styles affect the lineweights only of objects that use the traditional 255 colors of the AutoCAD Color Index set. If you want True Color or Color Book colors, use object lineweights or named plot styles to control the plotted lineweight.
Plotting through thick and thin
Long ago, manual drafters developed the practice of drawing lines of different widths (lineweights) to distinguish different kinds of objects. Manual drafters did it with different technical ink pen nib diameters or with different hardnesses of pencil lead and varying degrees of pressure on the pencil. Because a computer mouse usually doesn’t come supplied with mouse balls of different diameters (and we’re going to resist the urge to jump in with a comment about mouse reproduction, especially now that most mice are of the optical variety), AutoCAD developers had to figure out how to let users indicate lineweights onscreen and on plots. They came up with two different ways to indicate lineweight:
![]() Mapping onscreen colors to plotted lineweights: We describe this common approach in Chapter 9.
Mapping onscreen colors to plotted lineweights: We describe this common approach in Chapter 9.
![]() Displaying lineweights onscreen to match what the user can expect to see on the plot: This approach appeared in AutoCAD 2000.
Displaying lineweights onscreen to match what the user can expect to see on the plot: This approach appeared in AutoCAD 2000.
Controlling plotted lineweights with object lineweights
Plotting object lineweights is trivial, assuming that the person who created the drawing first assigned a lineweight property to layers or objects. (See Chapter 9 for details.) Just make sure that the Plot Object Lineweights check box in the expanded Plot dialog box is selected. You can also deselect the Plot with Plot Styles check box because plot styles can override the object lineweights with different plotted lineweights. You can also make these settings in the Page Setup dialog box for the appropriate Layout or Model tab. To access the Page Setup Manager, right-click the Quick View Layouts button on the status bar and choose Page Setup Manager.
If you want object lineweights to control plotted lineweights, make sure that the Plot Object Lineweights check box is selected in the Plot Options area of the Plot or Page Setup dialog box. If you don’t want to plot the lineweights assigned to objects, you must deselect both the Plot Object Lineweights and Plot with Plot Styles check boxes in the Plot or Page Setup dialog box. Selecting Plot with Plot Styles selects Plot Object Lineweights as well.
Controlling plotted lineweights with screen colors
To map screen colors to plotted lineweights, you need a color-dependent plot style table (CTB file). If you’re plotting a drawing created by someone else, that person may be able to supply you with the appropriate CTB file, or at least with a PCP or PC2 file from which you can create the CTB file quickly. The creator of the drawing should be able to supply at least a printed chart showing which plotted lineweight to assign to each AutoCAD screen color. Use the steps in the earlier section “Plotting with style” to copy or create the required CTB file.
Unfortunately, no industry-wide standards exist for mapping screen colors to plotted lineweights. Different offices do it differently. That’s why it’s useful to receive a CTB, PCP, or PC2 file with drawings that someone sends you. If they use eTransmit, the plot style tables and plotter configuration files are included in the package.
After you have the appropriate CTB file stored in the Plot Styles folder, follow these steps to use it:
1. Click the Quick View Layouts button on the status bar to open the Quick View Layouts panel. Move the mouse pointer to the image of model space or the layout that you want to plot.
As you move the pointer over each image panel, icons for the PLOT and PUBLISH commands appear at the upper corners.
2. Click the Plot button in the upper-left corner of the selected image.
The Plot dialog box opens. Click the More Options button if the dialog box doesn’t open in Expanded mode, as shown in Figure 16-8.
3. In the Plot Style Table (Pen Assignments) area in the Plot dialog box, select the CTB file from the drop-down list. (See Figure 16-8.)
The plot style table (CTB file) is attached to the layout or model space tab that you clicked in Step 1.
If the drawing uses a named plot style table instead of a color-dependent plot style table, select an STB file instead of a CTB file.
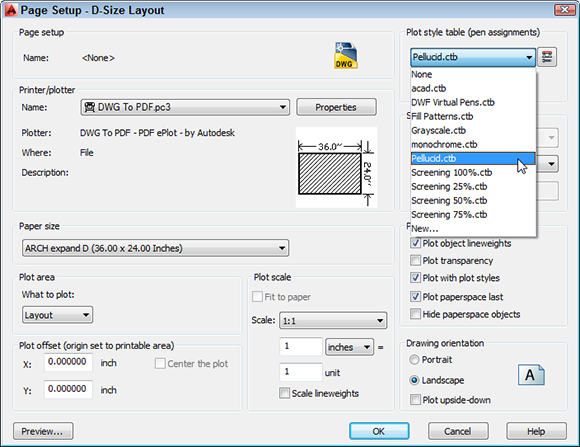
Figure 16-8: Selecting a plot style table that maps screen colors to plotted lineweights.
4. Click the Apply to Layout button.
AutoCAD records the plot setting change with the current layout’s configuration information. Assuming that you save the drawing, AutoCAD uses the CTB you selected as the default plot style when you (or other people) plot this layout in the future.
5. Continue with the plotting procedures described earlier in this chapter.
You can tell whether the current drawing was set up to use color-dependent plot styles or named plot styles by looking at the Properties panel on the Ribbon’s Home tab. If the upper-right drop-down list is grayed out, shows ByColor, and doesn’t display a tooltip, the drawing uses color-dependent plot styles. If this list isn’t grayed out and displays the Plot Style tooltip, the drawing uses named plot styles.
Plotting in color
Plotting the colors you see onscreen requires no special tricks. In the absence of a plot style table (that is, if you selected None from the drop-down list in the Plot Style Table [Pen Assignments] area in the Plot or Page Setup dialog box), AutoCAD sends color information as it appears onscreen to the plotter. As long as the output device can plot in color, what you see should be what you get.
If you attach a plot style table to the layout you’re plotting (as described in the preceding section), you can choose to map screen colors to different plotted colors. In most cases, you don’t want that kind of confusion. Instead, leave the Color property in the plot style table set to Use Object Color.
If your goal is not to plot color, verify that the Color property for all plot styles is set to Black. If you try to plot colors on a monochrome device, you may find that objects appear in various shades of gray, with some colors mapped to lighter shades of gray and others to darker shades of gray. This process of mapping colors to shades of gray is dithering, and it usually is not what you want in a CAD drawing. To override it, use the Plot Style Table Editor, as described in the earlier section "Creating plot styles," to set the Color option for all colors to Black. (The default setting is Use Object Color.) If you don't already have a plot style table to use, select monochrome.ctb for color-based plot styles or select monochrome.stb for named plot styles (both of which come with AutoCAD) from the drop-down list in the Plot Style Table (Pen Assignments) area of the Plot dialog box.
To see the full range of AutoCAD colors available on a plotter, or to see how a particular plot style table affects plotting, open and then plot the sample file plot_screening_and_fill_patterns.dwg, which you can download from www.autodesk.com/autocad-samples. The Screening 100% layout in this drawing contains color swatches for all 255 AutoCAD colors (and this file is available to AutoCAD LT users as well).
It’s a (Page) Setup!
Page setups specify the plotter, paper size, and other plot settings that you use to plot a particular layout or the model space of a drawing. AutoCAD maintains separate page setups for model space and for each paper space layout. When you click the Apply to Layout button in the Plot dialog box (or select the Save Changes to Layout check box and then click OK to plot), AutoCAD stores the current plot settings as the page setup for the current layout.
You can also name page setups and save them. Then you can switch quickly between different plot settings and copy plot settings from one drawing layout to another. Named page setups are stored with each drawing, but you can copy them from another drawing into the current one with the Page Setup Manager dialog box (described later in this section).
If you want to get fancy, you can create named page setups in order to plot the same layout (or model space) in different ways, or to copy plot settings from one layout to another or one drawing to another. Click the Add button in the Page Setup area of the Plot dialog box to create a named page setup from the current plot settings. After you create a named page setup, you can restore its plot settings by choosing it from the Page Setup Name drop-down list.
For even greater control, right-click Quick View Layouts on the status bar and choose Page Setup Manager to create, change, and copy page setups. In the Page Setup Manager dialog box, as shown in Figure 16-9, you can create new page setups and modify existing ones. Click the Modify button to open the Page Setup dialog box, which is almost identical to the Plot dialog box. The primary difference is that you’re changing plot settings rather than actually plotting. The Set Current button copies the page setup that you’ve selected on the Page Setups list to the current layout tab. With the Import button, you can copy a page setup from another drawing or drawing template (DWT) file.
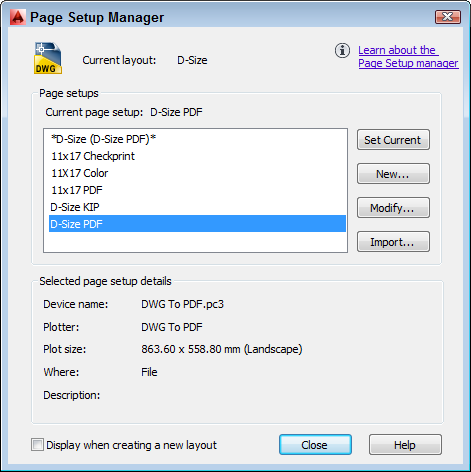
Figure 16-9: The Page Setup Manager dialog box.
Continuing the Plot Dialog
Earlier in this chapter, we cover several important options in the Plot dialog box. This section reveals finer points to simplify your plotting life. We don’t cover every minute, obscure, useful-only-at-cocktail-party-discussions detail. (And if this sounds like your kind of cocktail party, remind us that we’re busy that night.) We point out some occasionally useful options to help increase your vocabulary when you’re communicating with the Plot dialog box.
Use the tooltips in the Plot dialog box to find out more about any part of the dialog box:
1. Hover the mouse pointer over the part of the dialog box that you want to know more about.
2. Press F1 or click the Help button at the bottom of the dialog box if the pop-up help isn’t helpful.
3. For a more conceptual take on plotting, click the Learn about Plotting link to view the Quick Start to Plotting section of the online Help system.
The following list explains most of the remaining controls, check boxes, and lists in the Plot dialog box:
![]() Printer/Plotter: As we describe in the earlier section “Configuring your printer,” you use the Name drop-down list to select the Windows system printer or non-system driver configuration that you want to use for plotting.
Printer/Plotter: As we describe in the earlier section “Configuring your printer,” you use the Name drop-down list to select the Windows system printer or non-system driver configuration that you want to use for plotting.
Clicking the Properties button opens the Plotter Configuration Editor dialog box, with which you can change media (type of paper) and other properties that are unique to the selected plotter or printer. In particular, you can define custom paper sizes.
As if AutoCAD's Plot dialog box settings weren't overwhelming enough, depending on the plot device you may also have to deal with the Plotter Configuration Editor dialog box. Some plotter drivers hide important settings in this dialog box. To access them, you typically click the Custom Properties button near the bottom of the Plotter Configuration Editor dialog box. For example, if you're using the enhanced Windows system driver for HP plotters, available at www.designjet.hp.com, you can click the Custom Properties button and then the More Sizes button to specify which paper sizes are available to you on the Paper Size drop-down list of the main Plot dialog box.
If you make any changes in the Plotter Configuration Editor dialog box, AutoCAD prompts you to save the changes to a separate PC3 file. You should choose Save Changes to the Following File (that is, create a new AutoCAD-specific configuration that includes the revised settings) and type a configuration name that you’ll recognize later. When you want to plot with custom settings, remember to choose the AutoCAD-specific PC3 configuration near the end of the Printer/Plotter Name drop-down list, and not the original Windows system printer configuration near the beginning of the list.
![]() Plot to File: If you need to plot to a file rather than directly to the plotter or network printer queue, select the Plot to File option. When you click OK to plot, AutoCAD asks you for a plot filename and location. You may need to use this option to create files to send to a plotting service bureau.
Plot to File: If you need to plot to a file rather than directly to the plotter or network printer queue, select the Plot to File option. When you click OK to plot, AutoCAD asks you for a plot filename and location. You may need to use this option to create files to send to a plotting service bureau.
AutoCAD adds DWFx to its ePlot options — a flavored version of DWF that conforms to Microsoft’s XPS page description language. For most people, the handiest aspect of this format is that if you plot to DWFx, the resulting file can be viewed in Internet Explorer.
Plotting to the DWG to PDF.pc3 file creates versions of the drawing files that can be opened and viewed in the free and widely available Adobe Reader software.
![]() Plot Stamp On: Use this option to turn on and off and configure the contents of a text string that AutoCAD adds automatically to the corner of each plot. The plot stamp can include useful information, such as the drawing’s filename and plot date and time.
Plot Stamp On: Use this option to turn on and off and configure the contents of a text string that AutoCAD adds automatically to the corner of each plot. The plot stamp can include useful information, such as the drawing’s filename and plot date and time.
![]() Plot Area: Specify the area of the drawing to plot. Your choices include Display, Extents, and Window regardless of whether you’re plotting a paper space layout or model space. If you defined named views in the drawing, AutoCAD adds a View option. The additional choice is Layout for a paper space layout, or Limits for model space.
Plot Area: Specify the area of the drawing to plot. Your choices include Display, Extents, and Window regardless of whether you’re plotting a paper space layout or model space. If you defined named views in the drawing, AutoCAD adds a View option. The additional choice is Layout for a paper space layout, or Limits for model space.
• Display: The drawing as it’s displayed in the drawing window (including any empty space outside the drawing objects).
• Extents: The rectangular area containing all objects in the drawing.
• Limits (full-screen model space only): The model space area that you may or may not have specified when you set up the drawing. If you didn’t specifically set the drawing’s limits (as we demonstrate in Chapter 3), plotting limits produce unpredictable results. Use another option instead.
• Layout (Layouts only): The paper space area you defined when you set up the layout.
• Window: A rectangular area that you specify.
• View: A named view that you select from a drop-down list. (Chapter 5 describes named views and how to create them.)
Usually, you choose to plot Layout in paper space. For model space, the choice depends on how the drawing was set up and what you want to plot. If you’re trying to plot a drawing in which the limits weren’t set, try Extents instead. Use Window or View to plot only a portion of model space.
![]() Plot Offset: A plot offset of X=0 and Y=0 positions the plot at the lower-left corner of the plottable area. If you want to move the plot from this default position on the paper, enter nonzero numbers or select the Center the Plot check box. (This check box isn’t available if you select Layout from the What to Plot drop-down list because the layout determines the position of the drawing relative to the margins of the paper.)
Plot Offset: A plot offset of X=0 and Y=0 positions the plot at the lower-left corner of the plottable area. If you want to move the plot from this default position on the paper, enter nonzero numbers or select the Center the Plot check box. (This check box isn’t available if you select Layout from the What to Plot drop-down list because the layout determines the position of the drawing relative to the margins of the paper.)
![]() Shaded Viewport Options: If the drawing includes viewports showing shaded or rendered 3D models, use this area to control the plotted appearance.
Shaded Viewport Options: If the drawing includes viewports showing shaded or rendered 3D models, use this area to control the plotted appearance.
![]() Plot Options: The Plot Object Lineweights and the Plot with Plot Styles check boxes control whether AutoCAD uses the features described in the “Plotting with style” and “Plotting through thick and thin” sections, earlier in this chapter.
Plot Options: The Plot Object Lineweights and the Plot with Plot Styles check boxes control whether AutoCAD uses the features described in the “Plotting with style” and “Plotting through thick and thin” sections, earlier in this chapter.
![]() Hide Paperspace Objects: This check box controls whether AutoCAD hides objects that are behind other objects when a 3D model is displayed in a paper space viewport.
Hide Paperspace Objects: This check box controls whether AutoCAD hides objects that are behind other objects when a 3D model is displayed in a paper space viewport.
![]() Plot Upside-Down: Select this check box to rotate the plot 180 degrees on the paper. (This option is handy for plotting in the southern hemisphere and for preventing having to cock your head at an uncomfortable angle as you watch plots emerge from the plotter.)
Plot Upside-Down: Select this check box to rotate the plot 180 degrees on the paper. (This option is handy for plotting in the southern hemisphere and for preventing having to cock your head at an uncomfortable angle as you watch plots emerge from the plotter.)
Because AutoCAD normally generates plots in the foreground, the plotting process takes over the program for the duration of creating the plot. AutoCAD includes a background plotting feature that returns control of the program to you more quickly. If you have a reasonably fast computer with adequate memory, turn on this feature in the Options dialog box: Type OP, press Enter, and click the Plot and Publish tab; in the Background Processing Options area, select Plotting.
If you want to automate plotting for a batch of drawings, check out the sheet sets feature in AutoCAD and AutoCAD LT. One of the tasks that sheet sets are designed to accomplish is the publishing of a set of drawing sheets at one fell swoop. If this sounds like your ticket to plotting bliss, go to the online Help system and search for Work with Sheets in a Sheet Set in the Search Help Resources box.
The Plot Sickens
No matter how many times you read this chapter or how carefully you study the AutoCAD documentation, you occasionally run into plotting problems. You’re especially likely to encounter problems when trying to plot other people’s drawings, because you don’t always know what plotting conventions they had in mind. (A plotting convention isn’t a place where spies meet; it’s a standardized approach to plotting issues.)
If you’ve used object property overrides instead of ByLayer, you’ll have plotting problems. For example, you want to plot an architectural drawing to show the client the general room layout. You don’t want to confuse them with all the dimensions, so you freeze the Dimension layer. Oops, only half of the dimensions go away, but so do several walls, a couple of windows, and the toilet.
Here are some common plotting problems (in italic) and solutions:
Nothing comes out of the plotter (system printer driver).
![]() Verify that the printer is plugged in and turned on, that it has paper (and the paper isn’t jammed) and plenty of toner or ink, and that it’s connected to the computer.
Verify that the printer is plugged in and turned on, that it has paper (and the paper isn’t jammed) and plenty of toner or ink, and that it’s connected to the computer.
![]() If the drawing is a large one, it may take a long time to rasterize.
If the drawing is a large one, it may take a long time to rasterize.
![]() Check whether you can print to the device from other Windows applications. If not, it’s not an AutoCAD problem.
Check whether you can print to the device from other Windows applications. If not, it’s not an AutoCAD problem.
![]() Try the Windows Print Troubleshooter (although it usually ends up suggesting that you ask a friend).
Try the Windows Print Troubleshooter (although it usually ends up suggesting that you ask a friend).
![]() Windows XP: Choose Start⇒Help and Support⇒Printing and Faxing⇒Fixing a Printing Problem⇒Printing Troubleshooter.
Windows XP: Choose Start⇒Help and Support⇒Printing and Faxing⇒Fixing a Printing Problem⇒Printing Troubleshooter.
![]() Windows Vista and Windows 7: Choose Start⇒Help and Support, type printing troubleshooting in the Search box, press Enter, and then click Troubleshoot Printer Problems or Open the Printer Troubleshooter.
Windows Vista and Windows 7: Choose Start⇒Help and Support, type printing troubleshooting in the Search box, press Enter, and then click Troubleshoot Printer Problems or Open the Printer Troubleshooter.
![]() Windows 8: Hold down the Windows key and press W. In the Search field, type printing and then choose Find and Fix Printing Problems.
Windows 8: Hold down the Windows key and press W. In the Search field, type printing and then choose Find and Fix Printing Problems.
Nothing comes out of the plotter (non-system printer driver).
Choose Plotter Manager on the Plot panel of the Ribbon’s Output tab, double-click the plotter configuration, and check the settings.
Objects don’t plot the way they appear onscreen.
Check for a plot style table with weird settings, or try plotting without a plot style table.
Objects appear ghosted or with washed-out colors.
In the plot style table, set Color to Black for all colors.
Scaled to Fit doesn’t work correctly in paper space.
Change the What to Plot drop-down list from Layout to Extents.
The HP-enhanced Windows system driver that you downloaded from HP’s website doesn’t have the correct paper sizes (architectural, for example).
In the Plot dialog box’s Printer/Plotter area, click the Properties button to display the Plotter Configuration Editor dialog box, click the Custom Properties button (near the bottom), and then click the More Sizes button to specify the standard and custom paper sizes.
Something else is wrong.
Check the plot log: Click the Plot/Publish Details Report Available icon near the right end of the status bar and look for error messages.