
Your app could suffer from memory leaks or from allocating too much memory.
The Garbage Collector (GC), responsible for cleaning up anything we do not want to use any more, is a great helper, but unfortunately, it is not perfect. It can only remove objects that are recognized as unreachable. Objects that are not cleaned up just hang around taking up space. After a while, if more and more objects are created, an OutOfMemoryError could occur, as would be the case if a couple of large images are attempted to load, which is a commonly seen crash scenario for many Android apps.
Memory leaks are somewhat difficult to find. Luckily for us, Android Studio comes with a memory monitor. It gives you an overview of your app's memory usage and some clue about memory leaks.
We will be using this Memory monitor to find out whether unwanted GC event patterns are causing performance issues. In addition to this, we will use Allocation Tracker to identify where in the code the problem might be.
For this recipe, it would be great if you have completed any of the recipes from the previous chapters. If possible, it should be the recipe that consumes data (text and images) from the Internet, for example, the app from Chapter 2, Applications with a Cloud-based Backend. Of course, any other app will do, as we are going to examine tools that will inspect our app in order to improve it.
Let's find out how well our app performs!
- Start Android Studio and open the app of your choice.
- Run your app on a device (or use a virtual Genymotion device).
- The Memory monitor is situated on the Memory tab, which you can find on the Android tab.
- If it is not shown, use the Cmd + 6 (for Windows: Alt + 6) shortcut to make it appear.
- Run your app to see the memory monitor recording your app's memory usage. In the following example, I have run an app that loads 200 venues (containing text and images) from the FourSquare API. I request 200 more of them each time I press the button, resulting in the peaks shown in this graph. Give me more coffee shops in my neighborhood, please:
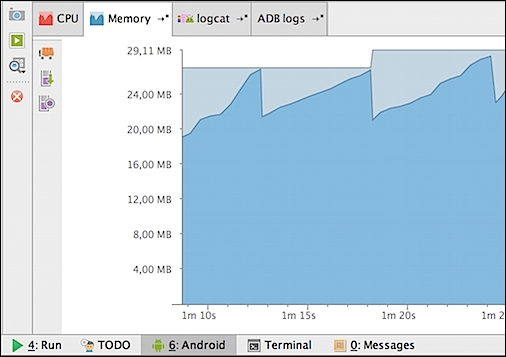
- The app's memory usage is displayed in dark blue. The unallocated memory appears in light blue. The allocated memory will grow when your app starts performing until there is no more memory left, or it will drop when the GC has arrived and done its job.
- These are common events, and eventually, you call the GC yourself by clicking on the Initiate GC icon (the button on the upper-left corner of the Memory tab) on the left-hand side of the window.
- It will only be suspicious if a lot of memory is allocated in a short period of time or if the GC events occur more often. Your app may have a memory leak.
- In the same way, you can monitor the CPU usage. You can find it on the CPU tab on the Android panel. If you notice very high peaks here, your app might be doing too much. In the following screenshot everything looks just fine:

- To learn more about memory issues, we can use another tool. From the Tools menu, choose Android and the Android Device Monitor option. This tool comes with a heap view, memory monitor, and allocation tracker, which are all tools that provide insight on the memory that your app uses.
- If it is not selected yet, click on the Dalvik Debug Monitor Server (DDMS) button that appears on the top navigator bar.
DDMSis a debugging tool that provides thread and heap information and a couple of other things. - Select the Heap tab. On the right-hand side of the window, select your running app that should appear right under the device name. If you do not see your app, you might need to rerun your app.

- Memory requests will be handled by allocating parts from a pool of memory, which is called a heap. At any given time, some parts of the heap are in use, while some are unused and therefore available for future allocations.
- The Heap tab can help you diagnose memory leaks by displaying how much memory the system has allocated for your app. Here, you can identify object types that get or stay allocated unexpectedly or unnecessarily. If the allocated memory keeps on increasing, then this is a strong indication that your app has a memory leak.
- The heap output is displayed only after a GC event. On the heap tab, find the Cause GC button and click on it to force the GC to do its job. After this, the heap tab will look somewhat like this:

- A lot of information about the app's heap usage is displayed in the preceding screenshot. Click on any item in the table to get further information. The information shown here can help you identify which parts of your app are causing too many allocations. Perhaps, you need to reduce the number of allocations or release memory earlier.
- To better understand what the critical parts of your app are and what stack trace exactly is causing the issues, you can click on the Allocation Tracker tab.
- On that tab, click on the Start Tracking button.
- Interact with your app in some way by refreshing the list, going to a detail view or whatever it is that your app does and that you would like to measure.
- Click on the Get allocations button to update the list of allocations.
- As a result of the operation that you have initiated for your app, you will see all the recent allocations listed here.
- To see the stack trace, click on any of the allocations. In the example shown next, we are investigating the loading of an image within a table row. The trace shows what type of object was allocated in which thread, and where.

If you like, you can play around a little bit to learn more about the Android device monitor. Now that you have seen some of the tools to measure results, let's have a closer look at how to deal with them and how we can avoid memory issues. See you at the next recipe!
Both the Android Device Monitor and the memory tools that come with Android Studio have many more options that you could explore. These options will help you improve the quality and performance of your app. It will make you and your app users happy!
- Chapter 2, Applications with a Cloud-based Backend
- Chapter 8, Improve Quality
- Chapter 10, Beta Testing Your App