
CHAPTER
4
Implementing a Performance Tuning Methodology
As technical solutions continue to evolve, companies will push boundaries to squeeze as much out of their implementations as they possibly can. Many companies ask the basic question, How do we get the most out of our system? To meet this type of challenge, system administrators must have a solid execution plan, be armed with tools to meet ever-changing business requirements, address expanding system growth, and ensure that their implementations operate as efficiently as possible. The proper tuning of an Enterprise Resource Planning (ERP) system is a complex, ongoing process that can be affected by a myriad of factors.
Chapter 1 of this book provided an overview of our performance tuning methodology and the major components (pillars) that affect performance of an ERP solution. This chapter takes a closer look at these concepts and provides an in-depth view of how they can help you get the most out of your implementation. We’ll cover in depth the details of the methodology components and how to leverage them to tune your implementation effectively.
The primary tenant of the tuning methodology is a structured way to break down a performance problem into smaller parts. (It’s like the old joke: How do you eat an elephant? One bite at a time!) To do this, we must identify the key bottleneck(s), examine the different layers of the system, implement system change(s), and measure the performance effects of these changes. After all, if we don’t have a way to measure, how do we know whether we had any effect?
By applying the tuning practices associated with this methodology, administrators will not only be able to solve existing performance issues, but by extending these practices into continuous tuning efforts, they will be able to benchmark their implementations to show historical performance data. This type of data can be crucial, especially if your company has acquired another company and you need to determine whether you can absorb a new set of users using your existing hardware.
NOTE
This actually happened to one of our customers. The IT manager later told me how good it felt to tell his IT VP that they had plenty of room to add all the users from the new acquisition and had the data to back it up. This helped ensure that the acquisition went smoothly, which was a major part of the company’s business plan that year. |
Our review of the major components of the methodology will start with the concept of tuning by pillars (see Figure 4-1). This concept is designed to help an administrator define where to focus their efforts in addressing a performance problem. To do this, we divide an EnterpriseOne implementation into multiple pillars, which will support your approach and success, just like the Greeks used pillars to support some their greatest architectural marvels.
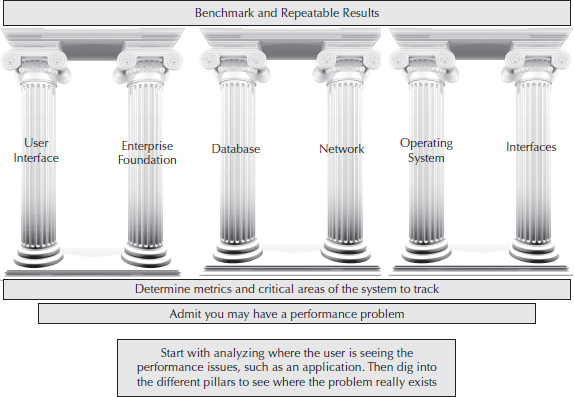
FIGURE 4-1. Tuning methodology pillars
The next step of the methodology is to drill into the components identified as containing the performance issue. In this part of the process, we move from the general view to the more detailed view; we start by identifying the problem in general terms. For example, suppose a user identified an issue in the application, and you have identified a very long SQL select statement. Next, by looking at the application, you can drill into the issue at the identified pillar. In this example, you have isolated your issue to the database pillar. Suppose the performance problem is limited to the database and revolves around specific SQL statements:
These are the type of detailed performance questions that should be considered during the second step of the methodology. Once you’ve identified the changes that need to be made, you can implement them one at a time and measure the effects to ensure that the changes being made are heading in the direction you want. Your objective here is to provide the user community and management with specifics. (For example, you have made a 10 percent improvement in performance by adding index A.) In addition to having a solid metric in place (to measure your improvements), you need to define your goal clearly so you not only know when you are successful but can prove it.
As you complete more and more detailed changes and keep knocking reported performance issues off your list, you might think that you are close to completing your tuning journey. Truth is, however, that you have just started your travels. Making your user community and management happy is a good first step; the true key is to keep them happy.
To keep them happy and your implementation running efficiently, the final part of the methodology is designed to provide continuous improvements. This part deals with setting a baseline for the system. This effort allows you to know what level of performance is in the “sweet spot” and when the system is operating outside of that performance window. The second part of this concept is to use this type of information as a boilerplate to help you know exactly what change need to be made when more users are added, a new company is acquired, data requirements increase, and so on.
Performance Tuning Methodology Basics
A wise man once said, “Don’t try to swallow a whale in one bite.” This sage advice can be applied successfully regarding performance tuning as well as seafood. As with anything complex, it is a good practice to be able to break down an issue into smaller parts. This represents one of the main pillars of a solid tuning methodology.
In the context of tuning an EnterpriseOne implementation, one of your first requirements is to be aware of the key components of your system. Next, you’ll need to identify groups of subcomponents.
The next major step in the process is to leverage a structured way to help identify where the performance issue is occurring. IT professionals always hate to hear the general feedback, “the system is slow,” and although this is truly an issue, it does not really help in your efforts to identify or resolve the problem for your user community. Like many things, the devil is in the details. So part of a solid methodology is to continue your efforts by having some structured questions/procedures in place to help users identify where a problem is occurring. These will help identify where the system administrator needs to start looking for a performance issue and will help isolate issues quickly.
Let’s assume, then, that the administrator has already looked through some of the components (or pillars). The general questions you ask and procedures followed at this point can provide a first cut at tuning efforts at the “big-knob” level—the macro-level changes that get you into the ballpark. These changes are implemented at the pillar of the implementation where the problem is occurring (such as the database, disk, and so on) and are generally larger component changes. After each change, the system administrator(s) would measure the performance impact of the change.
NOTE
You must have agreed-upon metrics regarding what you are measuring in order to show that your changes have affected the system. Do not depend on user perception only, because different users will have different perceptions. By using solid data points and metrics to show the effects to the system, you will be able to achieve your performance tuning goals. |
Once you have made the major changes, you can start moving into the “small-knob,” or micro-tuning, efforts. These efforts will allow you to identify and address very specific reported performance issues to make changes that are directly focused on the identified issue rather than on general performance issues. An example of this might be adding a specific index to a table to address a specific query that the business requires. Another possible example would be changing the logic of a program that executes thousands of quick SQL statements to leverage the database to gather this information (a join). Once changes are applied, the identified business process can be benchmarked with the changes in place to establish the performance.
The application of a structured performance tuning methodology not only allows you to identify and address performance issues at the macro and micro levels (big knob/small knob), but it also provides the structure to benchmark the process so you can start “boilerplating” major settings. You’ll have the tools in your belt to address not only performance issues but to address common business drivers in your implementation.
TIP
Don’t reinvent the wheel every time you are trying to resolve performance issues. Keep a log of the changes made to your system for performance tuning. This historical data often helps you to identify future issues more quickly. |
Parts of the Methodology
Let’s take a closer look at the individual concepts. As we mentioned, one of the first steps in the methodology is to be aware of all of the major technical components that can affect your implementation’s performance and stability. Let’s take a moment to break these down a little more, and then we can discuss how to leverage them effectively in your performance tuning efforts.
The User/Web Interface Pillar
This pillar may seem like a little bit of a misnomer, because it covers a lot more than just how the application or report looks and feels. However, this is an easy way to discuss what the user is directly experiencing when trying to perform their job duties. The user interface pillar comprises several different parts.
First, you identify the business process that is slow. What is the user doing when the problem occurs? Is he entering sales orders or receiving large purchase orders? This type of information allows you to identify the applications and reports that are considered slow. Remember that, at this point, you want to have or set metrics to measure what acceptable performance truly is.
After you identify the application and reports that are slow, you can use tools such as Performance Workbench to identify where the application is spending most of its time. This type of tool can help you quickly isolate where a process is spending its time in a large debug log file. Is the slowdown due to a database call, or is the time spent in a business function? The answer to this question will help you identify what pillar you need to focus on next.
NOTE
Performance Workbench can be downloaded from support.oracle.com. |
The next part of the user interface pillar comprises the HTML/JAS components that present or serve up the application to the user community. This is where you can do some analysis and improve performance across multiple application suites within EnterpriseOne. For example, you can evaluate whether your users are having problems with specific applications (such as sales orders or purchase orders) or if the issues are limited to a certain subset of users (maybe you need to look into security settings).
TIP
It is a good practice to test with and without security. |
As you collect a solid list of problematic applications, you can continue to isolate the problems by collecting and reviewing the JAS logs. These logs will help you identify whether any base-level errors are occurring. Use the information gathered from these logs with information from the Call Object kernel (COK) logs on the server, and you can quickly identify what the problematic applications are actually doing. As you further examine the HTML/JAS pillar, you can focus on items such as load balancing to determine whether this is being handled correctly. (For example, is one server over-stressing more than another, or do the reported problems only occur on one server only?) In addition to these issues, the JAS logs will generally indicate whether you need to adjust heap size (java.lang.out.of.memory errors). It is a good practice to set your heap size from 1GB to 3GB. It is also a good practice to keep an eye on your garbage collection by setting verbose garbage collection on the JVM. You can also look at database connections to ensure that they are set correctly for each HTML server (JVM). As you can see, the user interface/web pillar has a lot of subcomponents.
TIP
You should perform stress tests on your system—with both production users and in a controlled manner. What will your approach be? The authors recommend that you use an automated testing tool if possible. These tools can help to identify performance issues when volume is the only way to isolate them. |
At this point, even if it appears to the user that the application is running locally, you know that the majority of the EnterpriseOne application executes on back office servers. With this in mind, let’s talk about the EnterpriseOne foundation pillar.
The Enterprise Foundation Pillar
The following EnterpriseOne services are part of the foundation pillar:
The EnterpriseOne foundation pillar is composed of the Enterprise, Logic, Batch, and Application servers:
When thinking about this pillar, think not only horizontally, but vertically. This means you can tune an individual server or you can add servers to help handle load if you need more horsepower.
A real-world example would be dividing up your business logic and your batch application or reporting. This allows you to dedicate each server to one function, such as an intensive report, so will not take CPU and memory away from business logic. Many of our clients leverage this type of strategy so that they can focus specific resources on their solution (servers for interactive and different servers for batch, for example).
Regardless of the type of server you’re leveraging, a number of settings in the JDE.INI file can affect the server’s overall performance. To determine where in this pillar you need to look, you should determine what the purpose of the server is. For example, if the server is configured to service interactive users (a logic server), then you should have a number of call objects configured. A good rule of thumb is to have five users per COK; this will prevent too many users being placed on any one COK, and it’s a large enough setting to avoid consuming more resources to start the kernel than you get out of it. If you are configuring a batch server, you do not need any COKs. If the system has a large number of users, you might need to increase the number of security kernels-a good rule of thumb is 80 users per security kernel.
In this pillar you can also adjust things like the number of job queues (multithreaded or single threaded). While it is common to leverage multithreaded queues to allow batch processes to run in parallel, an effective practice is to set up queues for short- and long-running jobs. This type of strategy prevents short-running jobs from being stuck behind long-running jobs (which provides users the impression that the system is performing poorly). By dividing your single threaded and multithreaded job queues by the speed of the job, it is also possible to limit the number of job queues you need to manage. As you can see, the foundation pillar provides a number of ways to tune the system, not only to address existing performance issues but also to allow your system to grow with your business.
The Database Pillar
The database pillar of an EnterpriseOne implementation is the backend relational database solution component of the system.
This pillar stores business data/information as well as code components. The EnterpriseOne solution offers a great advantage, because it supports a number of different database solutions: SQL Server, UDB, or DB/400 can be used as a database with EnterpriseOne. So if staff is trained on one of these database types or a corporate standard requires a type, you can leverage that database in your implementation.
Regardless of the database solution you choose for your implementation, however, you need to ensure that the database is tuned to accommodate how the EnterpriseOne system will be used. Unfortunately, there is no one-solution-fits-all scenario here (no silver bullets). You will configure your database one way if you are performing more updates, for example, versus doing more reads of large files. Do not shortchange your implementation—to be successful, the correct database resources must be part of your implementation team.
That being said, you can look at performance issues by reviewing a number of high-level items, such as the size of your redo logs and temporary database, and the location of your database files. Because the database has a large effect on overall performance, this is generally one of the pillars you will examine closely. If you are examining log files, you will be able to determine whether any SQL statements are taking an extended amount of time. This will help you determine whether you might tune these items to improve statements generated from the applications run by users. (We’ll go into this in more detail in Chapters 8 and 9.)
The Network Pillar
The network pillar is like the mail service: it moves information between servers in the implementation. Some key items of the network pillar are
EnterpriseOne does a lot of talking between its different servers and the user interface. This is why the network pillar can have a direct impact on system performance, especially if you are working on a global implementation of EnterpriseOne. In such instances, you need to be very aware of what bandwidth is available to each office and the latency. EnterpriseOne does a lot of turns, so if high latency is an issue, users will experience slower performance due to the amount of traffic going back and forth. This latency adds up for the user. (This is why some clients leverage a solution such as Citrix to publish their Internet Explorer application for sites with limited bandwidth.)
You can also look into packet priority—which packets get a higher priority on the network. This can sometimes help ensure that you won’t get “stuck behind traffic” for standard Internet access or even e-mail when you attempt to access the system.
NOTE
Be sure to set aside time to work with your network team as you work through your implementation. |
The Operating System Pillar
A great strength of JD Edwards EnterpriseOne is that it is platform-independent. Different operating systems can be included in your architecture and the software can handle them without missing a beat. Although EnterpriseOne supports a number of different operating systems (AS/400, HP-Unix, Linux, Windows), it is important that you are aware that how these OSs are configured can affect performance.
We will focus on the Windows and Unix platforms, starting with the Windows operating system. In Windows, it is a good practice to validate some general settings, including the page file setting. The rule of thumb is to set it to 1.5 times the size of memory. As with other operating systems, it is a good idea to verify whether disk I/O issues exist. We would recommend using the Performance Monitor to validate items such as CPU, memory utilization, disk I/O, and other key performance indicators (KPIs). This will allow you to monitor the overall performance of your windows platform. This will help you to understand how your EnterpriseOne components (UBEs/BSFNs) are executing on your Windows operating system and let you head off potential performance bottlenecks.
Let’s now move on to Oracle JD Edwards EnterpriseOne Enterprise Servers for UNIX operating systems (HP-UX, IBM RS/6000 AIX, and Sun SPARC platforms). EnterpriseOne is shipped with a standard directory structure for Unix and Linux Enterprise Servers. As most CNC administrators know, these directories are loaded off the platform pack and are installed to a base directory, such as /u01/JDEdwards/E900.
Several aspects of the directory layout can be beneficial to the performance of your system. A key component here can be the performance of the disks for some of these key directories. If your system is I/O bound, this can have a dramatic effect on the overall performance of your system. It is a good practice to ensure that you do not have any wait queues.
As you start digging into disk performance, you’ll find the
iostat command particularly helpful. It reports asynchronous input/output (AIO), and I/O statistics for the entire system. Although it will provide you a view into the performance, you might have to go deeper, because it is common for clients to leverage SANs or NAS solutions. Work with your administrator to leverage the tools available on your solution to determine whether you have a disk issue. (Starting your examination with iostat can help determine where you might need look closer with your NAS/SAN specific tools.)Another important part of the configuration of Unix systems is how interprocess communication (IPC) parameters are handled. (Note that the EnterpriseOne Server and Workstation Administration guide discuss these types of settings.) When you’re starting the JD Edwards EnterpriseOne software on the server, the jdenet_n process will create a semaphore array containing the number of elements indicated by the maxNumberOfSemaphores parameter in the JDE.INI file. By default, Solaris 10 will allow a semaphore array with a maximum of 512 elements. If the semaphore setting in the JDE.INI file is greater than 512, the OS system default will need to be adjusted. This can be changed in Solaris 10 through the following command:
The command adjusts the default project to allow semaphore arrays with up to 2048 elements.
Kernels for HP-UX include a long list of configurable parameters that control the quantity of various resources available within the kernels. The EnterpriseOne Server software, IPC facilities, is sensitive to numerous kernel parameters. These settings differ across various vendor implementations of Unix. You can use the System Administration Management (SAM) tool to adjust these parameters (this could require a reboot). On HP-UX systems, you can leverage the
kmtune command. One of the types of parameters to keep an eye on is Message Queue:mesg This value should be set at 1 (System-V style message queues are valid).msgmni This setting represents the number of message queue identifiers. These determine the number of message queues that can exist in the system. You can use the following equation to estimate the number of message queues required: 1 + jdenet_n + 2 × jdenet_k + (maximum number of concurrent
runbatch, runube, and runprint processes)msgtql Represents the number of message headers, the total number of messages that can be included in all the message queues at the same time. A good rule of thumb is to set the value equal to 10 times the message queue parameter (msgmni).msgmap The value of this setting is the number of entries in the map of free message segments. The default value of msgtql + 2 should be used. (Note that this parameter is no longer used in Solaris 8.)msgmnb This parameter is the maximum number of bytes that can reside on a single message queue at any one time. A rule of thumb is to set msgmnb at only a fraction of msgseg × msgssz.msgmax Maximum size of a single message. Do not set msgmax with a larger value than the value of msgmnb. A rule of thumb is msgmax = msgmnb.Here are a few more settings that can be used to verify semaphores:
sema This should be set at 1.semmni The maximum number of semaphore identifiers that can exist throughout the system. The default value supplied with HP-UX and Solaris should be okay.semmap Entries in the map of free semaphores. The default value of semmni + 2 is generally acceptable.semmns The maximum number of semaphores that exist throughout the system. EnterpriseOne allocates 1000 semaphores by default, but this value can be modified in the JDE.INI file. The maxNumberOfSemaphores would then need to be adjusted.semmnu The number of semaphore undo structures for the entire system. Represents the maximum number of semaphores that can be locked at the same time. You can use the following rule of thumb for this setting: 1 + jdenet_n + jdenet_k + maximum number of
runbatch processes + maximum number of runprint processes + maximum number of runube processessemume The maximum number of semaphore undo structures per process. Represents the number of semaphores that a process can lock. EnterpriseOne needs at least a value of 4 for semume.semmsl Applies to Solaris and newer versions of HP-UX and represents the maximum number of semaphores per unique identifier. This value should be equal to or higher than the maxNumberOfSemaphores in the JDE.INI file.Shared memory settings can also be important:
shmem This value must be 1 to allow shared memory.shmmax The value of maximum size of a single shared memory segment. Default value should be fine.shmmni The number of shared memory segments in the system. A good rule of thumb is to have 20 per instance of EnterpriseOne.shmseg The maximum number of memory segments that any process can attach. Default value is generally acceptable.File descriptors can also have an effect:
nfile The number of open files (sockets) in the system. This value needs to be set large enough to address EnterpriseOne’s requirements. Ensure that this value at least matches the maxNetConnections parameter in the JDE.INI file.maxfiles The limit on the number of file descriptors that a process can have. This setting should equal a least the largest of maxNetConnection values in every JDE.INI files in use + 10.maxfiles_lim Represents the hard limit of file descriptors. The minimum value should be equal to at least the largest of all maxNetConnections + 10.It is a good practice to verify the
maxuprc (process setting), which represents the maximum number of processes that can run under a single user ID. Make sure you are not limiting the setting when starting your services to the point at which it cannot take advantage of your hardware.The Interfaces Pillar
The interfaces pillar of an EnterpriseOne implementation comprises servers or services that move information in or out of the EnterpriseOne implementation. This can include EnterpriseOne Business Services or any other third-party applications.
Business Services (BSSV) are web services for EnterpriseOne; they allow you to provide integrations using industry standards. This means this code can be reused, so it doesn’t lock you into point-to-point integrations. The big piece here is that you have the correct number of BSSV JVMs and the correct number of servers to support the business logic that will be executed from your BSSV integrations.
Some other common integrations that can play into your tuning strategy are JD Edwards Z files (both custom and standard processes) and EDI. Depending on what you are loading through the Z files, you may need to change some logic and/or add some indexes. Both integrations should be examined to determine performance bottlenecks.
An API is a direct program call to the EnterpriseOne COK. This is normally done through an XML call object API. Sometimes the call will use functionality that it really does not need, and/or that can be improved from a process perspective.
A final category for the interfaces pillar is kind of a catch-all, because it changes from implementation to implementation: third-party bolt-on applications. Some common applications are Create!form, DCLINK, and Vertex. To end users, it doesn’t matter whether the performance issue they are experiencing is an interface or is driven from an external system; they simply view the issue as a problem that prevents them from doing their jobs. Because such interfaces can slow your system down, it is a good practice to ensure that you have identified performance bottlenecks both in and out of the EnterpriseOne implementation.
Having a Structured Plan
Each EnterpriseOne component can have a major impact on the overall performance and stability of the implementation. A performance bottleneck can exist in any of the major component pillars. The primary goal is to identify where that bottleneck exists and remove it. This process involves not only removing the bottleneck, but ensuring that you don’t simply move it from one part of the implementation to another. To avoid that, when a performance issue is encountered, you need to evaluate the system to determine what layer of the implementation to examine. This is where having a structured plan comes in handy.
When performance issues are reported, you may hear general complaints, such as “It is just slow,” that do you little good in resolving the overall issue. IT professionals need to focus on resolving the underlying issue(s) by asking users structured questions that help to isolate and identify issues. The following list provides examples of some structured questions that generally help get the ball rolling:
Ideally, you can capture logs on the performance issue while it is happening, so you can focus in on the nature of the performance issue. Of course, in a lab environment you can do this easily, but in the real world this is not always possible.
TIP
When you’re attempting to log an issue, it can be very painful to sort through a lot of clutter in your JAS/HTML logs. Instead of doing this, you can use Server Manager to set up logging for a specific user. You can then use the information to duplicate the performance issues and thus avoid having to sort through lots of data. |
This discussion will review the application of the base methodology regarding a general performance issue when we are able to collect logs and when we are not able to collect logs. Let’s assume that a user reports a performance issue. When our general performance questions are applied, we learn the following information:
When a select is performed in an interactive application, performance is not acceptable. The user is able to reproduce the issue, and every time she performs the select, performance is unacceptable. In addition, this problem occurs for multiple users.
How would we apply the methodology?
1. We have already isolated the issue by asking some specific questions. We have identified that the problem occurs in an interactive application, occurs for multiple users, and can be reproduced.
2. We break the issue down into smaller parts. Because this issue centers around a select statement, we’ll start by examining the following:
3. Next, we should try to reproduce this issue in a test environment with and without security applied. First, we’ll capture a log on the issue:
a. Identify the SQL statement in question in the log.
b. Execute the statement outside of the ERP application directly against the database.
c. Run processes such as explain plan to show how effective this statement performs on the database level. Then ask the following questions:
4. At this point, we isolate this issue to a poorly performing SQL statement at the database level. But why is that statement performing poorly?
In the case of our example, the statement is performing a full scan over a large table that contains sales information. To be most effective, this select should be performed over keyed or indexed fields. The user says she did leverage an index field. The logs we were able to capture show that this field is not to be utilized due to the user’s row security.
5. At this point, it is essential that the users in this security role leverage another indexed field to ensure that their select statements perform effectively against the database.
NOTE
Savvy clients invest large amounts of capital, time, and tears executing performance testing prior to cutting their systems over to production. This is an important part of the performance tuning approach. |
As you can see, applying a structured logical process can help you quickly identify problems in your implementation. Let’s continue with our example, assuming this time that the user is unable to reproduce the issue at will. But even when you get into the annoying issue of sporadic problems occurring at seemly random times, you can still apply the logic of the structured methodology.
1. As in the first example, we have already isolated the issue quickly by asking specific questions. We determine that the problem occurs in an interactive application and occurs for multiple users. However, this time, the issue cannot be reproduced.
2. We continue to break the issue down into smaller parts: Because this issue centers around a select statement, we’ll start by looking at the following:
3. At this point, we try to reproduce this issue in a lower-level environment. Then we test this process with and without security applied.
4. Because the issue occurs at random times, we know it will be difficult to capture a log. However, we can still do the following:
a. Identify the SQL statement in question by applying a different database user and tracing the session at the database level.
b. Execute the statement outside of the ERP application directly against the database.
c. Run processes such as explain plan to show how effective this statement performs at the database level.
5. At this point, we’ve isolated this issue to a poorly performing SQL statement at the database level. But why is that statement performing poorly?
The process occurred randomly, and when the user searched for a current order, the process went quickly. However, when the user performed a search on an order that was entered in the past, the application performed a join over the current and historical tables. This join was not properly indexed, so for each record it pulled from the current sales table, it would scan the complete contents of the historical table. As you can imagine, this placed quite an overhead on this type of inquiry (especially over time).
6. To be most effective, we should perform this select over keyed or indexed fields. In this case, the issue was easily resolved by matching the indexes between the sales and sales history tables.
TIP
Sometimes the where clause can impact performance. Examine where clauses to make sure they are properly formed. |
In these two examples, we demonstrated how a bottleneck might appear at the database level and affect the performance of your system. These types of issues might be reproducible, or they might occur at seemingly random times. But what about the other parts of the implementation? Bottlenecks could appear at any of the identified layers of the implementation. If your system experiences slow network response times, application performance will suffer. If your system experiences slow I/O responses on your disks, you will experience performance lag. If your system is CPU or memory bound, you will find that your implementation will not meet your expectations. Regardless of the issue, following a structured process will allow you to identify and address performance problems.
Applying the Methodology with Benchmarks
So now that we have provided the outlines of the performance tuning methodology and some general examples of how to apply this type of methodology, we can expand on this information to discuss development of system benchmarks. The information you gather can be leveraged as “rules of thumb” that allow you to adjust your system to meet changing business requirements. This is essential to maintaining the performance and stability of your implementation. For example, you can make adjustments to your implementation to accommodate additional users required to meet increased business. The methodology will allow you to identify an average number of users to leverage per JVM. Once this number is reached, you will be able to trigger adding JVMs or adjusting kernel processes and other processes to allow for the additional users.
After you’ve identified these rules of thumb, you can encourage users to continue monitoring their systems. This will help you create benchmarks for “good” and “bad” performance. Benchmarking helps you understand how changes affect the implementation. In addition, it provides a view of system utilization by the business over time.
Conclusion
This chapter provided a detailed view of a structured performance methodology to assist you not only in identifying and addressing performance issues but to allow for the development and implementation of key industry practices and benchmarks. It is our hope that you are able to leverage the information presented here to tune and maintain your ERP implementation effectively. May your system run and run flawlessly.
..................Content has been hidden....................
You can't read the all page of ebook, please click here login for view all page.