
CHAPTER
8
Tuning by Tier: The Database Tier (Oracle)
This chapter on Oracle database tuning covers specific Oracle database configuration parameters, operating system (OS) tuning considerations such as interprocess communication (IPC) settings and disk configuration. This chapter also covers some of the Oracle SQL*Plus dynamic view commands that can be useful in performance tuning the Oracle database with EnterpriseOne.
This chapter covers the performance tuning of the Oracle database tier of the EnterpriseOne architecture. This chapter will also discuss the “large knobs” that have the biggest impact on the Oracle database in terms of changing its performance characteristics. Tuning these values is your first task in the tuning and review process. The chapter also discusses other Oracle database tuning settings that are more finely tuned “smaller knobs” with lesser impact to performance.
A large part of this chapter covers the Oracle database utilities such as Automatic Workload Repository (AWR) reports, specific Oracle dynamic performance views, and the use of Automatic Database Diagnostic Monitor (ADDM), Automatic Shared Memory Management (ASMM), baselines, and thresholds. SQL tuning and index and optimizer topics are also covered. Finally, issues related to tuning the instance, including memory components and initialization parameters, are covered as they relate to the EnterpriseOne application.
Database Tuning Overview
Before discussing Oracle database tuning and providing some of the areas in the database management that are common targets of modification from the default values for EnterpriseOne, a brief comment on a few basic principles will be introduced.
Principle 1: The Principle of Best Benefit
The tuning that provides the best benefit, and the business and technical requirements and that can be verified by easily identified metrics is better than tuning that do not exhibit such characteristics. A metric is simply the rate of change of a statistic measured over time. Of course, tuning that results in an efficient and optimized environment is preferred over a tuning method that is slower and less efficient.
Note three important aspects of the preceding statements:
Although certain tuning can provide the “best benefit” in one circumstance, it may provide detrimental effects in other areas of the application. A good example of this is database tuning of indexes. Index tuning should be approached with great care, because tuning an index on a key table to optimize a specific batch process may adversely affect interactive user processes or other batch processing that use that same table. Whenever an index is added, the database optimizer might function differently with the same queries, making the process faster or slower.
Principle 2: Trust, but Verify Tuning Changes
Always follow the principle of “trust, but verify” when making any changes to the EnterpriseOne architecture, and specifically to the tuning and performance evaluation of the database. A common occurrence at customer sites when reviewing performance tuning changes is the practice of blindly following technical whitepaper recommendations, or the even more serious practice of “Google Search” tuning. Here, the Internet search engine is used to identify possible causes of a problem and the suggested solutions are implemented in a not so controlled fashion. The performance changes are never verified as to their benefit and furthermore are never restored to their original values when no benefit is observed, which can create adverse effects later on. Additionally, there can be changes made by a consultant that are never questioned or documented. These tuning changes, if left unchecked and unverified, can be the source of future performance issues.
Principle 3: Review Previous Tuning Changes When a New Change Is Introduced
Periodically, tuning values need to be reevaluated. Uptake of Electronic Software Updates (ESUs), or upgrading the versions of software (such as the database from Oracle Enterprise Edition 10gR2 to 11gR2), may result in the tuned value being deprecated or the value becoming a hindrance to performance. Documentation and review of all tuning made to the system in the past is recommended, and copies of the original and each modified version of configuration files should be kept when any change is made to the EnterpriseOne software or hardware architecture.
EnterpriseOne Load Profiles
The load profiles for JD Edwards EnterpriseOne presented here are for interactive users and batch processes. Other processes, such as Business Services (BSSV), Real Time Events (RTE), and third-party integrations, can use similar principle methodologies for tuning but will not be discussed specifically in this chapter.
To gain the greatest benefit for interactive and batch processes when tuning the JD Edwards EnterpriseOne application, you need to understand performance degradation as it relates to the Oracle database. A review of typical JD Edwards EnterpriseOne process profiles is helpful in approaching the Oracle database component tuning.
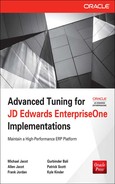
The profiles in Figure 8-1 illustrate that the database component of the JD Edwards EnterpriseOne application typically consumes only 7 percent of the total processing for interactive users and up to 30 percent for batch processing. The remaining time is spent in business logic and Java processing. Thus, the greatest benefit to performance tuning opportunities for the database resides in batch processing when it comes to the EnterpriseOne architecture.
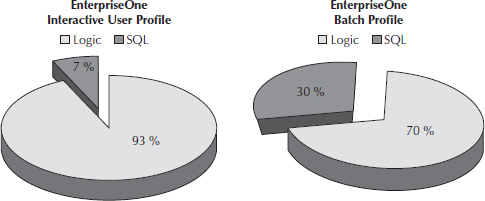
FIGURE 8-1. EnterpriseOne interactive user and batch profiles
The profiles in Figure 8-1 should be intuitive to most EnterpriseOne users, because batch processes by their nature are a combined set of interactive actions and business logic calls that are processed together as a group using the process’s processing options and data selection definitions. Furthermore, batch processes have no delay time, which is typical of an interactive user process. The delay time is the normal time spent by the user within the application when no request is made. The user may delay in their response, may be reviewing the information on the screen, or may be distracted by other activities. This delay time is also called think time.
Performance tuning the Oracle database for interactive users is useful for “Find,” “OK,” or “Submit” button clicks for processing, and the response time for retrieving information is considered slow or nonresponsive. This can often happen in open-ended queries to large tables in the database by end users asking for too much information in a grid query search, or if timeouts are occurring during query processing. As long as the interactive application responds in the typical 3 to 5 seconds, interactive users will not notice these minor improvements to the database.
Interactive Users
When is performance tuning required for the Oracle database for interactive users? Consider the following example condition:
Batch Processes
Oracle database tuning for batch process is the most typical type of tuning for the EnterpriseOne application. The reasons for batch performance tuning may involve the following:
Aspects of Database Performance Tuning
The most common methodology for tuning the Oracle database is the top-down method and is described in the Oracle Database Performance Tuning Guide. This approach is discussed in this chapter. The Oracle performance tuning steps involve identifying the scope of the problem and tuning the architecture appropriately to achieve the greatest benefit; then you evaluate whether the tuning goal has been achieved. In the top-down approach, you tune the design before tuning the application code, and tune the application code before the Oracle database instance.
The top-down approach for JD Edwards EnterpriseOne for an Oracle database involves three steps:
1. Design Review the EnterpriseOne configuration, such as the number of Call Object kernel and metadata kernel processes, the queue size configuration, timeout values, and other base configurations. The goal is to make certain that the poorly performing processes identified in the Oracle database performance scope review are not directly responsible for bottlenecks in these configurations parameters. Configuring these options is the topic of other chapters in this book.
2. Application code Apply current ESU fixes to the JD Edwards EnterpriseOne code, evaluating and correcting any improperly set processing options and data selection. Interactive user and batch process educational training can avoid the use of open-ended Find operations, resulting in Oracle database full table scans. Limit the application’s use of reports that would create unnecessary load on the database. You should also periodically review the SQL initiated from the EnterpriseOne application and inspect the values in the WHERE clause that could cause Oracle database performance degradation. The Oracle database is capable of providing the same result set from differently formed SQL queries.
3. Oracle database instance After the JD Edwards EnterpriseOne application has been installed and performance tuned, the last phase of the top-down approach would be the tuning of the Oracle database based on the scaling and load of interactive user, batch load, and other interfaces that are integrated with the EnterpriseOne architecture.
This is the basic approach to performance tuning, and like peeling an onion, it may require multiple layers of passes before you achieve the set goal and scope of the tuning effort. The goal and scope of the performance tuning effort should be well defined, specific, and measurable. Without a clear goal statement and a way to determine whether the goal is met, performance tuning will become nebulous and unattainable. Developers and managers are all familiar with the term “scope creep.” Poor management and goal and scope settings are destined to result in scope creep, whereby any amount of effort cannot achieve tuning goals because the goals and metrics of success were never provided or well defined.
When in the consulting world, it is important that you fix the performance issues and train management and personnel in the methodologies of performance tuning. Although EnterpriseOne is filled with acronyms, the well-known business SMART goal approach is worth spending time to remember:
Following are a couple of examples of using the SMART principle for performance tuning efforts. For simplicity, well-defined, specific, and measurable parts of the SMART formula will be applied.
Example 1: Interactive User Problem
Example 2: Batch Process Problem
Example 3: Poor Problem Definition
Tuning After the Design
A few basic questions to ask after completing the basic top-down approach are “What has changed recently?” and “Was the EnterpriseOne performing well at a certain point in time?” The “what has changed” answer can be increased load in the form of users, more batch load, a change in the scheduler that submits the batch processes, and a host of other factors. It is important that you qualify which process is slow and document the experience timeframe and conditions during which the problem occurs. Without these specifics, the performance administrator is limited as to where to find the metrics to identify the problem.
Using Metric Statistics
Before proceeding with the discussion on metrics, baselines, and analyzing the data for performance issues, let’s discuss the difference between active and passive tuning approaches.
Active Approach
An active approach is characterized by collecting and monitoring metrics, comparing them against Oracle baselines, setting thresholds, and creating notifications. In an active approach, part of the normal duties of the administrator of the EnterpriseOne architecture is to view reports and notifications periodically, and react to fluctuations in a normally performing EnterpriseOne system. Before the administrator performs these tasks, two activities will have already been completed: the Oracle baselines will have been created, and the Oracle Database Threshold and Notifications will have been set.
Create Oracle Baselines An Oracle database baseline is a collection of Oracle-defined metrics collected for a specific time period on a typical processing day. Setting a baseline allows you to compare Oracle database metrics against metrics gathered another day of similar time and activity. It helps you identify areas in the EnterpriseOne architecture in which performance and consumption of resources has changed. Baseline comparisons can be early detection tools for trends in processor and memory consumption increases, increasing size of Oracle resources of connections, increased occurrences of Oracle resources used in sorting and full table scanning, and in general consumption of Oracle SGA and PGA memory resources. In this regard, Oracle baseline comparisons help in capacity planning of the EnterpriseOne architecture for current and trending growth rates. The goal is to identify a potential EnterpriseOne database performance issue before the end users or management start to complain.
Set Oracle Database Threshold and Notifications Oracle thresholds and notifications are normally upper limit boundaries on the Oracle resource metrics collected by the database that will be triggered when they are reached. When an Oracle resource boundary limit is reached, the Oracle Database will deny requests for the use of that resource. Thresholds and notifications are used to preempt this from occurring by giving the administrator a notification that the limit is being approached and action should be taken to avoid any Oracle resource denial of requests.
NOTE
Many Oracle database configurations, thresholds, notifications, and Oracle baselines are not implemented well, and thus their benefit is lost. In most circumstances, they are implemented appropriately only after a major event of downtime and loss of service has occurred. It is always an unpleasant experience to see the “ORA-01653: unable to extend table in tablespace” message in the EnterpriseOne server logs. |
Passive Approach
In a passive approach, collected metrics and monitoring of the system are researched and analyzed only after a performance issue event has occurred. Unfortunately, this approach is the de facto reality for many companies. As a result, management is forced to make immediate decisions about whether to tune the system now or wait until it gets worse, which results in more customer complaints and possibly a crisis scenario.
NOTE
While I was performance tuning an EnterpriseOne application, a company CTO asked me, “What do you think is running through my company’s EnterpriseOne server?” After I looked a little puzzled as to where he was going with this, he stated, “MONEY.” A poorly performing EnterpriseOne application can cost the company money, and that is why an active approach is always encouraged. |
Performance Tuning Diagnostic Checklist
Each area of the EnterpriseOne architecture should have a detailed checklist that is to be followed when you’re going through the exercise of performance tuning. The following list outlines the basis of the remaining discussion in this chapter. As we go through the list, we will discuss a variety of commands and particulars of the application, database, and OS metrics that can be crucial in identifying changes necessary in the EnterpriseOne architecture. This is a short list of items that can include more; the information presented here includes important steps to help you avoid missing obvious performance problems.
1. View the Server Manager EnterpriseOne application metrics.
a. Configure EnterpriseOne to log all long-running SQL queries into the jde.log files. This option can be changed manually through the Server Manager interface. Once enabled, SQL queries taking longer than the specified time will be automatically logged to the standard EnterpriseOne Logic Server logs.
b. View the SQL connection information from each of the EnterpriseOne kernel processes. Server Manager provides an area of metrics analysis where the SQL connection information is listed. SQL connection information is an important metric in the Oracle Database connection requirements and is required for scaling and load analysis.
2. Use the Oracle Database utilities, including the following:
a. View the information provided on the summary page of the Oracle Enterprise Manager interface for any alerts, recommendations, or warning messages issued to the Oracle Database.
b. Generate and review Automatic Workload Repository (AWR) reports for specific time periods where EnterpriseOne performance is a concern.
c. Use the optional Oracle Database Diagnosis and Tuning Packs, which provide additional automated features for tuning the Program Global Area (PGA) and System Global Area (SGA) of the database and other tuning utilities such as the SQL Tuning Advisor, which is not available on the Oracle Database Standard Edition version of the release.
d. Use dynamic performance views to look at statistics and wait events, where the Oracle Database Enterprise Manager is not available or convenient to use.
e. Review top wait events to determine SQL and processes initiated by the EnterpriseOne application with the highest Oracle Database wait times. An Oracle Database wait typically occurs on hardware resources (CPU, memory, disk), database locking events (table locking), or waiting on Oracle resources (temporary table space for sorting, database commits from other EnterpriseOne processes).
f. Review the alert log and trace files for Oracle Database errors and warnings.
3. View the operating system metrics.
a. Monitor the activity of the main metrics of processor, memory, and disk. Performance problems related to the load and scaling of the EnterpriseOne application in increased batch load, interactive users, or increased integrations is a common occurrence if the hardware was not sized properly for the anticipated load.
b. If any one of the OS resources of processor, memory, or disk becomes constrained, then there will be a definite degradation in performance and will be noticed as a systemic issue to all interactive and batch processes.
c. Systemic issues occur when performance problems are not isolated to a single process or business activity, but a system-wide slowing of process performance is experienced. In these situations, the culprit is normally a bottleneck in one of the OS resources.
Other performance tuning activities include the following:
Performance Tuning Scope and Goals
Performance goals for the JD Edwards EnterpriseOne application fall into two main categories:
The objective of performance tuning the EnterpriseOne system is to tune the Oracle Database component to achieve minimum end user response times, to be able to perform in an efficient manner to account for increased end user load and batch throughput, and to avoid reissued batch requests. The effort should result in a more consistent and predictable EnterpriseOne environment.
Analyzing the Metrics and Performance Issue Identification
This section will expand on the subject of performance tuning priorities. Once the metrics are collected through either the application, Oracle database (AWR and Oracle Enterprise Manager), or OS, you may have identified a significant number of problems. You cannot and should not fix everything at once, because you need to judge whether the changes you make have a positive impact on the total EnterpriseOne environment. The performance effort, in other words, should not fix one thing and break four others. Remember the SMART principle and that tuning should be specific, measurable, and the performance issue well defined. The tools (advisors) should also give you an indication of how much benefit the change will have on your EnterpriseOne environment.
When a required change is identified, your response should reflect the following priorities:
Tuning the Operating System
The operating system (Unix or Windows, for example) is one of the most neglected areas that is often missed in tuning the Oracle Database and identifying possible areas for a contention point or where the Oracle Database will encounter hard limits. It is the first place in the tuning exercise that an administrator should also review before initiating any direct tuning of the Oracle Database.
Unix has an extensive set of tools for tuning the OS for the Oracle database as compared to the other operating systems that will be presented in this chapter. Although Windows does not have the finer granularity in tuning options as its Unix counterpart, the sections that describe Windows tuning for the Oracle database will highlight those “knobs” that have been found to provide the largest benefit.
The majority of the Oracle database tuning values related to the OS will be general, in that they will affect all processes because they act to reserve more resources to the CPU, memory and disk I/O.
The most critical tuning of the OS will involve the resources of disk, memory, processor and process threads including IPC and user limit settings. Assuming that the Oracle Database and EnterpriseOne application are not resource limited by the OS resource, disk I/O contention is one of the main contention points that has to be addressed in performance tuning.
The following common tuning problems can be encountered with the OS:
NOTE
Consult the Oracle documentation library hyperlinks for Oracle 10g and Oracle 11g for a complete listing and explanation of OS tuning and preinstallation guidelines: www.oracle.com/pls/db102/homepage www.oracle.com/pls/db111/homepage www.oracle.com/pls/db112/homepage |
The OS can provide many metrics; often, these metrics provide additional support in identifying and correcting performance issues. The main area in which the OS is configured is part of the top-down performance tuning methodology, and you should perform a careful review of I/O, swap, and OS parameter settings.
The key points when dealing with metrics and analysis is to make sure that there are sufficient numbers of metrics being collected to identify and tune the EnterpriseOne environment properly. You’ll also need to strike a balance between the number of changes that are made, collecting new key metrics, and continuing this process until all planned changes have been made. Tuning is an iterative process, and you need to know when sufficient tuning has been accomplished and has achieved the initial goal of the performance tuning effort. The statement “stop tuning when the goal is achieved” is a good reminder to employ.
Tuning the EnterpriseOne Application
Performance tuning the Oracle database for the EnterpriseOne application is as much an art as a science. The science part is easy to interpret because it stems from the robust set of tools, commands, and reports that you can generate and use for performance tuning the Oracle database and the EnterpriseOne application. As for the art of performance tuning, this task is performed by individuals with different backgrounds and skills. Art, by definition, implies creativity, and the individual’s creative skills help him or her form a well-tuned Oracle Database and EnterpriseOne application.
The following tuning problems are common with the EnterpriseOne application:
Analysis Tools for the EnterpriseOne Application
Two primary tools are used for the analysis of the JD Edwards EnterpriseOne application Oracle database: the EnterpriseOne Server Manager and the EnterpriseOne Performance Workbench. The Server Manager and the utilities it provides is part of the normal installation of EnterpriseOne. Performance Workbench can be downloaded from the Oracle support web site (look for “Downloads and Patches” for the JD Edwards EnterpriseOne application).
The ability to use the Server Manager and enhanced logging options to monitor long-running SQL statements has been available since EnterpriseOne Tools release 8.98.3. Server Manager is the premier tool for looking at metrics and administration of EnterpriseOne. Server Manager can also help you collect connection information and provides a mechanism for enabling the logging of long-running SQL statements to the EnterpriseOne logs.
Performance Workbench can analyze SQL statements by parsing a JDEDEBUG log. The negative aspect of using Performance Workbench is that it must be used with the “debugging logging” option turned on, so it is not normally run in a production environment. Although Performance Workbench is a valuable tool, it is not covered in this chapter.
Business and Technical that Affect Performance
Following are some typical business requirements that affect the performance of an EnterpriseOne system:
Tuning the EnterpriseOne Product Life Cycle
The life cycle for EnterpriseOne is the process flow the code goes through for development, the upgrades of tools and application code, the upgrade of hardware, integrations, and so on. The EnterpriseOne architecture should define baselines and metric sets that can show the impact of any changes made and to adjust the EnterpriseOne environment accordingly as it proceeds throughout its life cycle. The EnterpriseOne application must have sufficient overhead resources allocated to allow for changes to occur and the performance should not be severely impacted by changes.
EnterpriseOne Tuning Life Cycle Phases
Performance can be poor at the end of the year, end of the month, end of the quarter, and during nightly batch processing. Anticipate and plan for these performance-sensitive times. Focus on what is the performance today, what it was yesterday, and what it will be tomorrow. Tuning for day-to-day activities can be a main goal and activity of a database administrator, but tuning for only these short-term goals is a passive approach. An active approach involves tuning all of the EnterpriseOne life-cycle processes for typical and peak times, and this is a more comprehensive method of performance tuning.
Following are the typical phases of an EnterpriseOne life cycle and tuning requirements:
Showing the SQL in EnterpriseOne Server Logs
The following JDE.INI setting was introduced as part of the kernel resource management (KRM) initiative in Tools 8.98.3 and provides a methodology by which SQL statements can be logged to the JDE logs if they exceed a time threshold:
This functionality is turned OFF when set to zero and only positive integer values are valid for its usage. Set the
QueryExecutionTimeThreshold to 1 second to track any SQL statements that take more than 1 second to complete. This setting is read by EnterpriseOne services at startup and will require a restart of services to use if implemented. In the case of batch processing, the value is picked up when the batch process is launched and must be set prior to launching the batch process to have an effect. (Reference: http://docs.oracle.com/cd/E17984_01/doc.898/e14718.pdf.)EnterpriseOne SQL Statement Tuning
We can use a number of tools to determine whether the SQL is using excessive resources and where it is spending its time. This section of the chapter is a discussion of the tools and analysis to be performed to determine whether a SQL statement is using more resources than necessary.
The AWR report and other tools can show us the SQL statements that are consuming the resources, but how can we be sure that the amount of resources it is consuming is appropriate? One area in which we can look to see if there is longer than necessary times is the SQL overhead of parsing, binding, or fetching the data, by looking at the processing phase statistics of the SQL can help answer this question.
A common issue is found in disk I/O. Excessive physical reads and writes in the processing phase can slow down the overall time to execute the SQL statement. This shows up in the AWR report as excessive buffer gets. Bringing those buffers into the Oracle buffer cache is one way to alleviate this issue. Excessive buffer gets can lead to more processing cycles, causing performance degradation.
You can look in the following key areas in the AWR report to identify excessive resource activity:
The same SQL statement may often appear in multiple key areas, and that is what we want to review first. You can create a SQL tuning set with the list of SQL statements you’ve identified and run it through the SQL Tuning Advisor.
SQL allows you to write statements in different ways to produce the same result, and each different statement can require different amounts of resources to complete. Poor SQL can correct but inefficient; it can result from bad design, poor coding, or from the optimizer choosing an inefficient execution plan. An interesting statistic in the Oracle documentation is that in a typical SQL profiling analysis, 20 percent of SQL consumes 80 percent of the resources, and 10 percent of SQL consumes 50 percent of the resources. Thus, if we use the AWR reports carefully, we should be able to identify those 20 percent or so of SQL commands that consume the majority of our Oracle resources within the EnterpriseOne application implementation.
NOTE
We have used this method of identifying poor SQL through AWR report analysis and found it to be a good source of identifying pain points for many companies with little effort or knowledge of their performance issues. This is another example of an active approach to performance tuning. We don’t perform this activity to achieve the results of performance tuning, but we can use this analysis as a good data point when evaluating other metrics and analysis during the performance tuning exercise. |
Tuning the Oracle Database Instance
Tuning the database will most likely occur early in the life cycle of the EnterpriseOne implementation and should not require much tuning unless events require it. EnterpriseOne events range from increased user loads, bringing online new EnterpriseOne modules, and processing more records because of the normal growth of the business. We’ll review the techniques in tuning the database parameters that relate to these events.
The following common tuning problems can be encountered with the Oracle Database instance due to these EnterpriseOne events.
Undersized Memory Structures
Increased table record counts can create a greater need for Oracle process sorting space. Increased user counts on an Oracle Database dedicated connection configuration will also require more memory requirements for the EnterpriseOne application to function well. The Oracle memory structures will need to be increased in size to adjust for these increased loads.
Oracle DB Configuration Issues: Processes, Connections, and Cursors
Specifically with increased interactive user loads, the Oracle parameters of processes, memory requirements for larger numbers of connections, and cursors will be the large tuning knobs that will have to be adjusted.
Degradation of DB Performance over Time
EnterpriseOne database performance will normally degrade over time until events such as new table statistics are collected and normal cleanup processes are run. By default, the Oracle Database statistics are collected on a nightly basis or can be manually initiated. EnterpriseOne processes that clean up old and unnecessary records and archiving processes are necessary to provide a constant and efficient use of the Oracle Database.
Locking Issues
Locking or Oracle’s use of enqueues normally occurs within the EnterpriseOne application because the Oracle processes such as table records, connections, and use of Oracle process resources are being shared among many of the components of the EnterpriseOne architecture. Locking is required for security and data integrity. Oracle normally handles locking well, but conditions can arise in which a particular Oracle resource is locked and creates a performance issue with EnterpriseOne. When two or more processes need to make changes to the same table record, the first process will acquire a lock and the other processes will wait for this process to finish before it in turn will require the lock. Even on the best tuned database, lock contention will occur, especially on an OLTP-based application such as EnterpriseOne. The EnterpriseOne administrators must ensure that locking is kept to a minimum.
The EnterpriseOne application code controls most of the transactional boundaries that create the locks. Efficient small boundaries will avoid unnecessary locks. One key metric that impacts the locking performance is application transaction rollbacks. If there are rollback messages in the Call Object kernel or JAS logs, locking contention should be a concern. Rollback messages are a result of application timeouts in which transaction boundaries are too large. Excessive locks and performance issues related to the locking of tables in the database can be determined either through the v$ dynamic views of the database or through the Performance tab in Oracle Enterprise Manager for session issues.
Checkpointing
Checkpointing is the Oracle background process of writing changed database blocks to disk. During normal EnterpriseOne operations, changes to table records are initially written to memory and then at the checkpoint event, to disk. The
FAST_START_MTTR_TARGET Oracle initiation parameter controls the amount of checkpoint events.More events benefit the Oracle instance recovery time in case of downtime, but large amount of checkpointing can affect EnterpriseOne application performance. Checkpointing also relies heavily on disk I/O performance, and checkpointing events are logged in the Oracle alert log. Although the default settings are sufficient for most EnterpriseOne implementations, if disk I/O is a concern with performance, more frequent checkpointing is not recommended.
Oracle Archive Log Mode
Oracle archive log mode is a high availability feature with the Oracle Database. When enabled, it allows the redo logs to be written to another location that is specified by the Oracle configuration parameters. More than one location can be specified. The performance impact of enabling this feature is that more write requests will be made to the disk I/O subsystem as a result. The following simple SQL*Plus command can be used to determine whether archive log mode is enabled:
When the mode is enabled, performance will be impacted from the standpoint of interactive and batch processes. The degree of the impact will depend on the type of disk I/O subsystem that is configured for archive log mode and the number of archive logs. The tradeoff to this performance degradation is the business requirement of compliance to a redundant system architecture.
Redo Logs Members
Oracle redo logs store transactional information that has not yet been written to the Oracle data files. Evaluating the possible performance tuning of the redo log members is one of the easiest ways to improve overall performance of the Oracle Database. The following actions are well documented in the Oracle literature to improve redo log member performance:
The Oracle Database Time Model
The Oracle Database time can be broken down into the Oracle Database time components and is documented in Oracle’s tuning guides (see www.oracle.com/technetwork/oem/db-mgmt/s317294-db-perf-tuning-with-db-time-181631.pdf). Most of the metrics in the Oracle Database are presented in terms of each of these components.
Figure 8-2 illustrates that Oracle Database requests are composed of two variables: the database (DB) wait time and DB processing time:
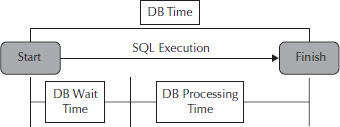
FIGURE 8-2. Oracle Database time model
The total DB time is normally measured on a user session level but could be broken down to the EnterpriseOne transaction level as well. DB time metrics collected by the Oracle Database equals the total time spent in the EnterpriseOne Database requests by user session.
The EnterpriseOne application requests that make up the total DB time for an EnterpriseOne transaction request to the database are a cumulative statistic of these interlaced combinations of DB wait time and DB processing time. The interlacing occurs because the business logic is driving these DB requests for a transaction, and execution flow will fluctuate between the DB requests and the EnterpriseOne business logic code (see Figure 8-3). Tuning the EnterpriseOne application is an effort both to decrease the DB wait time and decrease the need for CPU cycles processing these database requests.
FIGURE 8-3. Business logic and DB requests
DB Time and DB Processor Time Ratios
At a glance, it is easy to determine whether the EnterpriseOne implementation is busy and whether to target the resources for tuning by looking at the ratios of DB wait time and DB processor time. A very busy system will show more DB processor time. The DB processor time is found in the AWR reports, and Oracle Database statistics will be higher than the DB wait times. High DB wait times are early indicators of a system that is resource constrained. Resource constraints can occur at all levels including that of application, database, and OS.
AWR reports will be examined in this chapter to illustrate DB wait time and DB processing time characteristics. Figure 8-4 shows an example of the SQL time spend for a typical EnterpriseOne application. For simplicity, the database request can be further broken into two main categories: SQL processing, which takes most of the request, and SQL overhead. The SQL overhead is the processing of the Oracle background processes including Java, parsing of the SQL, the time in establishing the SQL connection, and any PL/SQL execution. Normally, the majority of the time is spent executing the actual SQL statement, but a significant amount of time can also be spent in SQL initiation and other processes when the optimizer is preparing the SQL before execution.
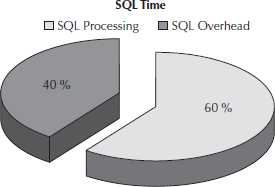
FIGURE 8-4. SQL time
In Figure 8-4, 40 percent of the time is depicted for these activities; this is an approximation of the overhead for a typical EnterpriseOne SQL request. The SQL time spent in initiation is also felt by interactive users the most when the first person using the application after a services restart has been completed. The first user in or the first time the batch process is run normally experiences the slowest performance. This is in part due to the overhead cost of the execution of the SQL statement as well as other caching activities. This overhead is normally incurred only once and future executions of the SQL statement will be in the Oracle cache and thus will have much greater SQL processing time.
Dynamic Performance Views
As mentioned, the Oracle Database has v$ views, which are also known as dynamic performance views. All the views are owned by the SYS Oracle user and reside in the SYSAUX tablespace. You can obtain a list of them using the following commands:
The Oracle dynamic views provide information on a variety of Oracle Database metrics including the following:
Many SQL queries use these views. The v$ dynamic performance views differ from the DBA equivalent views in that the statistics reported from each are gathered at different time intervals and thus differ slightly in their reporting. The v$ dynamic views tend to be more real-time while the counter DBA views are a cumulative statistic and are reset whenever the Oracle Database processes are cycled. As a consultant, the real-time dynamic views are more useful when evaluating Oracle Database performance than the DBA equivalent view, although both have their specific benefits.
For these views to have significance, the statistics for them are populated only if the
TIMED_STATISTICS initialization parameter is set to TRUE. The value for STATISTICS_LEVEL must also be set to TYPICAL or ALL. TYPICAL is the default setting for the Oracle Database. If the STATISTIC_LEVEL is set to BASIC, no statistics will be available for v$ performance views and will be unusable for assisting with the Oracle Database tuning for the EnterpriseOne application.All the statistics that are gathered through the Oracle v$ and DBA views are based on the time model. That is why, by default, the statistics are gathered and refreshed during a nightly maintenance window by the Oracle Database. Gathering of statistics is necessary so that the Oracle optimizer has the latest and best statistics to form a proper explain plan, parse the SQL, and initiate the execution of the SQL statement. An Oracle explain plan is the internal utility that the Oracle optimizer uses to shows how it will be execute the SQL issued to the Oracle database. Stale statistics will result in a poorly formed explain plan and thus will limit the Oracle optimizer’s ability to perform efficiently.
NOTE
The specific SQL queries of the dynamic views provided in this chapter were a combination of those found on the Oracle OTN web site and documents listed in the “Conclusion” section of this chapter. |
Oracle WAIT Events
A listing of the possible reasons for a session to encounter a DB wait event in the EnterpriseOne application can be found in the AWR report in the “Top 5 Foreground Wait Events” section.
Figure 8-5 shows an example output of wait events for EnterpriseOne exercising a typical interactive user load.

FIGURE 8-5. AWR report wait events
Figure 8-6 shows an example AWR report in which a log file sync DB wait event occurred.
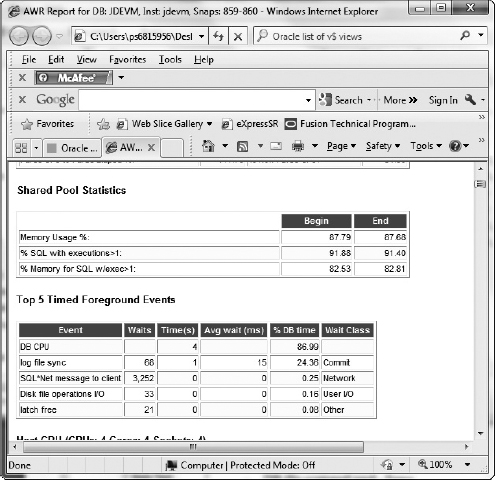
FIGURE 8-6. AWR report of log_file_sync
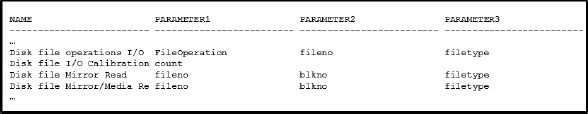
All wait events are found in the V$EVENT_NAME dynamic view. The following SQL command will show these events from this view:
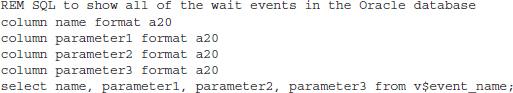
The following shows the view:
Oracle Alert Log
Another good source of information is the Oracle alert log. Information is recorded in chronological order, and selected event information is listed, including the following:
TIP
It is a good practice to archive and create new alert log files periodically when the database is recycled and to inspect the alert logs for errors and perform notifications if necessary based on key words in the log file. |
User Trace Files
Trace files can be generated either automatically by one of the Oracle background processes (such as DBWR, LGWR, PMON, or SMON) or manually by turning on selected server process tracing at the session or instance level. Trace files are found in the same location as the alert log and contain the following information:
Oracle Database Monitoring and Tuning Tools
The following discussion is intended as a high-level overview of SQL statements that are normally used in evaluating some of the Oracle parameters for the EnterpriseOne application.
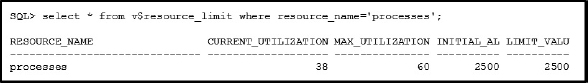
Tuning the Oracle Configuration: Processes
When the value of processes for Oracle Database dedicated connections has reached its limit, contention for these processes and connections to the database will begin to affect performance and functionality for the EnterpriseOne application. The following SQL command and output illustrate the minimum, maximum, and limits of the processes available for the Oracle Database. The output of this SQL shows a process limit value of 2500 processes and a current utilization of processes at 38. Since this snapshot was taken at JDE EnterpriseOne server startup, it shows the number of Oracle processes necessary to handle the startup of EnterpriseOne, with a total of 60 connections necessary at startup and 38 processes before any users access the system.
Using Oracle’s AWR
AWR is the extension, not a replacement, of previous versions of Oracle’s implementation of STATSPACK. AWR is managed by the Oracle background Manageability Monitor (MMON) process. AWR is an in-memory statistics collection facility that collects, stores, and provides a reporting method for Oracle performance analysis for current and historical information retrieval.
The AWR utility of the Oracle Database tool set collects the following:
A single AWR report is a subset of the total amount of information collected in the statistics and presented to the user in an easy-to-read format. These reports list the top SQL statements for the time periods specified and may not include many of the lower priority SQL statements, events, or actions that take place in the EnterpriseOne application.
Reading AWR Reports
A snapshot is a set of Oracle statistics that are collected every 60 minutes at the top of the hour. An AWR report is generated from the statistics between two snapshots. This is by default, but the snapshots of Oracle statistics can be generated at any point in time. Snapshots also are retained by default for a period of eight days and consume approximately 2MB of space in the SYSAUX tablespace.
AWR reports should be specific to the performance of the time period of interest and not evaluated over a long period of time. Smaller AWR time periods will allow a more specified target area to view and allow a greater chance of a good analysis and identification of the potential performance issues.
The AWR reports can be run manually from a SQL*Plus session using the command-line interface from the rdbms/admin directory. Oracle provides two:
The goal is to show how we can quickly review these reports and check for an indication that a performance issue exists. We need to determine whether we are using too much resources, whether the problem is caused by the application or if it is OS related. A checklist of the areas of the AWR report to inspect is provided here:
shared_pool Oracle initialization parameter.AWR Baselines, Thresholds, and Alerts
AWR baselines contain a set of AWR snapshots for an interesting or a referenced period of time. We can set thresholds with many of the metrics that are collected through the AWR report and set up alerts and notifications. These are important especially when some of the alerts warn of impending disaster or halting of processing. Notifications can include e-mail, pages, and launching of automated scripts. A full tablespace, errors on timeouts, or rollbacks within the EnterpriseOne application are good examples.
The use of permanently stored baseline snapshots on a well-tuned system is strongly encouraged. This saves a known state of statistics for comparison.
Using Active Server History (ASH) for EnterpriseOne
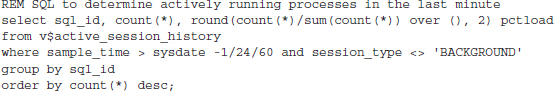
Either through the Oracle Enterprise Manager or by directly looking at the ASH session history, you can identify EnterpriseOne real-time SQL in several ways. It is sometimes impractical to have to generate an AWR report, but you need a general idea of what is going on in the system. A useful command for the ASH is to determine the most actively running SQL statements in the last minute:
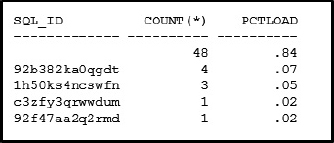
To determine the actual SQL statements that are in the ASH active session, issue the following command. In this example, the SQL_ID is 92b382ka0qgdt. For the purposes of EnterpriseOne performance tuning, concentrate on SQL specific to the application.

The results shown in the illustration reveal that the F0411 is currently in the ASH. The current Oracle Database activity provided in the output lists the JD Edwards EnterpriseOne financial module process that was initiated during this collection which is using the F0411 table, the Accounts Payable Ledger. This command is useful to view the category of EnterpriseOne tables that are actively being used by the Oracle Database. JD Edwards EnterpriseOne administrators familiar with the application and tables that they access should readily identify the potential processes responsible for a particular query appearing in the ASH active session list.
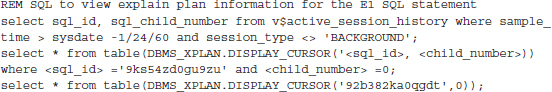
Given the actively running SQL statements as is found in the previous illustration, the administrator may want to know what explain plan the SQL statement is using; the following query can be useful:
The following SQL can be used to determine whether a session is progressing forward or the process is rolling back:
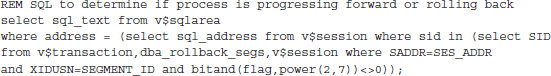
Note that the bit 7 of the
flag, power variable is a flag for a transaction that is rolling back.If things are progressing, the values in these v$ views should increase:
Oracle Enterprise Manager (OEM)
Oracle Enterprise Manager (Figure 8-7) is a set of GUI tools provided by Oracle for controlling and managing the Oracle Database. Navigation within the OEM interface is simple, and you can dive into the performance of a running system quickly by using the many Oracle hyperlinks available in the interface.
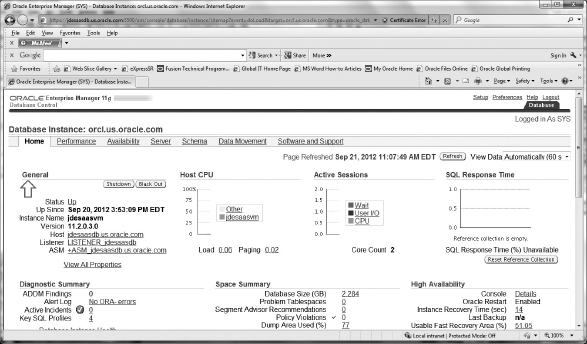
FIGURE 8-7. Oracle Enterprise Manager
The functionality of the OEM interface is enhanced with the Oracle Database Tuning Pack and addition of the Oracle Tuning Advisors.
Because of the limited space in this chapter to cover all of the material, the OEM interface will not be covered in this chapter; suffice it to say that the OEM interface can perform all of the manual tasks in this chapter and present information in graphs via its easy-to-use interface. You can learn more about Oracle Enterprise Manager at http://docs.oracle.com/cd/E11857_01/index.htm.
A good reason for including the v$ dynamic views in depth here is that at some levels, the OEM interface may not be available, and knowledge of these simple queries can assist you in determining performance issues when the OEM interface is not available.
Tuning Other Oracle Resources
This section will cover other aspects of the Oracle Database, including the optimizer, memory resources, and other parameters that are often topics of discussion on support calls with EnterpriseOne.
One of the common topics on customer questions concerning EnterpriseOne is this: Why does SQL perform differently between the different database types such as UDB and SQL Server? The most common answer to this question is in understanding how the Oracle optimizer works. Here’s a quick overview of the Oracle optimizer to help you clarify SQL performance.
The role of the optimizer is a main factor in the performance of any SQL statement in EnterpriseOne. The optimizer’s function is to do the following:
Information needed by the optimizer includes
Two main aspects of the DB contribute to the performance of the optimizer when it chooses an execution plan: selectivity and cardinality.
Execution plans are used for the following:
Good statistics are necessary for the optimizer to perform its tasks. Thus the Oracle initialization parameters
STATISTICS_LEVEL and TIMED_STATISTICS must be set in a properly tuned Oracle Database. When the statistics are not available, the Oracle optimizer is going to use the default value settings for the optimizer in Oracle, or it is going to have to use dynamic sampling.Oracle Full Table Scans and SQL Joins
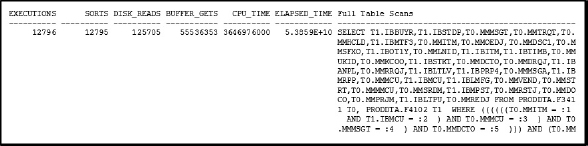
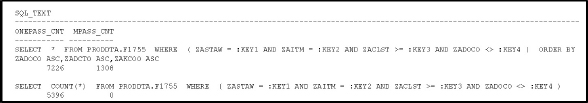
Full table scans read all rows from a table and filter out those that do not meet the selection criteria. This is the first access method considered by the optimizer. A full table scan is also one of the most expensive and inefficient costs in executing a SQL statement. A full table scan will be performed by the Oracle Database when there is a lack of index, a large amount of data is to be retrieved by the SQL query, and the query is on a small table. The following SQL command is useful in determining the tables that have performed a full table scan:
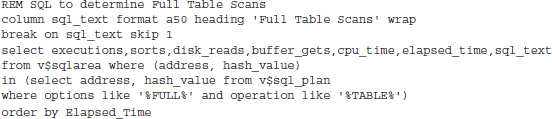
The resulting output file was inspected and the following line was identified:
NOTE
The presence of full table scans is not a bad thing, because they do occur in every implementation of EnterpriseOne. The question that should be asked when identifying full table scans is, what actions should be taken, if any? |
SQL statements that are the source of full table scans are candidates for further indexing, pinning in cache, and impact analysis to the overall EnterpriseOne process in which it was identified. It is likely that no action will be taken when identifying full table scans, but when full table scans are a significant part of the EnterpriseOne execution time, the presence of full table scans can provide valuable performance tuning opportunity.
Oracle Automated Management Configurations
A number of Oracle features can be enabled to handle functions automatically. In general, for the EnterpriseOne application, all of the automated features of the Oracle 11gR2 Database should be enabled, which is the default on installation of the Oracle Database.
Automatic Segment Space Management (ASSM)
ASSM is used to manage the segments of an Oracle object via freelists, which maintain free space. Manual segment space management was cumbersome and inefficient; ASSM, introduced in Oracle 9i, automated this functionality with a self-tuning and scalable solution to this once cumbersome administration task. With Oracle 10gR2, ASSM is enabled by default whenever a new tablespace is created.
Automatic Shared Memory Management (ASMM)
ASMM is used to automate the management of the Shared Global Area (SGA). It is enabled when the Oracle initialization parameter
SGA_TARGET is set to a non-zero value. ASMM dynamically adjusts the otherwise manual configuration of the database buffer cache, shared pool, Java pool, large pool, and streams pool.EnterpriseOne functions mainly as an OLTP system, so the flexibility that Oracle provides to the database with this feature is more efficient and effective in the implementation of its architecture as it relates to how Oracle manages memory for its resources.
Operating System Caching Operating system caching can be bypassed by using ASMM and direct I/O. If the file system is configured to bypass OS caching, then much of that file system cache memory can be reassigned to the Oracle buffer cache (or PGA and SGA in general). Oracle, in general, utilizes memory more efficiently for database activity than a general purpose file system cache and OS.
Automatic Database Diagnostic Monitor (ADDM)
ADDM is available if Oracle 11g Enterprise Edition is installed with the optional Tuning Packs. If Oracle 11g Standard Edition is available, AWR-based tools can be used. By default, the Oracle 11g Standard Edition is installed with EnterpriseOne. An uplift cost to the Enterprise Edition is normally required to use this feature.
Oracle Database and ASM
The storage generally available to the Oracle Database for the disk subsystems is hardware-based RAID technology from an assortment of devices such as a SAN, the NFS Server, a NAS appliance, a local disk, and the Oracle Automatic Storage Management (ASM).
Oracle’s ASM solution is a stripe and mirror RAID implementation that creates a set of disk groups that can be used to create tablespaces for the Oracle Database’s use. The stripe and mirror RAID is a good solution, because it allows the data protection offered by the fault-tolerant disk mirroring of the information and the entire data files share the same I/O bandwidth. ASM was introduced in Oracle 10g and was intended to remove the need for manual disk subsystem tuning.
EnterpriseOne will use the ASM in an Oracle RAC implementation and when ASM is used to configure disk groups to store EnterpriseOne database files and other Oracle resource files.
Shared Pool Performance Issues
The purpose of the shared pool is to store metadata information of the SQL statement in its cache for execution. Oracle uses cursors to perform the functions of moving SQL statement memory allocation to and from the shared pool.
EnterpriseOne use of the shared pool is efficient because of its use of bind variables, which avoids parsing costs and allows users to share SQL statements whenever possible. EnterpriseOne was also coded with repeatable SQL in mind and was designed to limit the amount of memory consumed by each SQL statement from EnterpriseOne.
The following dynamic views can offer an indication of the cursors that are shared in the EnterpriseOne application:
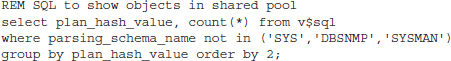
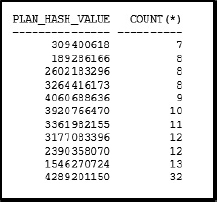
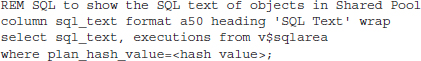
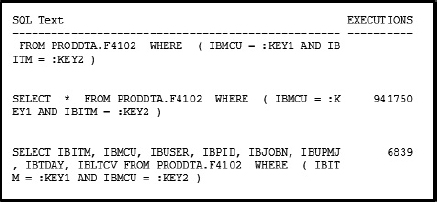
To find the SQL related to the largest cursor sharing, run the following where <hash_value> is from the results of the first query.
Evaluating whether to set the Oracle initialization parameter of
cursor_sharing to EXACT or SIMILAR has been an ongoing discussion within the EnterpriseOne DBA community. Typically, the default value of EXACT has sufficed in most customer implementations.Shared pool memory is allocated in 1K or 4K blocks. A simple query to determine the blocks allocated by session numbers is shown here:

Oracle Database Buffer Cache Performance Issues
The database buffer cache is a set of memory buffers in the SGA. Each buffer is sized to hold one database block. Oracle database writer processes (DBWn) are responsible for moving data resident in the memory database buffer cache that has changed out to the data files. Buffers have one of three states:
Only one process at a time is allowed to access a database buffer to write. A pin “read” can share a database buffer in the cache. Pin is short operating and is not related to a lock. A buffer busy wait is recorded when another process tries to access a buffer that is pinned.
If ASMM is enabled, which is the typical configuration for an Oracle Database for EnterpriseOne, the database buffer cache memory is dynamically managed. However, the database buffer cache may exhibit some performance issues if not enough space is allocated to the SGA. It is advised that AWR reports be inspected for wait events if the EnterpriseOne Oracle Database configuration is not set for ASMM. Issues involved with the Oracle memory structure of database buffer cache in the AWR report include the following, along with the most likely performance issue generating that event:
Program Global Area Memory and Temporary Space
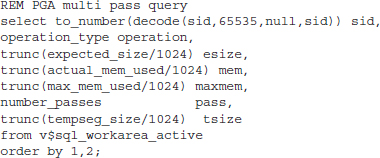
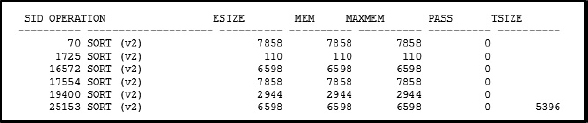
Sufficient Program Global Area (PGA) memory allocation is critical for performance. If there is not enough PGA memory, the Oracle database will use the temporary tablespace instead. Reading and writing to the temporary tablespace will slow down the execution of the EnterpriseOne application. The Oracle Database requests that use PGA include any activity involving sorts, ordering, or joins.
Optimal performance in these SQL operation activities will require the database to fit the data into the PGA working area cache. If the data cannot fit into the area, multiple passes to the cache area will be required.
The following two queries illustrate the SQL statements that require single and multiple passes to execute for some EnterpriseOne queries:

Automatic PGA Memory Management
Automatic PGA memory management dynamically controls the SQL memory allocations based on the PGA memory available, the SQL operator needs, and the system workload.
Set
PGA_AGGREGATE_TARGET to a non-zero value, which can be dynamically modified at the instance level. For OLTP systems like EnterpriseOne, set the PGA_AGGREGATE_TARGET to 20 percent of the size of the SGA. The WORKAREA_SIZE_POLICY will automatically default to AUTO. PGA_AGGREGATE_TARGET controls the work areas allocated for both shared and dedicated Oracle connections.Temporary Tablespace Management Performance
Temporary tablespaces are used primarily to handle sorts, joins, temporary large objects (LOBs), and other similar data for a transaction or session. The data is, as the table implies, temporary, and will be lost after the session or transaction is completed. Oracle instance recovery of the temporary tablespace is not required because of the volatile nature of this Oracle object.
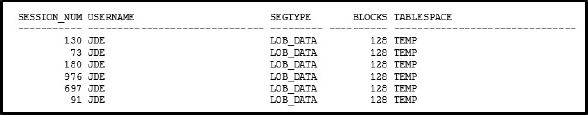
The
v$tempseg_usage view is the dynamic query that shows what session information for EnterpriseOne is stored in the Oracle temporary tablespace:As shown in the illustration, primarily LOB temporary data is being stored in the temporary tablespace.
The percentage usage of the temporary tablespace can be determined using this query:
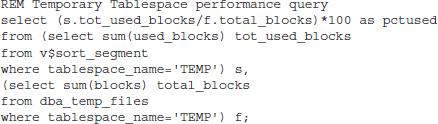
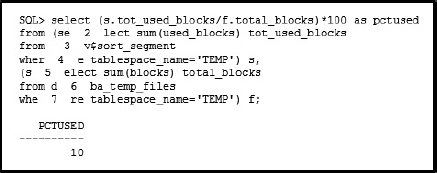
The temporary tablespace performance is an issue only if the memory of the PGA has to spill over into its usage.
Oracle Database Performance and Disk Architecture
One of the most critical parts of the Oracle Database architecture that is tied to performance is the disk subsystem. This section will cover some indicators in the AWR reports that illustrate how disk subsystems need to be addressed for performance.
On a well-tuned system, the AWR report top events are CPU time and the DB file scattered and sequential reads, as depicted in Figure 8-8.

FIGURE 8-8. AWR Report: Top 5 Timed Foreground Events
An example of an AWR report that might need some further performance analysis as it relates to disk I/O performance is shown in Figure 8-9.
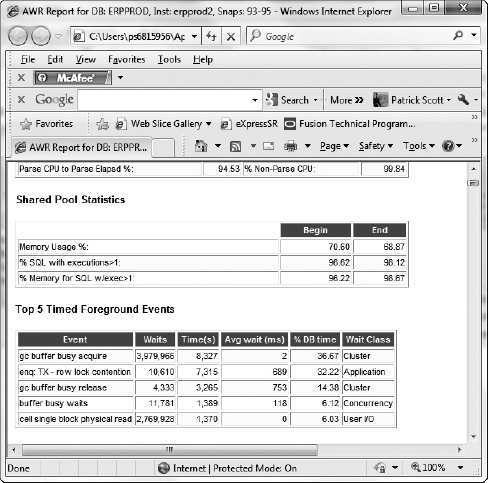
FIGURE 8-9. AWR report showing slow disk performance
The following events in the AWR report should be a first indicator that the disk subsystem might be a potential bottleneck for the EnterpriseOne application:
Review the Logs
Review the Oracle installation log, EnterpriseOne Logic Server logs, EnterpriseOne Batch Server logs, and JAS Server logs periodically for Oracle error codes. The Oracle Database errors are of the format ORA-XXXX or TNS-XXXX. It is a simple task to perform and can have great benefits in identifying possible performance, memory, and process limitations as the Oracle Database is exercised and the load is increased on the Oracle Database server.
Sufficient Swap Space
“Swap space” is a term used on OS platforms to describe an area on the hard drive that is designated to be used when the amount of physical memory (RAM) is exhausted or in short supply. In short, swap space is disk memory used as part of the overall memory pool by the OS for process usage.
Insufficient swap space can hinder Oracle Database processes from responding, leading to process failures. “Out of Memory,” “Not Enough Space,” and “Unable to Fork a Process” errors in the Oracle Database alert log can also be attributed to a lack of sufficient swap space. The result of these error conditions is that the Oracle Database processes and other software functions making database query requests will lock up, go into a wait state, or fail. In addition, the EnterpriseOne software will become unusable. So as a general rule of thumb, allocate at least the recommended amount of swap space, and more if possible.
When the Oracle Database is installed, it will ensure that there is sufficient swap space configured on the system. The Oracle Database installer will provide information on the amount of swap space that it detects on the server on which it is being installed as well as what is minimally required. The minimum requirements of the Oracle installer can be overridden during installation so that it may proceed further, but this is a risky activity. When minimum requirements of an OS are not met during the Oracle installation, the installation should be stopped, requirements adjusted, and the installation reinitialized.
Unix
A general rule of 10 percent more than the recommended amount for the installation requirements for swap space is a good start for better performance for the EnterpriseOne software. Monitoring the swap space during peak and spiking usage of the EnterpriseOne software is a good time to evaluate the swap metrics on the OS.
Typical error messages that might indicate that not enough space has been allocated for swap include the following:
Usually the server will lock up and hang shortly after these messages appear in the log files.
Windows
The Windows swap space is called the page file. The page file is an area on the hard drive that is used for additional memory to increase the performance of the applications initiated on the Windows Server platform. Page file management should be left to the Windows OS, and the size of the page file should be at least as large as the amount of RAM on the Windows Server.
Operating System Patches
Operating system patches for the Oracle Database are often ignored during the Oracle Database installation process and can impact performance if left unattended. The OS software packages include kernel and third-party library software that is needed by the Oracle Database to communicate and allow the functionality of all the Oracle Database features.
Often, the software is installed on the OS, but the version is one or two levels prior to the one required by the Oracle Database installation. Oracle Database features may in fact function, and they may even perform well, but there is a reason that the Oracle Database installation requires a later version. It may be a known bug in the functionality, but more often than not, the new version is required to improve performance in how the software functions in memory or CPU cycles. That is why it is crucial that you periodically review the specific Oracle Database requirements for OS patches.
Interprocess Communication Kernel Memory Settings
Interprocess communication (IPC) is a set of memory resources that allow the communication of information among process threads. These threads may be on the same server or between computers on a network. The three main categories of IPC resources are message queues, semaphores, and shared memory segments.
The EnterpriseOne application uses the mechanism available with IPC resources as a key way to manage its network and kernel processes. The Oracle Database also uses the functionality of IPCs to control its background processes and establish database connections. Performance degradation related to IPC resources is a real and common occurrence with customers.
Unix IPC Resources
Unix IPC resources are heavily used by the Oracle Database processes and EnterpriseOne application; thus a lack of these resources can be detrimental to the ability to install, startup, and initiate many of the key functions in the Oracle Database and EnterpriseOne application.
Unix user resources are normally included in the system or user settings
ulimit. The ulimit variable controls how the OS controls certain functions within a starting or running process. It is important that the Unix shell limits be set properly for the Oracle Database. Many of the errors in the alert log when Oracle Database processes fail will be shown when the ulimit values are insufficient.Of all the OS tuning variables, user resources, such as
ulimit and max number of user processes, are the primary variables in performance degradation at the OS level for both the Oracle Database and EnterpriseOne application. Other IPC Unix resources that may have to be tuned are the SHMMAX (Shared Memory Segment) and SEMMNS (Maximum Number of Semaphores). Both of these settings require minimum configuration settings at Oracle database installation time, for they will be checked by the Oracle installer.Windows IPC Resources
For Windows, IPC tuning is not required and is not allowed to be adjusted by the user. On Windows, few resources, including IPC shared memory and semaphores, are needed by the Oracle database.
Processor, Memory, and Disk Configuration
Access is the amount of time a request takes, and bandwidth is the transfer rate of information across the OS architecture. Table 8-1 illustrates the access time of the four types of storage that the Oracle database objects can reside in—registers, cache, main memory, and disk. The use of memory registers is the fastest and Oracle objects that are accessed on the disk is the slowest. Thus it is a great benefit to the EnterpriseOne application in performing SQL operations where the Oracle database objects will find its execution in the fastest medium possible. Performance tuning of the Oracle database objects to the fastest hardware resources requires both the knowledge of those resources and how to configure the Oracle database to use those resources.
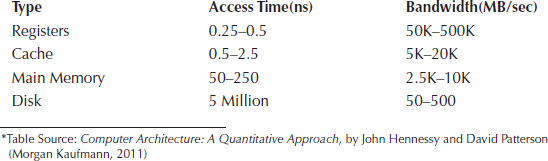
TABLE 8-1. Access Time and Bandwidth for System Resources*
When physical memory cannot be used, disk subsystem components of a server become extremely important to the Oracle Database and EnterpriseOne application. Oracle recommends the use of the Oracle ASM feature of the database in Oracle 10g implementations or later or to use logical volumes from a SAN, NAS, or other RAID technology to mirror and stripe physical disks for the best performance and data integrity.
Conclusion
The important Oracle Database initialization parameters that affect performance are related to the size of SGA, PGA, and processes. Proper sizing of these alone and measuring the metrics that surround them will address the majority of the EnterpriseOne application performance issues related to the Oracle Database.
The most critical tuning of the OS will involve the resources of disk, memory, processor, and process threads, including IPC and user limit settings. Of the three resources on the OS, disk I/O contention is the one that should have a particular focus.
Many of the example SQL statements on the dynamic views were taken from the following documents and applied to the EnterpriseOne application:
All of these documents can be found on the Oracle 11g portal: http://oracle.su/docs/11g/nav/portal_11.htm
..................Content has been hidden....................
You can't read the all page of ebook, please click here login for view all page.