CHAPTER 6
Factors
FALLACY: FACTORS OFFER SUPERIOR DIVERSIFICATION AND NOISE REDUCTION
In this chapter, we address two common fallacies about factors. The first fallacy is the notion that portfolios composed of factors are better diversified, and therefore more efficient, than portfolios composed of asset classes. This claim might seem plausible because correlations among factors tend to be lower than correlations among asset classes. But this comparison is specious, as we soon demonstrate.
The second fallacy is the notion that investors reduce noise more effectively by consolidating securities into factors as opposed to asset classes. In fact, we show the opposite to be true; factors are noisier than asset classes, which we explain and illustrate later on.
WHAT IS A FACTOR?
First, let's distinguish between factors and asset classes. They must be different, otherwise the premise of factor investing would be redundant. Perhaps the most important characteristics that distinguish asset classes from factors are that asset classes have stable composition and are directly investable. (See Chapter 1 for more about the characteristics of asset classes.) Factors, by contrast, are labels that reflect exposure to a source of risk and are not directly investable. Moreover, the composition of the collection of assets designed to replicate them is unstable. Investors must periodically rebalance the replicating assets.
The term “factor” is used in a variety of ways, including:
 A simple combination of assets, such as a long position in a 10‐year Treasury bond and a short position in a 2‐year Treasury note.
- A fundamental factor, such as a portfolio of securities formed by using regression analysis or optimization to track an economic variable like inflation.
- A security attribute, such as a portfolio formed by ranking assets according to an observable attribute like price‐to‐book value ratio.
- A statistical factor, such as a combination of securities that explains variation in returns and which is identified using Principal Components Analysis.
In all cases, factors are labels for portfolios of investable securities. These factor portfolios may appear to have strong diversification properties because they often have low or even negative correlations with each other. Meanwhile, asset classes are usually positively correlated with each other and often highly correlated. It, therefore, might seem that factors are better diversifiers than asset classes. Unfortunately, this reasoning is flawed. Factor‐mimicking portfolios typically include short positions, which force their correlations to fall below those of asset classes. If we were to allow the same amount of shorting in structuring asset classes, we would observe equally low or negative correlations among asset classes.
EQUIVALENCE OF ASSET CLASS AND FACTOR DIVERSIFICATION
We now know that the low correlations we observe among factors are an artifact of short positions in the portfolios constructed to replicate them. Therefore, why should we expect factors to offer greater diversification than asset classes? We shouldn't. Instead, we should expect asset classes and factors to produce identical efficient frontiers and thus the same degree of diversification as long as three conditions prevail:
- Assets define the opportunity set.
- Both efficient frontiers are derived with the same constraints.
- And both efficient frontiers measure expected return and risk in the same units.
This equality can be proven mathematically. (See, for example, Idzorek and Kowara [2013]). It is also quite intuitive when one considers that we can express any combination of factors as a combination of the underlying assets that constitute the factors.
An empirical example may help to illustrate this point. Suppose we identify principal components from the covariance matrix of the asset classes we introduced in Chapter 2. (See Chapter 18 for an explanation of Principal Components Analysis.) These principal components are uncorrelated to each other, are equal in number to the original asset class universe, and span the same opportunity set as the asset classes. We can express any portfolio that is formed from the asset classes as a combination of these factors. Figure 6.1 plots efficient frontiers constructed from asset classes and principal components.
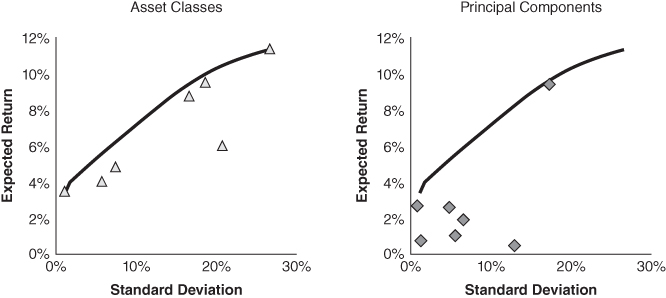
FIGURE 6.1 Asset Class and Principal Component Efficient Frontiers
The average asset class correlation is 0.23, and four of the asset class correlations are above 0.60. The principal components by construction are uncorrelated. We have translated our investment universe from one set (asset classes) to another set (factors), but we have not at all changed the opportunity set. For any chosen set of investment constraints, the efficient frontiers associated with the asset class universe and the factor universe are identical. To see why this must be so, note that any portfolio built from factors can also be built from the asset classes, so whatever allocation is optimal for the asset classes must be optimal for the factors, and vice versa.1 While this logic is straightforward, investors are often confused because, as we mentioned previously, many factors include short positions in the asset classes. Table 6.1 shows the portfolio weights corresponding to each statistical factor, scaled so that their absolute values sum to 1.
TABLE 6.1 Principal Components
| Principal Components (sum of absolute value of weights equals 1) | |||||||
| Asset Classes | 1 | 2 | 3 | 4 | 5 | 6 | 7 |
| U.S. Equities | 19.7% | –12.4% | 26.8% | 36.9% | –16.6% | 1.5% | –0.2% |
| Foreign Developed Market Equities | 24.3% | –4.6% | 28.4% | –37.0% | 3.1% | 0.6% | 0.1% |
| Emerging Market Equities | 38.8% | –13.4% | –32.3% | 1.6% | 2.7% | 1.6% | –0.4% |
| Treasury Bonds | 0.1% | –2.2% | 5.0% | 7.8% | 33.5% | 48.8% | –9.9% |
| U.S. Corporate Bonds | 3.1% | –3.3% | 6.6% | 10.9% | 42.2% | –38.5% | 6.0% |
| Commodities | 13.9% | 64.0% | 1.0% | 5.6% | 0.9% | 0.3% | –0.4% |
| Cash Equivalents | 0.1% | 0.2% | 0.0% | 0.3% | 0.9% | 8.6% | 83.1% |
| Expected Return | 9.5% | 0.5% | 2.0% | 1.1% | 2.6% | 0.8% | 2.7% |
| Standard Deviation | 17.3% | 13.0% | 6.6% | 5.5% | 4.8% | 1.3% | 0.8% |
| Percentage of Variation Explained | 60.7% | 20.4% | 9.0% | 5.6% | 4.0% | 0.2% | 0.1% |
The bottom line is that forming an optimal portfolio from principal components is no different than forming an optimal portfolio directly from asset classes, as long as we allow the same amount of short positions. Moreover, if we were to build a long‐only portfolio from factors, we would need to combine the factors such that we offset their short positions with long positions in other factors, which would result in a long‐only asset class portfolio.
Now let us turn to the second fallacy about factors—the notion that factors are more effective than assets in reducing noise.
NOISE REDUCTION
Investors must choose whether to allocate across granular asset universes, such as individual securities, or across consolidated asset universes, which consist of precombined groups of securities such as asset classes or factors. A more granular approach always produces a more efficient frontier in sample, because granular data contain more information and offer a broader opportunity set. However, as we move out of sample, aggregated information becomes more reliable than granular information, because errors in our estimates of the return and risk of individual securities tend to cancel each other out when we aggregate the securities into groups. It does not necessarily follow, though, that grouping securities into factors reduces noise more effectively than grouping them into asset classes. We need to think carefully about why one approach might be superior to another. Let's first consider asset classes.
Asset class characteristics are easy to observe, and they change very slowly. For example, it is plain to see whether a security is a stock or a bond, and whether it is domestic or foreign. The industry in which a firm operates is also easy to observe. Moreover, these characteristics are persistent. Asset classes are also capitalization weighted; thus, when security prices change, their weights within the asset classes change proportionately. The composition of an asset class is, therefore, stable.
Now let's consider factors. A security's factor attributes, such as its price‐to‐book value ratio, change significantly through time. Other attributes such as a security's sensitivity to inflation also change through time. Moreover, a security's sensitivity to an economic variable is not directly observable. We must infer it by using regression analysis, the result of which is imprecise. Therefore, the process of mapping securities onto factors introduces incremental noise of its own, which we call mapping error. The securities that tracked a factor best historically may be different from those that best track it in the future. Asset classes based on stable and observable characteristics do not have mapping error, but factor groupings do. Given these considerations, it seems reasonable to expect asset classes to be less noisy than factors. But we need not rely on reason alone. We can test empirically how well each grouping scheme reduces noise.
Table 6.2 shows the instability of means and covariances associated with industry and factor groupings of the same underlying universe of securities.2 It reveals that these groupings are exposed to essentially the same degree of instability arising from independent‐sample error, interval error, and small‐sample error. Errors in means are measured by average standard deviation, whereas errors in covariances are measured as a modified root‐mean‐squared error. (See Chapter 13 for a detailed description of this measure.)
TABLE 6.2 Instability of Industry, Size, Value, and Momentum Portfolios
| Return Instability* (average) | Covariance Instability** (average) | |
| 10 Industry Portfolios | 20.9% | 0.39 |
| 10 Size Portfolios | 24.9% | 0.39 |
| 10 Value Portfolios | 22.3% | 0.41 |
| 10 Momentum Portfolios | 22.9% | 0.38 |
*Measured as standard deviation of returns.
**Modified root‐mean‐squared error.
It is important to note that these measures do not include mapping error, which would undoubtedly increase the instability of the size, value, and momentum portfolios beyond the instability of the industry portfolios. Of course, one could argue that with sufficient trading it is possible to avoid mapping error because the attributes are observable at each point in time, but frequent updating would drive up trading costs. Therefore, investors either reduce noise less by grouping securities into factors as opposed to industries or they achieve the same noise reduction with factors but at a greater cost.
WHERE DOES THIS LEAVE US?
We have shown that factors do not offer better diversification than assets. We have also shown that they do not reduce noise more effectively than assets. But factors are useful for other reasons. For example, analyzing a portfolio's factor exposures could help investors to understand and manage risk more effectively. Also, some factors carry risk premiums that could help investors to enhance returns. And some investors can add value because they are skilled at predicting factor behavior. But we should weigh these potential benefits of factor investing against the incremental noise and trading costs associated with factor replication.
REFERENCES
- M. Czasonis, M. Kritzman, and D. Turkington. 2016. “Facts about Factors,” forthcoming in the Journal of Portfolio Management.
- T. Idzorek and M. Kowara. 2013. “Factor‐Based Asset Allocation vs. Asset‐Class‐Based Asset Allocation,” Financial Analysts Journal, Vol. 69, No. 3 (May/June).