
Chapter 3: Sniffing and Spoofing
During the 1970s, the United States conducted a daring Signals Intelligence (SIGINT) operation against the Soviet Union called Operation Ivy Bells in the Sea of Okhotsk. Whereas any other message with a reasonable expectation of being intercepted would have been encrypted, some key communications under the Sea of Okhotsk took place in plaintext. Using a device that captured signals moving through the cable via electromagnetic induction, United States intelligence was able to retrieve sensitive military communication from hundreds of feet below the surface of the sea. It was a powerful demonstration of sniffing – the ability to capture and analyze data moving through a communications channel.
Decades earlier, the Allies were preparing to liberate Nazi-occupied Western Europe in the 1944 Battle of Normandy. A critical component of success was catching the Germans unprepared, but they knew an invasion was imminent; so, a massive deception campaign called Operation Fortitude was employed. Part of this deception operation was convincing the Germans that an invasion would take place in Norway (Fortitude North) by generating fake radio traffic in Operation Skye. The generated traffic was a perfect simulation of the radio signature of army units coordinating their movements and plans for attack. The strategy was deployed, and its ingenious attention to detail is a powerful demonstration of spoofing – false traffic intended to mislead the receiver.
Our discussion in this chapter will be in the context of modern computer networks and your consideration of these concepts as a pentester, but these historical examples should help illuminate the theory behind the technical details. For now, let’s demonstrate some hands-on examples of sniffing and spoofing for a pentester armed with Kali Linux.
In this chapter, we will cover the following topics:
- Advanced Wireshark statistical analysis and filtering to find the individual bits we need on a network
- Targeting WLANs with the Aircrack-ng suite
- Advanced Ettercap to build a stealthy eavesdropping access point
- Ettercap packet filters to analyze, drop, and manipulate traffic in transit through our access point
- Getting better with BetterCAP fundamentals
Technical requirements
To get started, you will need to have the following:
- A laptop running Kali Linux
- A wireless card that can be run as an access point
- Basic Wireshark knowledge
Advanced Wireshark – going beyond simple captures
I assume you’ve had some experience with Wireshark (formerly known as Ethereal) by now. Even if you’re new to pen testing, it’s hard to avoid Wireshark in lab environments. If you aren’t familiar with this fantastic packet analyzer, you’ll no doubt be familiar with packet analyzers in general. A sniffer is a great challenge for anyone learning how to code.
So, I won’t be covering the basics of Wireshark. We are all familiar with packet analyzers as a concept; we know about Wireshark’s color-coded protocol analysis and so on. We’re going to take Wireshark beyond theory and ordinary capture, and apply it to some practical examples. We’ll look at passive wireless analysis with Wireshark, and we’ll learn how to use Wireshark as our sidekick when we use our attack tools.
Passive wireless analysis
So far, we’ve been studying layer 2 and above. The magical world of layer 1 – the physical layer – is a subject for another (very thick) book, but in today’s world, we can’t talk about the physical means of accessing networks without playing around with wireless.
There are two core strategies in sniffing attacks: passive and active. A passive sniffing attack is also commonly referred to as stealthy as it can’t be detected by the target. We’re going to take a look at passive wireless reconnaissance – which is just a fancy way of saying listening to the radio. When you tune into your favorite station on your car’s FM radio, the radio station has no way of knowing that you have started listening. Passive wireless reconnaissance is the same concept, except we’re going to record the radio show so that we can analyze it in detail later.
To pull this off, we need the right hardware. A wireless card has to be willing to record everything it can see and pass it along to the operating system. This is known as monitor mode and not all wireless cards support it. My card of choice is an Alfa AWUS036NEH, but a little research online will help you find an ideal device.
We’ll use iwconfig to enable monitor mode and confirm its status after bringing the device up:
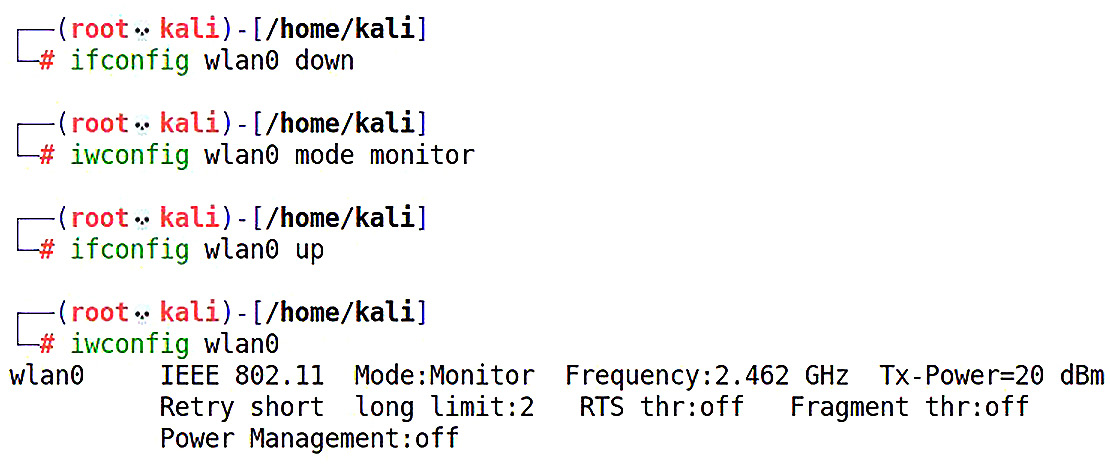
Figure 3.1 – Using iwconfig to enable monitor mode
Note the use of both configuration utilities: ifconfig and iwconfig. Don’t mix up their names!
When we run the last command, we can confirm that monitor mode is enabled. If you check the RX packet count, you’ll see it’s already rapidly climbing (depending on how busy your RF surroundings are) – it’s receiving packets, even though you are not associated with an access point. This is what makes this type of analysis stealthy – no devices that are merely listening are detected.
It’s important to note that true stealth requires that your device is not sending any data. Sometimes, we intend to simply listen, so assume we’re being stealthy, but if the card is announcing its presence in some way, it isn’t passive. When you’re good at analyzing your environment, use your skills to check your stealth!
Now, we’ll fire up Wireshark and select the interface we specified previously – in this example, wlan0:
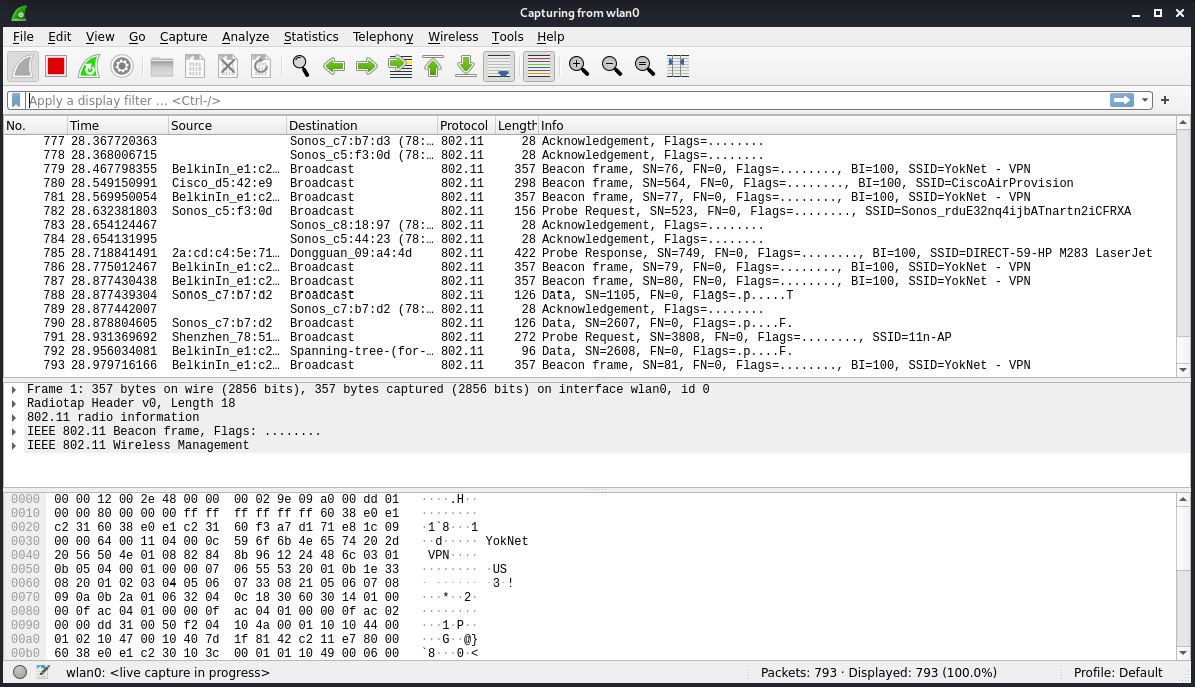
Figure 3.2 – Raw wireless capture with Wireshark
Whoa, okay – hold on a second. The screen just lit up at a pace of 27 packets per second, and this is a relatively quiet environment. (Fire this up in an apartment building and enjoy the fun.) Don’t get me wrong – I’m a data hound and this number of packets excites me – but we need to find out what’s happening in this environment so that we can tune in on the good stuff. We’ll revisit the high-altitude view of a wireless environment with Wireshark in the next section.
Targeting WLANs with the Aircrack-ng suite
No discussion on wireless attacks is adequate without the Aircrack-ng suite. Though the name implies it’s just a password cracker, it’s a fully-featured wireless attack suite. In our example, we’re going to take a look at the wireless sniffer with the airodump-ng wlan0 command. Here’s the output:
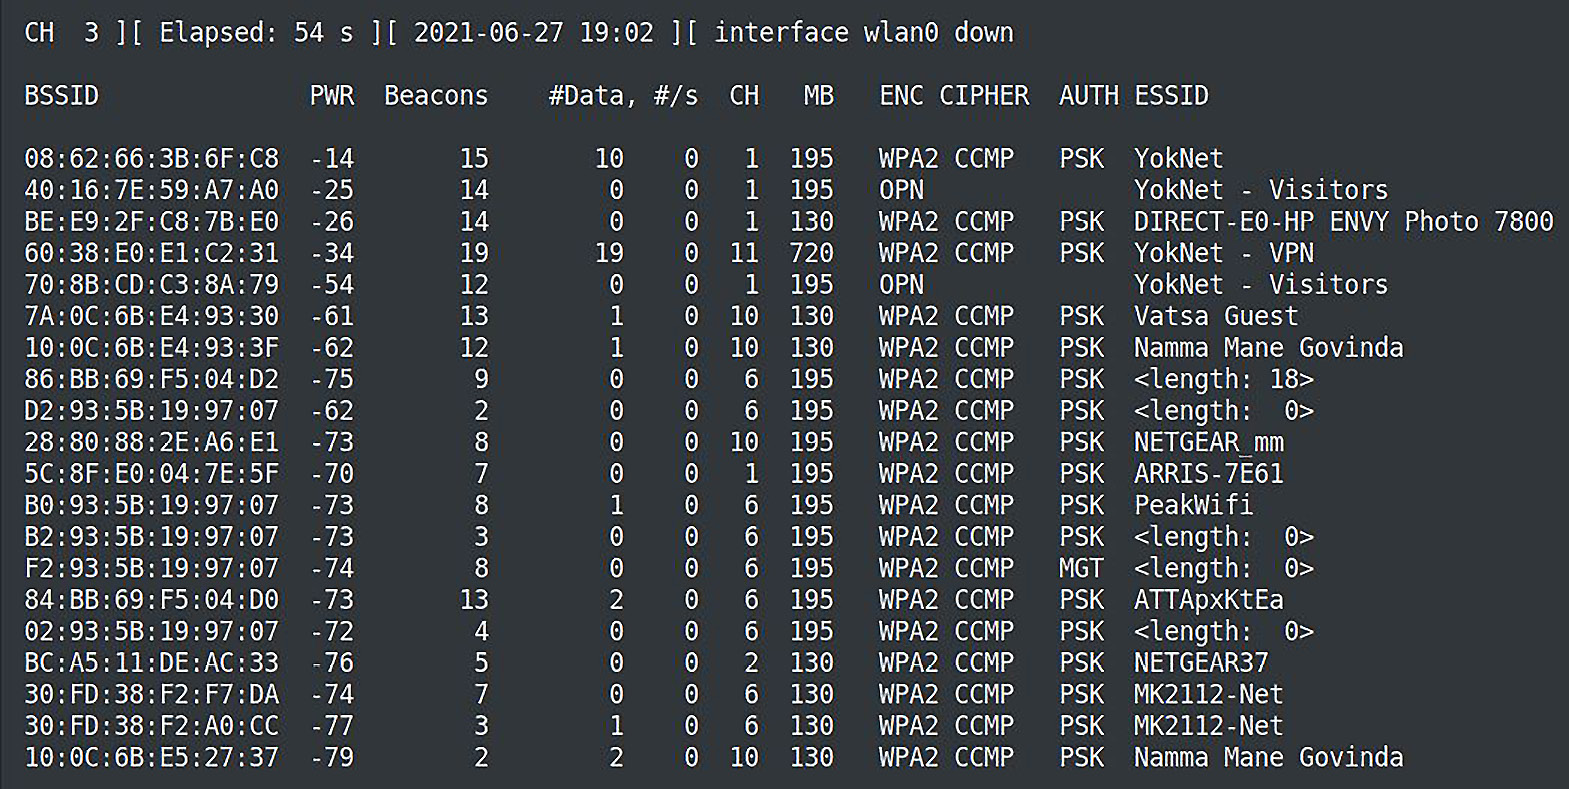
Figure 3.3 – airodump-ng output
This is the same task, but this tool can organize the wireless environment and the identities of all participating devices. An especially useful column is #Data, which tells us how many observed packets contain network data. This is handy because as we saw when watching the raw environment, there are a lot of packets that are for wireless management. It’s easy enough to sort packets in Wireshark, but now, we’re getting a tidy list of networks, the MAC addresses of the clients and access points (BSSIDs), and an idea of how busy they are.
The ENC column tells us what encryption method – if any – is in use for the listed network. OPN means there is no encryption. This is unusual these days, but in this example, the open network is a guest network. It’s been left open on purpose to allow easy access, but clients will be dropped into a captive portal environment once they’ve been associated. You’ll recall from Chapter 2, Bypassing Network Access Control that we worked to intercept authentication to the captive portal from the network layer by attacking the data link layer. But in this case, we’re sitting in radio range and the packets aren’t encrypted. We should be able to intercept anything that isn’t protected with some tunneling method (for instance, HTTPS) by merely listening – no injection required, and with a zero detectable footprint. So, how do we leverage the information here to sift through the wilderness captured in monitor mode? Let’s target the guest network by filtering on the access point’s MAC address (the BSSID): 40:16:7E:59:A7:A0.
As you know, the 2.4 GHz band for 802.11 communication is split into channels. Airodump-ng will hop these channels by default – jump from one channel to the next, rapidly, listening for data on whatever channel it’s on at the moment. As you can imagine, if a juicy packet is being transmitted on channel 1 while Airodump-ng is listening on channel 4, you’ll miss it. So, when you know your target, you need to tell Airodump-ng to focus. In our example, the open network is on channel 1. We use --channel to specify our listening frequency, and we use --bssid to filter out our target access point by MAC address. We’ll use --output-format to specify a .pcap file (any packet analyzer can work with this output format):
# airodump-ng -w test_capture --output-format pcap --bssid 40:16:7e:59:a7:a0 --channel 11 wlan0
While we watch the metadata on our screen, our test file is being written. We can let this run as long as we like; then, we must hit Ctrl + C and import it into Wireshark:
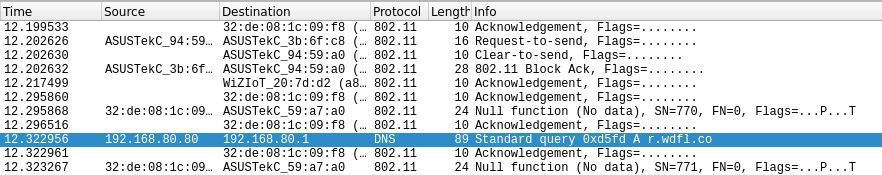
Figure 3.4 – Opening our test capture file in Wireshark
Without sending any data whatsoever, we’ve already discovered a legit IP address (192.168.80.80), and we can watch the DNS queries being sent by this host. We have a decent start on our reconnaissance phase for this particular network, and we haven’t even sent any packets.
We’re Living in a 5 GHz World
Though 2.4 GHz remains dominant, there are more and more 5 GHz devices out there and you might need to sniff those out. A newer wireless card should support it. When you’re working with airodump-ng, use the band flag and set it to abg, which will enable 5 GHz.
Now that we have some experience with raw wireless sniffing, let’s check out Wireshark’s built-in analysis features.
WLAN analysis with Wireshark
Let’s review using Wireshark to interpret a wireless environment. We disabled channel hopping in the previous section so that we could focus on a target, but now, let’s try to capture as much as possible and let Wireshark do the explaining. With a wireless capture open, click Wireless | WLAN Traffic. The resulting window is Wireshark - Wireless LAN Statistics - test_wifi_capture-01 with sortable columns. I’m interested in finding the busiest networks, so I have sorted by Percent Packets:

Figure 3.5 – Wireless LAN statistics in Wireshark
By expanding BSSID on the left, we can see nested BSSIDs: the parent is the access point, while the nested devices are associated clients. Right-click on a target and click Apply as Filter | Selected. Close the statistics box to return to Wireshark’s main window. The display filter text box will be populated with our chosen filter. Apply the filter and enjoy the time you’ve saved digging through packets:
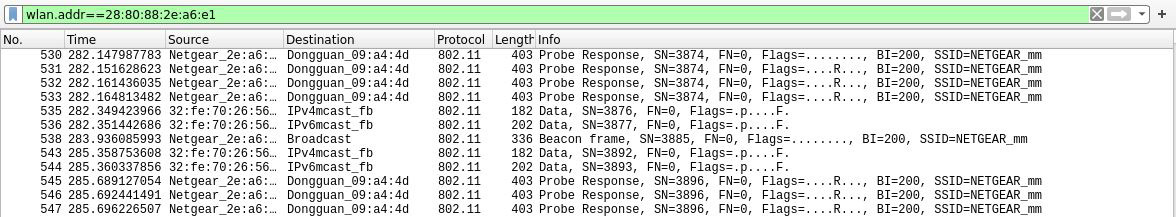
Figure 3.6 – Filtering by BSSID
Let’s get back to the network layer and see what Wireshark can do for us once we’ve established a presence on the LAN. I’ve been sniffing for a few minutes on a network with several actively browsing clients. In a short time, I have a juicy amount of data to analyze.
Active network analysis with Wireshark
As we can expect in today’s world of casual web browsing, almost all traffic is TLS-encrypted. It’s hard to even read the news or search for a dictionary definition without passing through a tunnel. Sniffing isn’t what it used to be in the old days when sitting on a LAN in promiscuous mode was everything you needed to intercept full HTTP sessions. So, our goal here is to apply some statistical analysis and filtering to learn more about the captured data and infer relationships.
In the previous section, we looked at WLAN statistics. Now that we’re established on the network, we can get much more granular with protocol and service-level analysis.
Let’s learn a little more about everyone chatting on the network. In Wireshark parlance, we call all the individual devices endpoints. Every IP address is considered an endpoint, and endpoints have conversations with each other. Let’s select Endpoints from the Statistics menu.
I’m interested in the endpoint with an ASN belonging to the Orange network in France. I can right-click to apply a filter based on this particular endpoint:
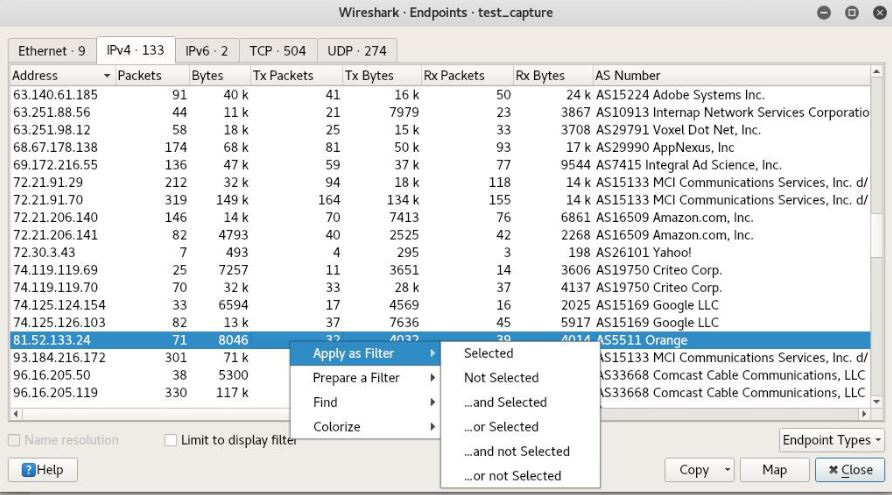
Figure 3.7 – Filtering endpoints
Now, I’m going to review just the HTTP 200 responses from this particular endpoint. I will use this filter and apply it:
ip.addr==81.52.133.24 and http contains 200
I’ve narrowed down five packets of interest out of the 33,644 that we captured. At this point, I can right-click any packet to create a filter for that particular TCP session, allowing me to follow the HTTP conversation in an easy-to-read format:
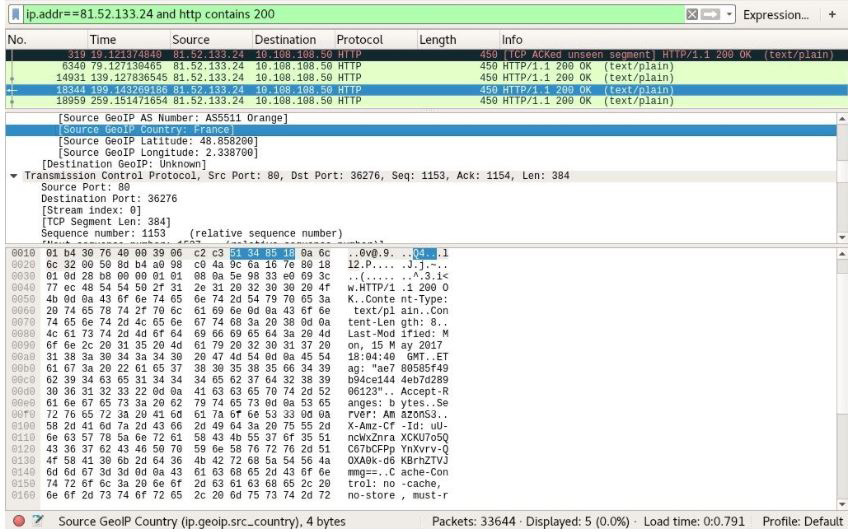
Figure 3.8 – Reviewing the filtered packets
So, what’s going on with this display filter? The syntax should be familiar to coders. You start with a layer and specify subcategories separated by a period. In our example, we started with ip and then specified the IP address with addr. The address subcategory is an option for other layers; for example, eth.addr would be used to specify a MAC address. Wireshark display filters are extremely powerful, and we simply don’t have enough pages to dive in, but you can easily build filters from scratch by reviewing packets manually and honing in on the data you need. For example, we were just filtering out packets from the endpoint that belongs to the AS5511 network in France. Could I filter any packets from France?
ip.geoip.src_country==France
Let’s take GeoIP a step further by looking for any TCP ACK packets going to Mountain View, California:
ip.geoip.dst_city=="Mountain View, CA" and tcp.flags.ack==1
Let’s look for any SSL-encrypted alerts where the TCP window scale factor is set to 128:
ssl.alert_message and tcp.window_size_scalefactor==128
I know what the hacker in you is saying: we can build out Wireshark display filters to fingerprint operating systems just like p0f. Very good, I’m so proud! How about we look for packets that are not destined for HTTPS while matching a Linux TCP signature and layer 2 destined for the gateway (in other words, leaving the network, so we’re fingerprinting local hosts)?
ip.ttl==64 and tcp.len==0 and tcp.window_size_scalefactor==128 and eth.dst==00:aa:2a:e8:33:7a and not tcp.dstport==443
I warned you that this would get fun.
Advanced Ettercap – the man-in-the-middle Swiss Army Knife
In the previous chapter, we fooled around with ARP poisoning in Ettercap. I’m like every other normal person: I love a good ARP spoof. However, it’s infamously noisy. It just screams, HEY! I’M A BAD GUY, SEND ME ALL THE DATA! Did you fire up Wireshark during the attack? Even Wireshark knows that something is wrong and warns the analyst that duplicate use has been detected! It’s the nature of the beast when we’re convincing the network to send everything to a single interface – what is called unified sniffing.
Now, we’re going to take man-in-the-middle to the next level with bridged sniffing, which is bridging together two interfaces on our Kali box and conducting our operations between the two interfaces. Those interfaces are local to us and bridged together, all on the fly, by Ettercap; in other words, a user won’t see anything amiss. We aren’t telling the network to do anything funky. If we can place ourselves in a privileged position between two endpoints pointing at an interface on either side of our host, the network will look normal to the endpoints. Back in my day, we had to manually set up the bridge to pull off this kind of thing, but now, Ettercap is kind enough to take care of everything for us.
The first (and obvious) question is, how do we place ourselves in such a position? There are many scenarios to consider and covering them all would be beyond the scope of this book. For our purposes, we’re going to set up a malicious access point by building on our Host AP Daemon knowledge from Chapter 2, Bypassing Network Access Control.
Bridged sniffing and the malicious access point
In Chapter 2, Bypassing Network Access Control, we built an access point to serve as a backdoor into a network. This access point provided us with DHCP, DNS, and NAT to get us out of the eth0 interface attached to the inside network. The attached client was not a victim; it was the attacker on the outside of the building. This time, we’re creating an access point, but it’s intended for our target(s) to connect to it. The access point will grant them some kind of wanted network access, and the destination network will handle them like normal – in fact, we’re going to let the destination network handle DHCP and DNS, so don’t even bother with dnsmasq this time. The idea is that we’re essentially invisible: aside from providing an access point, we offer no network services. What we will be doing is sniffing everything that passes through our bridge.
These principles can be applied to any bridged sniffing scenario, so I encourage you to let your hacking imagination run wild with the possibilities. For our demonstration, we’re firing up the timeless classic Free Wi-Fi attack. The idea is simple: offer free internet and let the fish come to you. This attack has potential in legitimate pen tests; attacking your client’s users can be difficult in secure networks and setting up free Wi-Fi in a corporate environment is surprisingly effective. (Wouldn’t you like the opportunity to bypass your company’s web filters?) Another possibility is the evil twin concept, where you’re masquerading as a legitimate ESSID, or even the ESSID of a lonely wireless device’s probes, looking for a familiar face in a strange place. (Check out Fluxion if you want to dive deeper into Wi-Fi MitM attacks). Again, I leave the rest to your imagination.
Don’t Forget to Open Your WLAN!
If you’re following along from the previous example with hostapd, your configuration file is probably still specifying a WPA-protected network! Make sure you open that up again with nano and remove the lines about WPA encryption. Don’t forget to change your SSID to something like Free Wi-Fi as well.
First, I must set up my access point. If you’re following the hostapd example from Chapter 2, Bypassing Network Access Control, note the differences here – I don’t need dnsmasq and I don’t need iptables, so I’ll use ifconfig and grep to quickly confirm the subnet of our Ethernet interface’s existing connection, set up forwarding, and prepare the wireless interface for hosting:
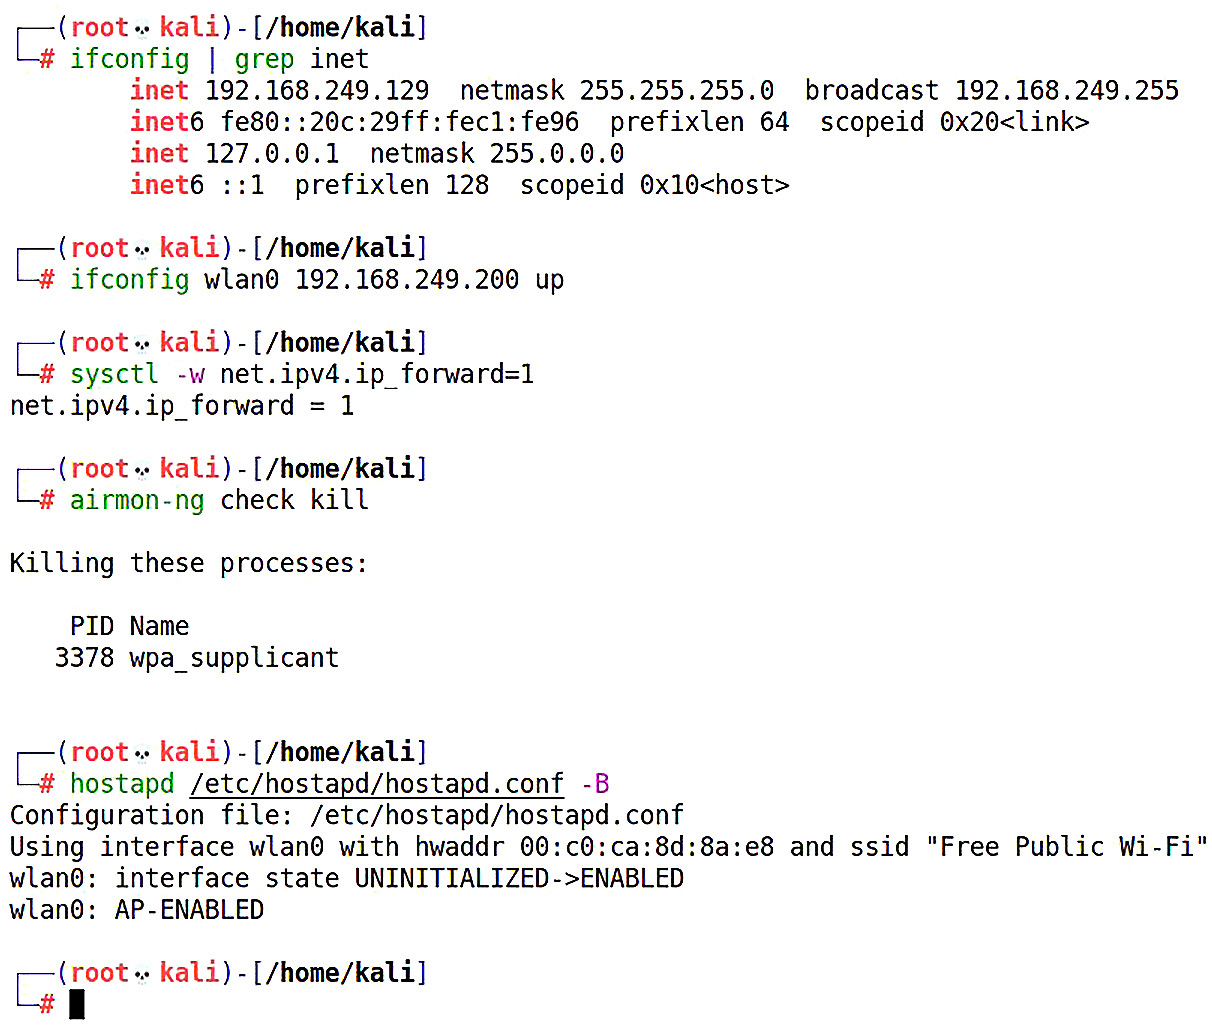
Figure 3.9 – Configuring bridged sniffing with hostapd
I gave the wireless interface an IP assignment in the Ethernet interface’s network. By running ifconfig and piping the output into grep so that it matches inet, we can confirm the assigned IP address, so I’ll just pick another one in that same subnet. I also ran airmon-ng check kill to ensure that any wireless networking utilities are killed, as they will prevent hostapd from doing its thing.
We used the graphical interface last time; I’m going to keep it clean and just fire off this command in a new terminal window:

Figure 3.10 – Firing off the bridge with Ettercap
This command is easy thanks to Ettercap’s behind-the-scenes power to manage the bridge and sniffing:
- -T tells Ettercap to go old school and use a text-only interface.
- -q means be quiet. We don’t want Ettercap reporting every packet to our interface; that’s what our capture file is for. We are analyzing later, not now. Let’s just let it run.
- -B starts up bridged sniffing. Remember, we need two interfaces (in our example, eth0 and wlan0), so I run this flag twice for each interface.
- -w will write the packets to a .pcap file for later analysis in Wireshark.
Then, we must apply ordinary Wireshark analysis. With this privileged position, we can proceed to more advanced attacks:
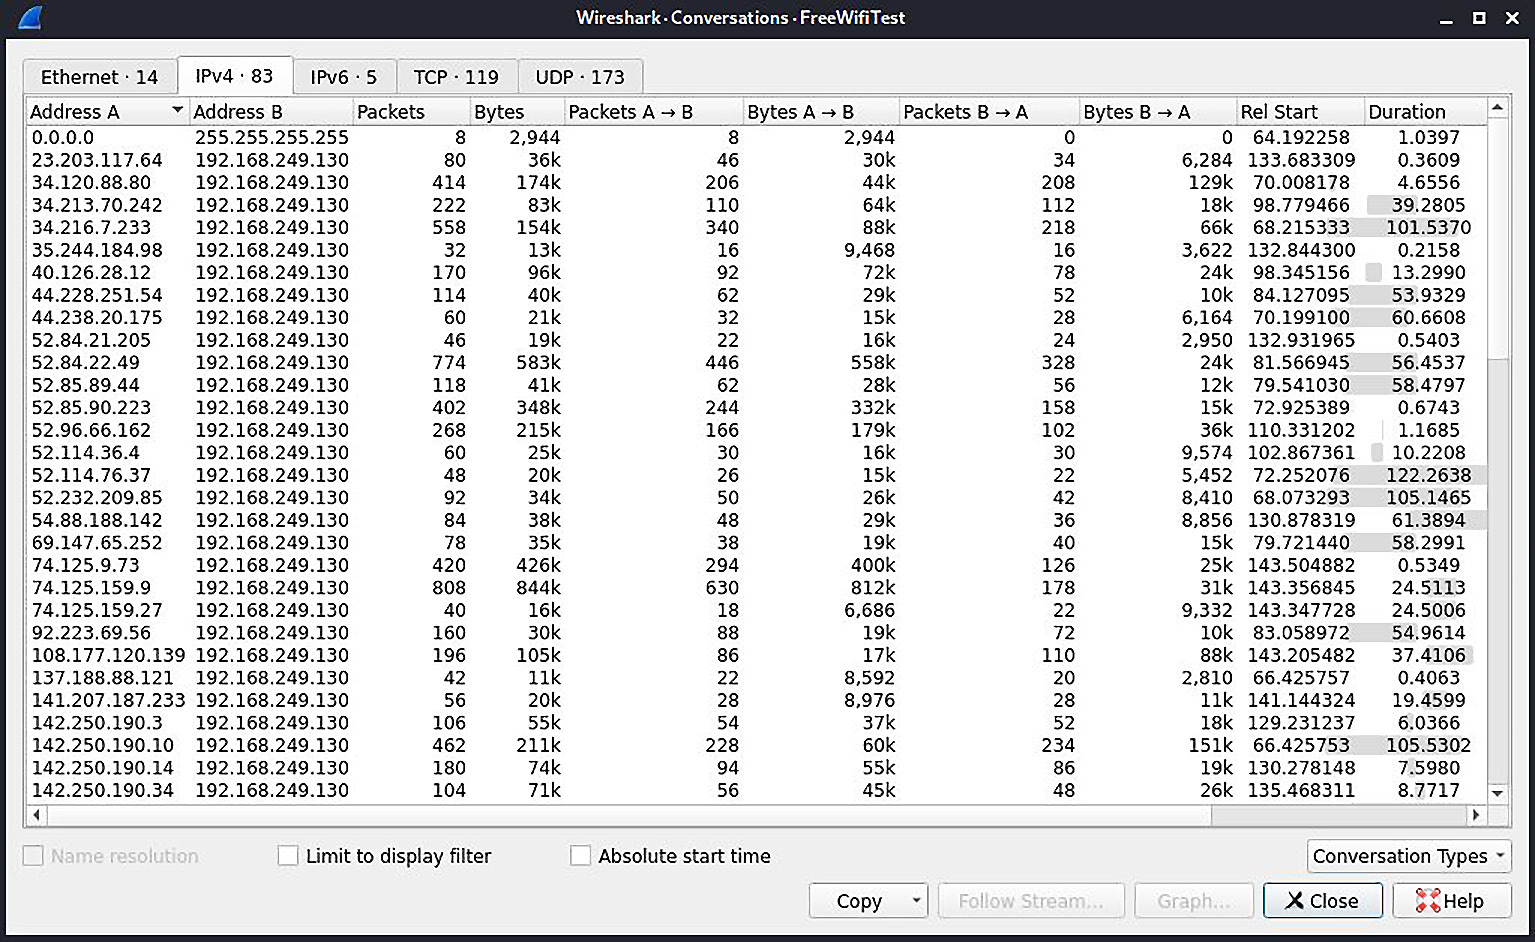
Figure 3.11 – The Conversation view of our bridged sniffing capture file
Now, we’ll pull out our surgical scalpel and learn how to find and even manipulate packets based on their properties.
Ettercap filters – fine-tuning your analysis
We’ve seen just how powerful Ettercap can be out of the box. Ettercap shines due to its content filtering engine and its ability to interpret custom scripts. Ettercap makes man-in-the-middle attacks a no-brainer; however, with filters, we can turn a Kali box running Ettercap into, for instance, an IDS. Imagine the combined power of our bridged sniffing attack and custom filters, which have been designed to interpret packets, and take action on them: dropping them and even modifying them in transit.
Let’s take a look at a basic example to whet our appetite. You may immediately notice the C-like syntax and the similarity to Wireshark display filters. There’s a lot of conceptual overlap here; you’ll find that analyzing patterns with Wireshark can yield some powerful Ettercap filters:
if (ip.proto == TCP) { if (tcp.src == 80 || tcp.dst == 80) { msg("HTTP traffic detected.
");}
}
Translated into plain English, this says, test if the IP protocol is TCP; if so, do another test to see if the source port is 80, or if the destination port is 80; if either is true, display a message to the user that says HTTP traffic detected. This is an example of nested if statements, which are embedded in graph parentheses.
Let’s take a look at an ability that should intrigue the Scapy/Python part of your brain:
if (ip.proto == TCP) { if (tcp.dst == 12345) { msg("Port 12345 pattern matched, executing script.
"); exec("./12345_exec");}
}
In this sample, we’re testing for any TCP packet destined for port 12345. If the packet is seen, we alert the user that an executable is being triggered. The script then launches 12345_exec. We could write up a Python script (and yes, import Scapy to craft packets) that will trigger upon meeting a condition in Ettercap.
Killing connections with Ettercap filters
Now, let’s try to construct a filter to kill SSH and SMTP connections while allowing all other traffic. This will give us hands-on experience with setting up a basic service filtering mechanism on our Kali box. Pay attention: my first shot at this short filter will have a troublemaking function in it. We’ll review the results and see if we can fix the problem.
First, I will fire up nano and create a file with this filter:

Figure 3.12 – Finishing the filter in nano
Let’s review this line by line:
- if (ip.proto == TCP) { is our parent if statement, checking if the packet in question is a TCP packet. If so, the script proceeds.
- if (tcp.src == 22 || tcp.dst == 22 || tcp.src == 25 || tcp.dst == 25) { is the nested if statement that checks if the TCP packet that passed our first check is coming from or destined to ports 22 or 25. The double pipe means or, so any of these four checks will pass the if statement, taking us to the functions:
- msg() displays a message in our Ettercap window. I would always recommend using this so that we know that the filter was triggered.
- drop() simply drops the packet; since we’re in the middle, it means we received it but we won’t be passing it on. The sender doesn’t get any confirmation of receipt, and the recipient never gets it.
- kill() gets aggressive and sends an RST packet to both ends of the communication.
- The two closing graph parentheses correspond to each if statement.
I will save this text file with nano and prepare to compile it.
Why are we compiling the filter? Because interpreting code is slow, and we’re dealing with analysis and manipulation in the middle of the packet’s flight. The compiler is very simple to use and is included, so we can simply issue the command with the name of the file we just created:
# etterfilter [filter text file]
We’ll see the compiler introduce itself and then it gets to work:
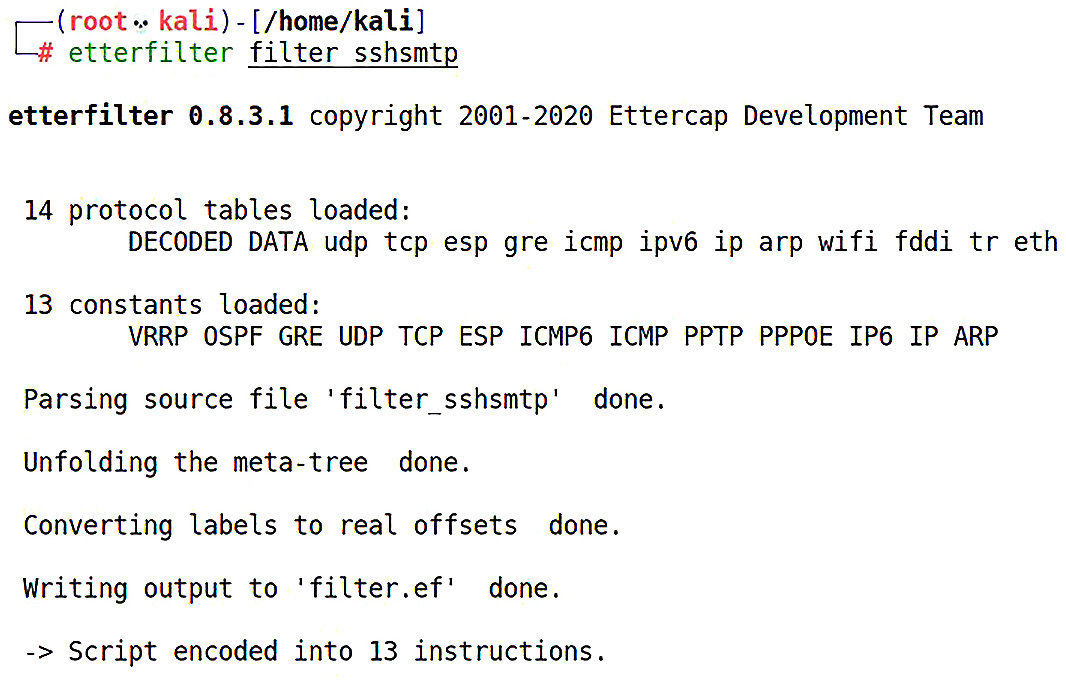
Figure 3.13 – Compiling our filter with etterfilter
The default output is filter.ef, but you can name it whatever you want.
Now, we can simply fire up Ettercap like we did previously, but this time, we’re going to be loading our filter with -F. Ettercap does everything else automatically:
# ettercap -T -q -F filter.ef -B eth0 -B wlan0 -w SSH_SMTP_Filter_Testcapture
I connect to our naughty network, and I try to connect to my SSH server at home. The connection fails, just as we had planned – but the console starts lighting up with my filter message. Let’s look in Wireshark and filter by port 22 traffic to see what’s going on:

Figure 3.14 – Lighting up the LAN with RST packets
What in tarnation? 26,792 RST packets in a matter of a couple of minutes! We just flooded ourselves with RST packets. How did we manage this with such a dinky script?
I know what the hacker in you is thinking: we included a kill function in bridged sniffing, so the filter is running on two interfaces and designed to match any packet going to and from SSH, which would, by definition, include our RST packets. Nicely done – I’m impressed. Let’s recompile our script and take out kill().
That’s better:

Figure 3.15 – Dropping the kill function
The network calms down and our bridge merely drops the packets without sending any RST packets. My SSH client running on our victim Windows box never gets the SYN-ACK it was hoping for:
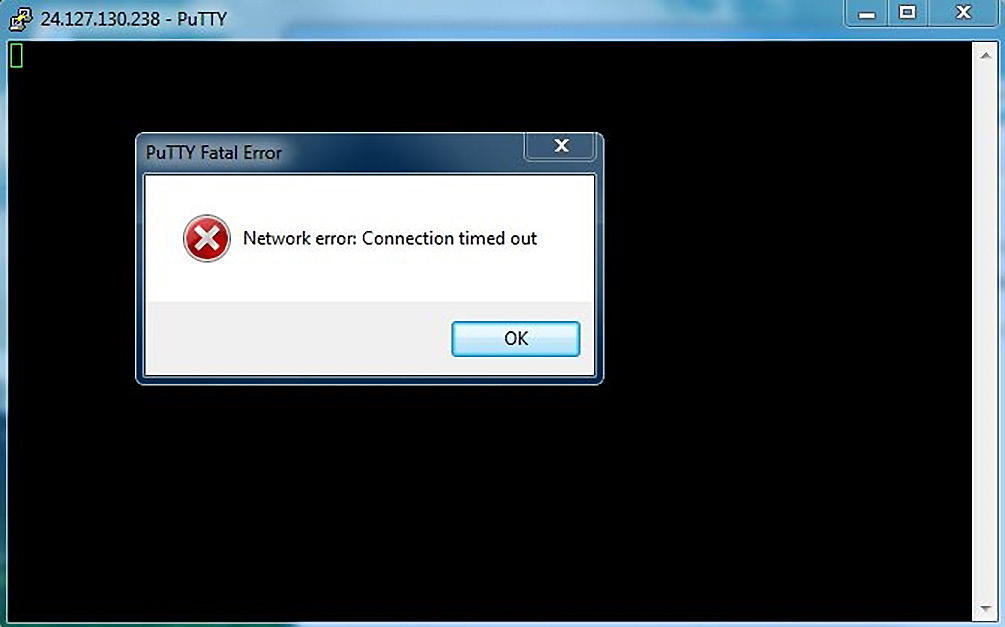
Figure 3.16 – Port 22 successfully dropped
Any good pen tester has a variety of tools at his or her disposal. Often, different tools are comparable to each other in functionality, but one does something better than the other and vice versa. A common pain point for any pen tester is the wonderfully powerful tool that is no longer supported, so you make do with what was last updated a decade ago. Hey, if it ain’t broke, don’t fix it – some attacks, such as ARP spoofing, don’t change over the years at their core. However, any bugs that were present are there for life. Ettercap has proven itself to security practitioners, and we’ve seen its power here, but I’m going to wrap up the sniffing and spoofing discussion with the new kid on the block (relatively speaking): BetterCAP.
Getting better – scanning, sniffing, and spoofing with BetterCAP
We can get started and grab BetterCAP on Kali very easily as it’s in the repository:
# apt-get install bettercap
Back in my day, the legacy BetterCAP used a command-line interface. Now, there’s a very slick web interface to bring sniffing and spoofing into the current century. As with any locally hosted web interface, you’ll want to be aware of the credentials that are used for logging in. Grab nano and configure the HTTP caplet at /usr/share/bettercap/caplets/http-ui.cap:

Figure 3.17 – Configuring the HTTP UI
Take a Break from the Command Line
Once you’ve logged in with the HTTP UI, you can modify any caplet parameters from there, including the username and password specified here.
Now, let’s get this party started by running the bettercap –caplet http-ui command. Then, you can fire up your browser and head on over to your localhost:

Figure 3.18 – The Events window for BetterCAP
Our first stop is the Events tab. You can also keep an eye on what’s happening in the terminal window. Since we haven’t started anything yet, not much is happening here. Let’s click on the LAN tab and see if we can find some targets. Click the net.probe play button and grab some coffee while BetterCAP does the rest:

Figure 3.19 – Starting the network probe
Immediately, we start probing the local network for hosts – and boy oh boy, those are some fast results! Hopefully, this concerns you: there’s no way it’s that fast without being all kinds of noisy. So, let’s take a look at Wireshark while we’re running this module:
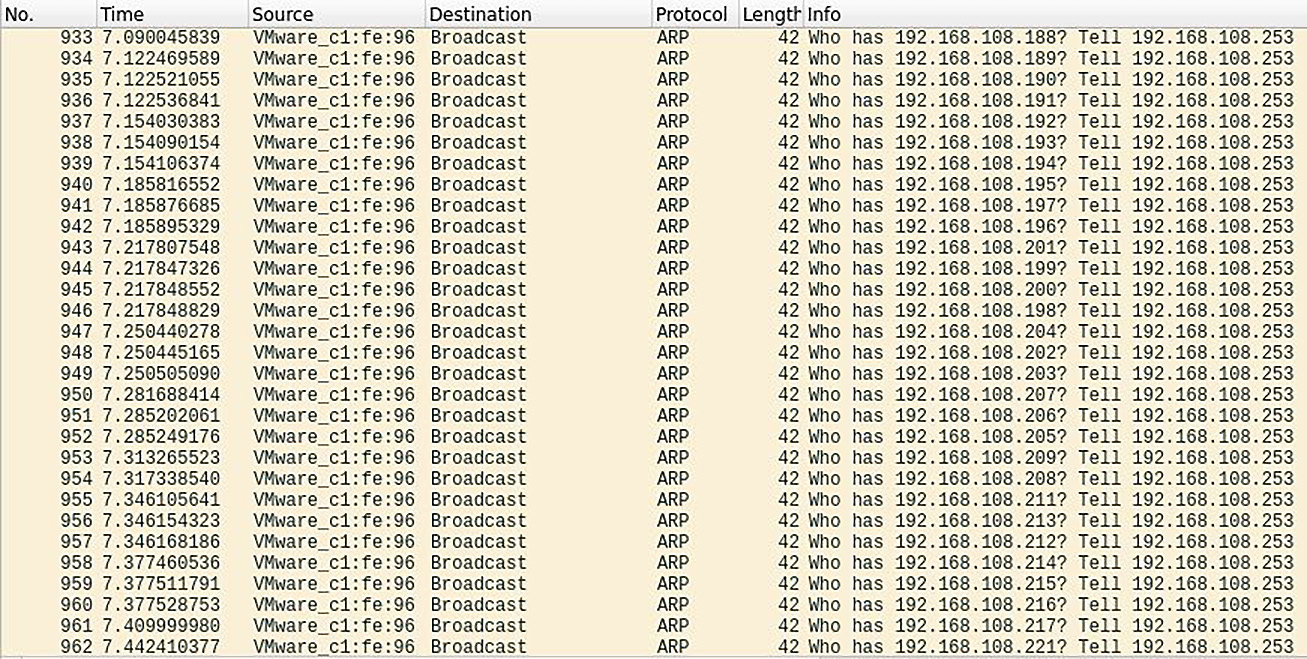
Figure 3.20 – The net.probe module behind the scenes
There you have it – it’s an ARP sweep of the local network at a rate of over 80 probes per second. In a real-world pen test, you’ll probably want this much lower (unless you are stress testing or making a point to your client). Click on the Advanced tab at the top, find the net.probe module in the listing on the left, and adjust the net.probe.throttle value based on your needs:

Figure 3.21 – Throttling the LAN probe
I know what you’re thinking now: whoa. There is a lot of cool stuff here. This is where you can get a feel for the caplets that are installed and how they work. Along the left-hand side of the screen is a listing of BetterCAP’s capabilities. You’ll find arp.spoof to pull off the work from this chapter with a beautiful interface (move over, Cain sniffer). Some of the additional flexibility offered by BetterCAP can be found under Parameters and includes the following:
- arp.spoof.fullduplex allows you to poison the ARP table of just your target, or the tables of both the target and the gateway. In other words, are you pretending to be just your target, or both your target and the gateway? Since the target intends to chat with the gateway, setting fullduplex to false means you’ll only see the target’s half of the conversation. This may be desirable to stay under the radar.
- arp.spoof.internal simply attacks the entire LAN, allowing you to capture chatter between hosts. This need depends on the specific environment you’re in.
- arp.spoof.skip_restore can be thought of as whether you’ll stop your attack rudely or politely. Remember that the ARP table is maintained by each host independently; the table will only change when it’s updated by ARP packets on the wire. If you run your attack, grab the loot you need, then unplug and run away, you’re leaving the network looking for your MAC address. Restoring in this context is what I call re-ARPing. Setting skip_restore to true is more disruptive.
- arp.spoof.targets allows you to specify the targets for your attack. What’s nice about this field is that it accepts Nmap format as well, so it’s easier to drop in that data.
- arp.spoof.whitelist is for those situations where you need to specify your non-targets.
What you would normally be doing with the set command in BetterCAP is what the HTTP UI is handling for you here. My favorite thing about this is the aesthetics: it makes presentations for the client more exciting.
Finally, click on the Caplets tab to get a look at the attacks you can pull off once BetterCAP has placed your interface in the privileged position you desire. I like to think of these as recipes using BetterCAP’s native capabilities. For example, check out the parameters under http-req-dump. You’ll see that it configures net.probe, net.sniff, http.proxy, https.proxy, and arp.spoof. For those of you who are adventurous, you’ll find exceptional configurability for your needs.
Summary
In this chapter, we learned about passive versus active sniffing. We started by exploring wireless LANs in monitor mode, which allowed us to capture data without revealing our presence. We used Airodump-ng to organize the wireless environment and inform more precise sniffing with Wireshark. After exploring the basics with Wireshark, we moved on to advanced statistical analysis of both passive and active sniffing methods. For the active sniffing phase, we connected to a network (thus revealing our presence) and captured data visible to our card. We applied advanced display filters to hone in on interesting packets within even very large network dumps. We then moved on to advanced Ettercap sniffing techniques, focusing on bridged sniffing with two interfaces. To demonstrate the power of this attack, we configured a malicious access point and set up our Kali box to function as a full-fledged traffic interceptor and IDS, including using Ettercap filters to capture and drop select data from the network. We then introduced BetterCAP, a sophisticated alternative to Ettercap.
In the next chapter, we will discuss Windows password fundamentals, and we will demonstrate practical attacks to capture Windows credentials off the wire and a host to feed into a password cracker. We will then discuss password cracking methods.
Questions
Answer the following questions to test your knowledge of this chapter:
- You put your wireless card in monitor mode and capture raw wireless packets without associating them with a WLAN. What sniffing concept is this?
- The BSSID of an access point is the same as the hardware’s _____________.
- Individual devices that participate in conversations are called ___________ by Wireshark.
- What is the Wireshark display filter called that’s used to find any packet with the TCP ACK flag set?
- When writing Ettercap filters, you can put a space between a function name and the opening parenthesis. (True | False)
- What Ettercap filter function will quietly prevent packets from passing to a destination?
- How do you reduce the verbosity of Ettercap’s command-line interface?
- What is the file extension of a binary Ettercap filter?
- What does ICMP stand for?
Further reading
For more information regarding the topics that were covered in this chapter, take a look at the following resources:
- Ettercap main page: https://linux.die.net/man/8/ettercap
- etterfilter main page, which includes details about scripting syntax: https://linux.die.net/man/8/etterfilter
- Advanced Wireshark usage guide: https://www.wireshark.org/docs/wsug_html_chunked/ChapterAdvanced.html
- RFC 792: https://datatracker.ietf.org/doc/html/rfc792
- RFC 793: https://datatracker.ietf.org/doc/html/rfc793