Chapter 5: Using Conversion Goals
In This Chapter
![]() Setting conversion goals
Setting conversion goals
![]() Analyzing goal conversions
Analyzing goal conversions
![]() Handling technical issues with goal tracking
Handling technical issues with goal tracking
![]() Interpreting conversion data
Interpreting conversion data
A major step in moving from reporting to analytics is knowing what you want to measure in terms of your business goals. This goes beyond visits or traffic, and usually moves to leads or sales or something similar.
 In the biz, we call those conversions. A conversion occurs any time a visitor changes from a visitor to a customer (a sale) or a potential customer (a lead). Conversions can also occur when a visitor somehow takes a significant step toward offering value to your business. Regardless, a visitor converts into something more valuable than a passerby. Get it?
Although tracking page views, time on site, and traffic quality is helpful, you need to know how your site is helping you achieve those goals. This is where web analytics really shines. Virtually all major web analytics packages — including free ones, such as Yahoo! Analytics and Google Analytics — support sophisticated goal tracking.
This chapter talks about selecting, tracking, and analyzing conversions using Google Analytics. If you use a different analytics program, you can still follow along. Most work similarly to Google Analytics.
Determining Key Performance Indicators
Goals are based on specific metrics that drive your business and website. These metrics — what make or break success — are key performance indicators, or KPIs. KPIs track the health of your online marketing efforts, for the good (success KPIs) or for the not-so-good (warning KPIs).
 A KPI is not the same as a conversion goal! A KPI is a general measure of success for your business. It can be applied to your business’s online efforts, offline work, brick-and-mortar store, website, or anything else. A conversion goal, on the other hand, is a specific event: an online sale or an in-store sale. You measure KPIs in terms of conversion goals. Don’t confuse the two.
Before you go any further, write down your KPIs.
The ideal KPI will
• Give you at-a-glance insight: This gives you information as to how your website is performing.
• Stand on its own as a measure of success or failure: You shouldn’t need to look at other data to get a basic idea of site performance.
• Make business sense: Interpreting a typical KPI won’t require an expert web analyst.
• Be long-lived: KPIs can change, but not often. You want to be able to compare KPI data day by day, month by month, and year by year. (See the section “Maintaining consistent goals,” later in this chapter, for more on the importance of consistency.)
Success KPIs are those that, if they increase, indicate you’re doing well. They might include
• Number of sales
• Number of leads
• Conversion rate for leads or sales
• Number of E-Mail a Friend submissions
• Number of e-mail newsletter sign-ups
• Number of white paper (or other) downloads
Warning KPIs are those that, if they increase, mean something could be wrong. They might include
• Cost per sale
• Cost per lead
• Form abandonment rate
• Complaint frequency
• Bounce rate
No two businesses are exactly alike, so chances are you’ll have some unique KPIs. The most common KPIs are
• Cost per sale
• Cost per lead
• Revenue
• Return on investment
For a very detailed look at all things web analytic, check out Web Analytics For Dummies, by Pedro Sostre and Jennifer LeClaire (published by John Wiley & Sons, Inc.).
Write down at least two (and preferably more) KPIs for your website. After you have your KPIs, you’re ready to move on to the next step — setting your conversion goals.
Defining Conversion Goals
Goals? KPIs? What’s the difference? It might seem like they’re the same, but they’re not. KPIs measure performance. Goals measure success and only success. All goals are KPIs. Not all KPIs are goals. Dizzy yet?
KPIs are signs of a response to your message and site. Goals are what happen when the visitor does what you want him to. Goals are always narrowly defined success KPIs, such as
• A sale
• A lead
• An e-mail newsletter sign-up
• A download of a specific article
• A view of a specific page
Maintaining consistent goals
You must select goals you’ll have around for the duration of any campaign. Consistency is critical.
For example, say that you’re doing a new product launch campaign. As part of that campaign, you’re offering to send visitors a free product in exchange for an e-mail sign-up. You need to track those e-mail sign-ups throughout the launch campaign! If you switch from tracking e-mail sign-ups to, say, tracking product purchases halfway through, you’ll have no way to compare the performance of different advertising strategies.
Many goals will exist for the entire life of your business: Sales and leads are great examples. In those cases, it’s important that you track those goals the same way over time.
For example: You’re tracking the sales conversion goal based on views of the final checkout page. Then you decide to track the final order confirmation page, instead. That will throw off your numbers and make it impossible to track performance over time.
Checking out conversion goal pages
 Here’s one hallmark of a great conversion goal: a specific, unique goal page that indicates conversion. Consider these examples of a conversion:
• If a customer buys something from your online store, the last page he should see is the one that reads “Thank you for your business!” and has your order information on it. You know, for certain, that anyone reaching that page bought something and therefore did something you wanted him to do.
• If a visitor subscribes to an e-mail newsletter, he should land on a Thank You for Your Subscription page. That page is the goal page for e-mail sign-up. See Figure 5-1 for an example.
• If a customer completes a Contact Us form on your website, the resultant Thank You page for that form is a goal page, too.
Figure 5-1: The goal page for an e-mail newsletter sign-up.

A goal page almost always marks the end of the goal process. In other words, it marks a conversion. The visitor has become a customer, lead, or subscriber. The visitor has converted from being a generic audience member to a participant in your business.
Figuring out your conversion goals
Now, it’s time to define the goals and goal pages for your site. Review your KPIs. Do any of them map easily to a specific goal on your site? For example, a KPI of revenue would map to the Thank You for Your Order page in your shopping cart.
• If your KPIs are some of your goals, find the goal page for a completed conversion for each goal. Then visit that goal page and copy and paste that page’s address (as shown in Figure 5-2) next to the KPI (as shown in Figure 5-3).
• If none of your KPIs are goals, look at your site again. If you still can’t find anything, read the next section to find out a bit about finding those hidden goals.
Finding hidden goals
Your site might not have any clear, well-defined goals if it
• Doesn’t have e-commerce
• Lacks an e-mail newsletter (shame on you!)
• Doesn’t collect leads
Regardless, all sorts of measurable goals reside on your site. They might be hiding, but they’re there. You just have to coax them out.
Figure 5-2: Copy the goal page’s address.

Figure 5-3: The goal and the goal page address.

Hidden goals might include
• A download: If you have a white paper, brochure, or other information on your site in PDF format, folks might download it. If they download it, chances are they’re more interested than the average passersby. With a little work, you can track those downloads as a goal.
• A page view: If folks view one particular page on your site, does that tell you they’re going to call? Think about those folks who view the Contact Us page. You can easily track that as a goal.
• A video: If a visitor watches your entire video about your corporate philosophy, that’s definitely a win. Someone with a bit of technical expertise can help you track completed views as goals, too.
• A Forward to a Friend link: Does your site have a Forward This Page to a Friend tool? That’s definitely a goal. Track how many folks forward pages to friends; those people are interested enough to recommend you.
• A ZIP code search: If you have lots of stores and a visitor tries to find one, that’s a conversion.
You can have even fancier hidden goals: You can track all visitors who look at more than seven pages on your site as a conversion, for example. Tracking these types of goals generally requires a fair amount of expertise, though, so this topic is not discussed in this chapter.
Hidden goals are rarely worth as much as a sale, but they’re still conversions because visitors who complete them have taken a step toward working with you. Track those visitors, and you get a peek at how your site is performing in terms of your business.
Attaching Monetary Value to Goals
Goals don’t mean much if you can’t attach some real value to them. All goals have some worth to your organization. It’s important to track that worth because you need to see whether you profited in landing that conversion.
For example, say you sell a widget in your online store for $100. Yay! Unfortunately, when you look at your ad spending, you spent an average of $120 per sale. Hmm. That conversion actually cost you.
Attaching and tracking value keep you focused on growth and keep you from spending two dollars to earn one.
Valuing e-commerce conversions
Easy, right? An e-commerce conversion is worth the sale amount, minus any costs:
ECOM Value = Sale Amount - (Shipping + Handling + Other)
You’ll want to figure out the average value of an e-commerce conversion, too, if possible.
But you need to figure out another critical metric: namely, the lifetime value of that conversion. How much will that new customer earn for you over time? You must know this! It could be perfectly reasonable to spend $120 to get a $100 sale if the lifetime value of that customer is $500.
Here’s how you can figure it out, where Customer Lifetime is the average length of time a customer buys from you with no additional outside influence:
Lifetime Value = (Total Sales/Year ÷ Number of Customers) ÷ Customer Lifetime
By knowing the lifetime value, you put your sales in context and make sure that you don’t shut down an ad buy that’s actually paying off for you in the long run.
Valuing leads
Attaching a value to a lead is a bit more difficult. Someone fills out a Lead Request form, which is one of those really common Please Send Me More Information forms you find on many websites. That doesn’t directly translate into value for your company.
So, you need to figure out the value of a lead, using averages:
Lead Value = (Lead to Customer Conversion Rate) x (Avg. Customer Value)
Here’s an example. Say you run a business where your website generates 100 leads per year; of those leads, 10 percent become customers. The average customer pays $10,000 per year for a consulting contract. So
10% x $10,000 = $1,000
Your average lead value is $1,000.
You do need to be able to compute the value of a customer and the conversion rate of leads to customers. That’s important to your business regardless of Internet marketing, though. If you don’t already know customer value, divide total sales over at least one year by the number of customers in that year. It’s not perfect, but it’ll do.
Valuing soft goals
Soft goals, like a white paper download, are even harder to track. The connection between that conversion and an ultimate conversion to a customer is distant. So take any numbers you compute here with a grain of salt.
To figure out the value of a soft goal, you must know the following:
• Total goals: The number of downloads, page views, or anything else.
• Estimated conversion rate: This is the hard part. You might not get enough information to track conversion rates directly, so you have to estimate based on three different statistics:
• Total unique visitors (each visitor returning to your site any number of times) to your site
• Percentage of those visitors who complete the goal (% Goal)
• Percentage of unique visitors who become customers (% Conversions)
• Average value of those customers (Avg. Value)
Then calculate the conversion rate, as follows:
Soft Goal Value = % Goal x % Conversions x Avg. Value
Here’s an example of a soft goal–value calculation: Say you have a white paper on your site. You know the following:
• Your site receives 10,000 total unique visitors per year.
• Ten percent of those visitors (1,000 people) download the white paper (% Goal).
• If you keep track of their names, you know that 10 percent of the white paper readers become customers (% Conversions).
• You can then expect that in one year, you’ll get $250,000 in sales from 25 customers, or an average value of $10,000/customer (Avg. Value).
So, the value of one white paper download to your business is:
10% x 10% x $10,000 = $100
So one white paper download is worth $100 to your business.
Valuing the immeasurable
Some goals can’t be easily valued. A voter doesn’t carry a monetary value (hopefully). Neither does a potential parishioner in a church.
You don’t have a great way to attach a consistent value to these goals. But you can assign point values to them.
You can assign an arbitrary value: one point per new person who visits a political website, for example. Then, compute the cost of each point over the longest possible time period and use that cost as your measure. Work to improve on that cost, and you have a cost instead of a value, but it’s still a baseline metric.
Setting Up Goal Tracking
Setting up goal tracking is straightforward — if you know the goal page.
Broken or badly configured shopping carts where the last checkout page was viewed aren’t so easy to track. Be sure to test and verify that your goal page really is unique within your site, and that multiple goals don’t share a single page.
In a program like Google Analytics, you identify the goal page to the program, and it does the rest. Here’s how:
1. Log in to Google Analytics.
2. Select the website for which you want to track the goal.
3. At the upper-right of the screen, click Admin.
4. Click Goals.
5. Click +Goal under any goal set.
6. Open a new browser window and go to your website.
7. Complete the form, checkout, or other process you want to track.
8. Copy the address of the final page in the process.
It’ll usually be a Thank You–style page. See the section “Checking out conversion goal pages,” earlier in this chapter, for an introduction to goal pages.
9. Paste that address into the Goal URL field.
10. Name the goal, leave the other settings alone (you find out more about those in Google Analytics Help, later), and then click Finish.
After your goal is configured (refer to Figure 5-3), Google Analytics reports all goal completions.
You can then compare paid search keywords, organic search keywords, advertising, e-mail campaigns, and most other aspects of site traffic in the context of goal conversion.
You can also use Google Analytics to set a minimum time on site, page views/visit, or a specific JavaScript-fired event. Read Web Analytics For Dummies for more information.
Setting up e-commerce tracking
If your site includes a store, you’ll probably want to know how much money you’re earning from each traffic driver — a search engine result, a review on another website, or a link from a blog — or ad on the site.
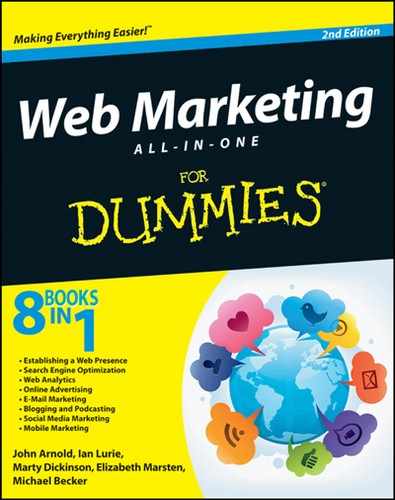
To set up this tracking in Google Analytics and in most other reporting tools, you need to alter the final page of your checkout process to send the sales data to the tool. The code will typically resemble what is shown in Figure 5-4.
If that looks like gibberish, don’t try to set up e-commerce tracking on your own. Instead, talk to your developer or webmaster about getting set up.
Even if you have to pay someone to get e-commerce tracking working, though, it’s worth it. Figure 5-5 shows you just how much detail you can get with e-commerce data built into your analytics report. Figure 5-5 shows the value of a page view on a single page, based on how many customers made a purchase after seeing that page. That kind of insight can help you steer customers to the pages that will best answer their questions and likely get them to buy.
Figure 5-4: Tracking code for an e-commerce site.
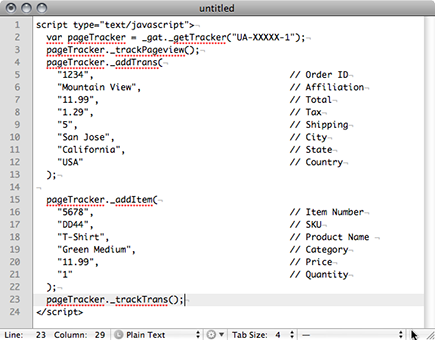
Figure 5-5: Dig deep with e-commerce tracking.
Tracking goals manually
If for some reason you can’t set up goal tracking in your traffic-reporting tool, all is not lost.
Remember that your goals have goal pages. You can still track those pages by page view. You can see goal conversions by looking at the top pages report. Follow these steps:
1. In Google Analytics, go to the Top Content report.
2. Look for the page that is your Thank You page at the end of the checkout process or that appears after the reader completes the information request, or whatever else represents a completed conversion goal.
Figure 5-6 shows one conversion for one unique page view on an e-mail sign-up confirmation page.
You can check what’s driving traffic to that goal page, too, by clicking the /emailsignup.htm link in the Page column of the report. See Chapter 3 of this minibook for a refresher on tracking referrers.
Figure 5-6: Top pages showing conversions.

Interpreting Conversion Data
After tracking is set up, the reporting tool shows you conversion data for your goals in a separate report. That data requires some interpretation. The following sections offer a few examples of typical problems and opportunities you might find.
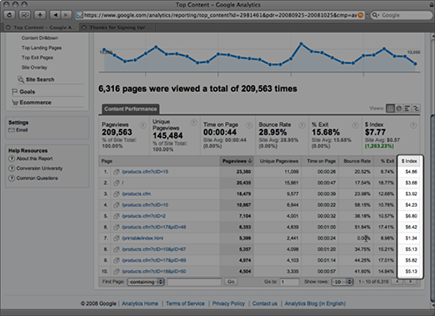
The costly keywords
The first thing to look at is your list of keywords generating traffic to the site. Some of them are pulling their weight; others aren’t.
Figure 5-7 shows that one such keyword isn’t generating any revenue. If you’re spending money on a keyword, consider whether those are dollars well spent. You might want to let go of any keywords that aren’t generating revenue.
Almost any paid search campaign, no matter how well managed, can benefit from an occasional review of actual conversion performance. See Book IV for more about paid search.
Figure 5-7: The keywords report.
The hidden gold mine
Sometimes, one page or product on your site generates a far higher conversion rate than the others. A report like the content report with dollar index in Figure 5-8 can reveal them.
In that report, it’s clear that one page is generating incredibly high value because it has a very high $ index. It might be a fluke; but then again, it might not. But it certainly pays to check.
Figure 5-8: A Content Performance report with dollar index.

The great landing page
Along the same lines as the Hidden Gold Mine, conversion data can show you the one page on your site that drives the best or worst conversion rate when it acts as a landing page.
A landing page is any page from your site at which visitors from other sites arrive. They land there.
Because search engines and other websites link to whatever page on your site they choose, every page of your site could be a lander. So you need to spot which pages are becoming landing pages, and adjust them to best answer visitors’ questions.
Look at the report shown in Figure 5-9. It shows a few pages that have become major landing points for visitors coming from other sites.
You can use that data to find the landing pages that get the most traffic, and then make sure that they’re also driving proportional conversions. If they are, great! You’ve confirmed that things are working. If they aren’t, you can tweak them to do a better job.
Figure 5-9: A Landing Pages report.
