
Chapter 3: Measuring Your Best Referrers
In This Chapter
![]() Defining a referrer
Defining a referrer
![]() Analyzing referrers
Analyzing referrers
No Internet marketing campaign can survive — let alone succeed — without referrers, the web pages that point to your website. (You can find the basics of referrers in the previous chapter.)
But the business intelligence you can gain from this seemingly simple stat goes far, far deeper. It pays to have a really solid understanding of this metric, which is why measuring referrers is the sole subject of this chapter.
 If you’re using a log file–based tracking solution, make sure that your server is set up. Otherwise, you could miss a lot of valuable referrer data. (Flip to Chapter 1 of this minibook for details on tracking solutions that use log files versus JavaScript.)
You can apply referrer data to improve your online business in so many ways. This chapter barely scrapes the surface of referrer tracking. Here, you find out where referrer information comes from, basics about stats you find in your referrer data, and examples for analyzing referring site data. In the next few chapters, you discover how to start combining other metrics — such as conversion rates and visit quality — to help you get even more value from this data.
Understanding Referrers
Geekinese alert! This section has to get a little technical so you’ll understand exactly how referrers are tracked and what the tracking data means. Don’t let it scare you off. You’re a smart person. You bought this book, after all.
Here’s how referrer tracking works in the background as you (or your visitors) use the Internet:
1. You use a search engine, visit a website, or receive an e-mail message.
2. You click a link on the page.
3. That link directs you to another website.
4. When you land on that other website, the web server that powers that site asks your web browser where you came from.
5. Unless you turned off this feature, your web browser delivers that information — the referrer — to the web server.
6. The web server logs the data.
7. If you’re using a JavaScript web bug–based traffic-reporting tool (see Chapter 1 of this minibook), your reporting tool logs it, too.
That referrer data typically includes
• The referring site address, such as www.google.com
• The complete referring URL
For example, if you came from a search for buggy bumpers on Google, the URL might be google.com?q=buggy+bumpers. If you came from the contactus.htm page on a company site, the URL might be www.thesite.com/contactus.htm.
With that data, any good traffic-reporting tool can determine
• Where a visitor came from
• If the visitor came from a search engine, what keywords that person used to find your site
• The specific page on the referring site from which the visitor came
• Sometimes, whether the visitor clicked a specific ad or link on that page
You can see why referrer data is so valuable. With it, you can figure out which websites, keywords, and ads generate sales, leads, or other quality visits to your site.
Without referrer data, you’re driving with your eyes closed. But enough negativity. Time to talk about driving with your eyes open.
Checking Out the Referring Site Data in a Traffic Report
Most reporting tools don’t show referrer data front and center on the main dashboard. You need to drill down to find it. Using Google Analytics as an example, this section walks you through the steps of finding your referring sites and introduces the common metrics you see along with those sites.
Although the following steps focus on Google Analytics, you can use these basic steps to work with most reporting tools. To find your referrals, follow these steps:
1. Go to www.google.com/analytics to get to Google Analytics.
Chapter 1 of this minibook explains how to get started with Google Analytics.
2. Click Traffic Sources in the sidebar on the left.
If you’re using a different traffic-reporting tool, Traffic Sources might be called Referring Sources, Referrals, or Links. Be sure to click around if you don’t see the referrer reports right away.
 If you can’t find a traffic sources tool, your traffic-reporting tool might not be properly configured. If that’s the case, it’s time to have a chat with your webmaster.
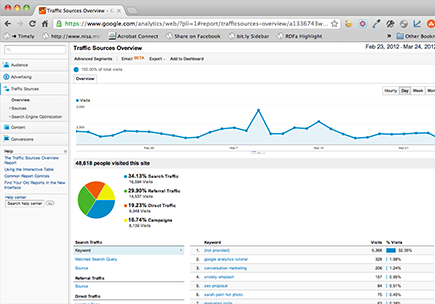
3. Check out the overview page to see which websites send you traffic.
The graph shows the flow of traffic from referring sites. The list below the graph shows all the sites that sent you traffic.
In Figure 3-1, the graph at the top shows overall traffic from other sites. The rest of the page gives you a quick at-a-glance view of search traffic, and the breakdown between search, nonsearch, direct, and campaign-related traffic.
Figure 3-1: The Traffic Sources dashboard in Google Analytics.
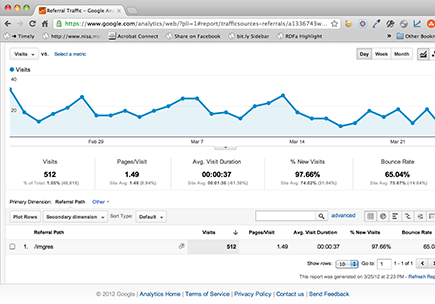
4. Click the Sources and then Referrals on the left side of the screen.
This will show you all nonsearch referring sites, as shown in Figure 3-2.
Figure 3-2: Referring sites in Google Analytics.

You’ll see six different categories of information. Here’s what each category means:
• The Source is where the visitors came from: the site.
• Visits tells you how many clicks you got from that referring site. Note that these are visits, and not unique visitors. Some reporting tools use one, and some use the other. See Chapter 2 of this minibook for the difference.
• Pages/Visit shows the average number of pages visitors looked at on the site after coming from this referrer.
• Avg. Visit Duration shows the average time that visitors spent on the site after coming from this referrer.
• % New Visits tells how many visitors came to the site from this referrer who hadn’t previously visited the site in this time period. This data can help you see whether the referrer is sending you new visitors, or just referring the same visitors to you again. Both might be valuable: A new visitor is a potential new customer.
• Bounce Rate shows how many people came from this referrer, looked at one page on the site, and then left without looking at any others. A high bounce rate isn’t necessarily bad, but it bears investigation.
Some referrer reports include an item called Direct or Not Set:
• Direct: Someone came to your site by typing your web address directly into his web browser. Because this visitor didn’t click a link to get to your site, you have no referrer.
• Not Set: This might mean the same thing. Or, it might mean that for whatever reason, the reporting tool couldn’t interpret the referrer.
Analytics isn’t an exact science.
In the next section, you drill a little deeper into the referring sites data and check out examples of what you can glean by investigating your referring sites.
Analyzing the Referring Sites Data
You can turn a Referring Sites report into real business intelligence by asking yourself three questions (using Figure 3-2):
• Which sites sent you the most traffic?
In Figure 3-2
• StumbleUpon is far and away the biggest referrer.
• Twitter is second. Any click from t.co is a click from Twitter.
• Then comes Facebook.
If any of your top referrers come as a surprise, you’ll want to do some research.
• Which sites sent you the most attention?
In Figure 3-2
• StumbleUpon generates a healthy two pages per visit (not bad for a blog), but less than 1:07 time on the site. If your goal is to balance time on site and pages per visit, StumbleUpon isn’t the best site to be getting the most attention.
• Facebook generates fewer visitors, but they spend over twice as much time on the site.
• Google+ also sends quality visitors who pay attention.
• What insights can you gain?
The answers to this question are a bit more open ended than the preceding ones, but here are a couple of thoughts to glean from Figure 3-2 to give you an idea of what you might do with your referral data:
• StumbleUpon sends a lot of traffic, but those visitors don’t stick around very long. Can you improve the stickiness (the length of time they stay on the site) for StumbleUpon users? This might prove difficult, but that site is a huge traffic generator, so it’s good to take better care of that audience.
• Google referrals only show a time on site of about 44 seconds. That’s very low compared with the site average (1:38). Is the site broken for folks coming from whatever Google property they’re using?
The following steps outline an example of how you might dig a little deeper into your referral data by using Google Analytics, using that Google Image Search referral as an example:
1. From the Referring Sites overview page, click Google in the Sources column on the Site Usage tab.
What appears on the screen is shown in Figure 3-3.
Ah-HAH! It’s mostly Google Image search (imgres).
Figure 3-3: This information is not very helpful.
2. Click the link (imgres in Figure 3-3) to dig a little deeper.
This information isn’t very helpful because what you want to know is which keywords generated those referrals.
3. To see the keywords, choose Traffic Sources: Keyword from the Secondary Dimension drop-down list.
The result is another dead end (although keywords aren’t always a dead end, as the next section explains).
You’ll get used to dead ends like these if you do web analytics long enough. Luckily, you have other options.
4. Choose Landing Page from the Secondary Dimension: Traffic Sources drop-down list.
The Landing Page option shows which pages on the site generated these referrals, as shown in Figure 3-4.
Interesting. The results show that the number-one landing page was a post that contains an image of Snidely Whiplash (a cartoon character from the Rocky and Bullwinkle series).
That information is pure gold: At least some of the Google Image referrals are relatively worthless. They’re folks looking for Snidely Whiplash, but that’s not the main focus of the blog (which is Internet marketing).
Figure 3-4: See which landing pages generate referrals.

No hard-and-fast rules exist for what’s “good” or “bad” traffic. That’s why no one should tell you, “More than one minute is a good time on site stat.” You have to see what’s average for your site and go from there.
See how powerful referrer data is? In just a few minutes, you can diagnose a possible problem, find the source, and eliminate it. But wait, there’s more!
Tracking Referring Keywords
If you’re getting traffic from search engines (and you’d better be), folks are finding you by searching on keywords. Knowing which keywords they’re using to find you gives you a hint as to the questions they might need to have answered when they first land on your site.
This section holds true for both paid and unpaid keywords.
The following steps walk you through an analysis of referring keywords, using Google Analytics and blog results:
1. Go to www.google.com/analytics and log in. Then click the site profile for which you want to see the report.
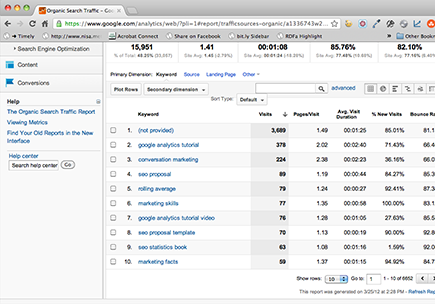
2. Click Traffic Sources in the sidebar on the left and then click Search. Then click Organic or Paid.
The Referring Keyword report that appears will usually look a lot like the referring site report. See Figure 3-5 for keyword traffic.
3. Review your keyword report for results that are consistent — and check for anything new or unusual.
Looking at this report, it’s easy to see that Google Analytics Tutorial is a top traffic generator. That’s from a series of posts a long time ago, and it still generates traffic. A quick look at search results on Google shows that the blog is No. 1 and No. 2 for the phrase.
The next few keywords aren’t surprising, except for marketing skills. That’s a tough keyword, and it’s hard to get a respectable ranking for it on any search engine.
4. To find out the referring sites for a keyword, click it in the results list. On the page that appears, choose Source from the Dimension drop-down list.
Figure 3-5: The Referring Keyword report.
The conclusions you can draw from this sleuthing are as follows:
• According to a Google search, the blog is near the top of page 1 for that phrase. That explains it.
The page views/visit and time on site aren’t bad, and this is a really tough keyword to keep a top-3 ranking. The task is to write more on the subject to aim at staying on page 1.
• One other keyword leaps out: SEO proposal template. It gets 1.28 page views per visit but a meager 19 seconds onsite. That’s awful.
The web page that keyword sends people to shows a fake proposal template, and folks are probably expecting a real proposal template. Instead, they’re getting a bit of sarcasm. The task is to write a serious proposal template that gets people to stay longer on the site.
You may have noticed that Google shows not provided for many referring organic keywords. Google claims this is privacy related. It doesn’t matter. The result is that you can’t see a huge chunk of your keyword data. If you look back at Figure 3-5, almost a third of the organic keywords end up in (not provided)! Yikes!
Luckily, you get a separate keyword query report. On the left side of the screen, click Search Engine Optimization and then click Queries. The report that appears pulls data directly from Google Webmaster Tools, as shown in Figure 3-6. If you don’t already have Google Webmaster Tools set up, see Book II, Chapter 3 for instructions.
Figure 3-6: The Queries report showing all the keyword referrers.

Getting fancy
Digging into referring site data can be exciting. If you find that the basics outlined in this minibook just aren’t enough, you might be interested in more advanced topics, such as
![]() Custom tagging and campaign management: Use these tools to track every banner, keyword ad, blog post, and anything else that sends traffic to your site on a very individual, targeted basis. Check out Web Analytics For Dummies, by Pedro Sostre and Jennifer LeClaire (published by John Wiley & Sons, Inc.), or read the documentation for your traffic-reporting toolset for more information.
Custom tagging and campaign management: Use these tools to track every banner, keyword ad, blog post, and anything else that sends traffic to your site on a very individual, targeted basis. Check out Web Analytics For Dummies, by Pedro Sostre and Jennifer LeClaire (published by John Wiley & Sons, Inc.), or read the documentation for your traffic-reporting toolset for more information.
![]() Referrer-based page customization: You can actually grab this referrer data on the fly to customize pages so that they provide the best user experience. Amazon.com uses this data as part of its product recommendations on the homepage. If that makes your brain hurt, you’re not alone. But it is a powerful feature on many sites.
Referrer-based page customization: You can actually grab this referrer data on the fly to customize pages so that they provide the best user experience. Amazon.com uses this data as part of its product recommendations on the homepage. If that makes your brain hurt, you’re not alone. But it is a powerful feature on many sites.
It’s not perfect, but it at least gives you a clear idea of what’s driving traffic. And it’s all you have.