Chapter 7: Foundational Monitoring and Logging
In this chapter, I am going to try really, really hard not to get up on my soapbox.
Really, hard…
But seriously! How can you use Google Cloud and not know how logging and monitoring work? I mean, how can you find what’s broken, know when you might be running short on capacity, or tell when something untoward has occurred if you don’t have good data? And where do you get said data? Yes, Google Cloud Logging and Cloud Monitoring.
Look, I’m old enough and comfortable enough in my own skin to know the things I’m good at and the things I’m not. Don’t ask me to draw you a picture or how to spell fungible, because drawing and spelling are definatly definitely (thank you, spell checker!) not in my skillset. But I got my first computer and started writing code in 1981, and it took me about 2 weeks to figure out that me and computers are simpático.
Figuring out what’s wrong takes information. Ensuring capacity in Google Cloud, spotting bad behavior, fixing broken stuff, and, generally, knowing what’s happening is all carried out thanks to monitoring and logging. So, without further ado, let’s get to building our logging and monitoring foundation.
In this chapter, we are going to get to know the various tools in Google Cloud’s operations suite. Then, we are going to apply them to our foundation:
- Getting to know the six core instrumentation products in Google Cloud
- Step 8 – setting up foundational Cloud Logging and Cloud Monitoring
Getting to know the six core instrumentation products in Google Cloud
In the initial stages of Google Cloud, there was App Engine, some storage offerings, and only the most basic support for logging and monitoring. As GCP grew, Google added more capabilities to Cloud Logging and Cloud Monitoring, but the available services were still lacking. So, in 2014, Google being Google bought something: Stackdriver. If you’ve been working with Google Cloud for a while, you might remember when the heading at the top of the instrumentation section in the Google Cloud menu was titled “Stackdriver,” and you will still see references to the name in examples and documentation online to this day. In 2020, Google finally decided that the name Stackdriver should go away, and so they went to work on a replacement. The interim name they came up with was “Operations.” However, while they were working on coming up with a new name with more pizazz, Covid-19 hit and the importance of getting a good name moved to the back burner.
As I sit here writing this, I wonder whether Google has just decided to stick with Operations, or whether I’m going to wake up one day soon (likely the day after this book drops) to a new group heading. Regardless, at this point, the name is Operations, and that’s the name I’m using.
When you look at the current Google Cloud Console navigation menu, the subsection related to our topic at hand looks like the following:

Figure 7.1 – The Operations suite
Inside the OPERATIONS product grouping, you will see six products. The most generally applicable instrumentation offerings are Monitoring and Logging. The other four products, Error Reporting, Debugger, Trace, and Profiler, are all designed to varying degrees to help troubleshoot misbehaving applications and to help developers.
To summarize the importance of each product, let’s take a quick operations suite tour.
Instrumentation product overview
Let’s start with the focus of this chapter, that is, the central two products in Google Cloud’s operations suite:
- Cloud Monitoring: This starts with a metric, say the CPU utilization for a Compute Engine VM. The metric reports measurements of the current CPU utilization to Cloud Monitoring based on a frequency (such as every few seconds). Then, Google aggregates those measurements using math (for example, average, sum, and more) to simplify them into time-interval buckets. In the end, you have something such as CPU Utilization avg/min. Plot the measurements on a chart, and you have the makings of a monitoring dashboard. Draw a line on your chart such that below the line is good, and above the line is bad, and you have the basis of an automated alert.
Monitoring is your central tool for getting information on how things are performing now and how they perform over time. Additionally, it will feed you the data you need for various types of troubleshooting, capacity planning, and performance evaluation, just to name a few.
- Cloud Logging: Logging is logging. Google Cloud Logging breaks logs into several major categories. Platform logs are specific to individual services, such as Cloud Run and BigQuery, and they can answer things such as When exactly did that request get processed by Cloud Run? User-written logs are logs generated by applications deployed into GCP, which use the logging API to manually print messages. Security logs, which are primarily composed of audit logs, capture information on who did what, where, and when in GCP, and they help answer questions such as Who changed this permission? Multi and hybrid cloud logs are logs ingested from on-premises, AWS, or Azure, and help you integrate external logging into your Google Cloud environment.
We are going to spend the majority of the rest of this chapter discussing logging and monitoring as they relate to building a solid GCP foundation. However, before we do, let’s do a quick tour of the four remaining instrumentation products:
- Error Reporting: One day this week, I was working through my emails when one of my monitors flashed bright red and then black. When it returned to normal, Apple Mail was no longer running. A few moments later, an error popped up on my Mac talking about how Apple Mail threw an uncaught exception of some kind or another and would I like to report the error to Apple. That’s what happens when code blows up unexpectedly on a desktop machine. But what if the same thing happened to code running in Google Cloud? How would you know?
Error Reporting builds on Cloud Logging to help spot unhandled errors and report them to you in a centralized way. You modify your code to send out a specifically formatted log entry, or you loop in the Error Reporting API, and when things go bad, Error Reporting notices, and can send you an alert. For more information on Error Reporting, please refer to https://cloud.google.com/error-reporting/docs.
- Debugger: The first thing to know about Google Cloud Debugger is that you don’t want to use Cloud Debugger. You want to do your debugging in your on-premises dev environment before you ever even get to Google Cloud. Trust me, your on-premises debugger has many more features.
The second thing to know about Cloud Debugger is that if you can’t replicate the issue in your dev environment, or if debugging on-premises doesn’t really work for this issue because it needs to be running in Google Cloud first, then that’s when you debug with Cloud Debugger. Unlike a typical debugger, Cloud Debugger doesn’t interrupt executing code, allowing you to debug in production without any negative side effects. As with a typical debugger, Cloud Debugger augments the data you have by giving you a glimpse into what’s happening inside the running code. Not only will it allow you to see the internal state when a line of code executes, such as exactly what is in that x variable when line 27 passes, but it can also help you add extra logging to the code without having to edit and redeploy it. Honestly, I’m old school, and that extra-logging-without-having-to-edit-and-redeploy thing is my favorite Cloud Debugger feature. For more information, you can start here: https://cloud.google.com/debugger/docs.
Note
At the time of writing, Google announced that Cloud Debugger was officially being deprecated and that sometime in 2023, they would be replacing it with an open source tool, so keep an eye on that.
- Trace: Trace is a latency tool. Let’s say you build a well-designed microservice-based application. A request comes into the frontend service, and the frontend hits another service, which hits another service, which hits a database, which triggers a return back to the frontend. That internal service-to-service-to-service-to-database round-trip takes 10 seconds. You decide that 10 seconds is too slow and that you’d like to shorten the latency. OK, but to do that, you’re going to need to figure out where exactly in that RPC chain the time is being spent. That’s what Cloud Trace can help with. When services make RPC calls to other services, Trace can keep track of the latencies at the call points. It’s a cool tool when you need it. For more information on Cloud Trace, please refer to https://cloud.google.com/trace/docs.
- Profiler: Yeah, I almost never use this tool. The theory is that you have an application running in Google Cloud and you want to know how it’s spending your CPU and memory. As far as it goes, it works as advertised. The problem is that its language support is limited, and in general, there are much better language-specific profilers you can use in your dev environment. The only real use case for me would be something that I couldn’t profile in my dev environment, which almost never happens.
Good. Now that you’ve met everyone, let’s take a deeper dive into monitoring and logging, and see how our foundation leverages them. Let’s start with logging.
Working with Cloud Logging
One year, two days before Christmas, I was as sick as a dog. My son and I were the only ones home as the rest of the family was visiting Mickey Mouse down in Florida. I decided to take myself into the local doc-in-the-box where a terribly young new doctor was on duty. He walked in and shook my hand, looked at my son, and said, “I’m going to wash my hands now because your dad is running a fever.”
There, that fever? It was a piece of information about the inner state of my body. The doctor used that information to start his search for exactly what was making me feel bad.
For the most part, systems running inside Google Cloud operate as black boxes. You see them, know they are there, but they tend to hide a lot of their inner workings. To a certain degree, all of Google Cloud is a black box. You might have an account, perhaps quite a large one, but that doesn’t mean Google is going to let you take a tour of a data center. We’ve all seen that movie where James Bond or someone sneaks off the tour to hack some server, right? Google isn’t having it, and since you can’t just walk over and poke at a server in the data center, you are going to have to rely on the data Google does provide to get answers.
Generally, we have two choices when it comes to instrumenting systems. First, if we have full control over all aspects of a system, perhaps because we wrote the code ourselves, there might be various ways to make the box clearer and see exactly what’s happening inside it. For systems we don’t have control over, our only choice is to rely on the telemetry being passed out of the black box into Cloud Logging and Cloud Monitoring.
Sometimes when I teach, I have a short example application that I use as a demo: https://github.com/haggman/HelloWorldNodeJs. It’s written in Node.js (JavaScript), and it’s easy to run in Google Cloud’s App Engine, Kubernetes Engine, or Cloud Run. It’s a basic Hello World-level application running as a web application. You load it up into GCP, visit its home page, and it returns Hello World!. The source code is as follows:
const express = require('express');const app = express();
const port = process.env.PORT || 8080;
const target = process.env.TARGET || 'World';
app.get('/', (req, res) => { console.log('Hello world received a request.'); res.send('Hello ${target}!');});
app.listen(port, () => { console.log('Hello world listening on port', port);});
The two lines I want to draw your attention to are the ones that start with console.log. In JavaScript/Node.js applications, console.log is a way to log a message to standard-out. That’s programming speak for the default console location. Normally, that would be the command line, but with code running on some server, it typically ends up in some log file. The second console.log line prints a message to let you know the Express web server is up and ready to work. When you visit the application’s home (/) route, the first console.log line logs a message just before the app prints Hello World! to the browser.
If I were to run the preceding application from the Google Cloud Shell terminal window, then the log messages would appear on the command line itself, since under those conditions, standard-out would be the command line. However, if I deploy the application to Cloud Run and run it there, the log messages will get redirected to Cloud Logging.
Best Practice: Log to Standard-Out
Traditionally, applications manage their own log files. You create a my-app/logs folder or something, and manually write your logs into it. In Google Cloud, that’s not a good design, even for applications designed to run on their own VMs. As a best practice, code your application so that it logs to standard-out, and then let the environment determine how best to handle the messages. If you need a little more control, for example, you want Cloud Logging to create a special log just for your application logs, then use the Cloud Logging API or a logging utility that understands how to work with Google Cloud. For example, in Node.js, I can easily use Winston or Bunyan since they both have nice integrations for Google Cloud Logging. For other examples, please refer to https://cloud.google.com/logging/docs/setup.
For demonstration purposes, I just cloned my Hello World code into Cloud Shell. I built the container and loaded it into Google Container Registry using Google Cloud Build. Yes, that’s the same Cloud Build I’m using to handle my infrastructure CI/CD pipeline. Then, I deployed the container into Cloud Run. When I visit the Cloud Run service test URL, I see my Hello World! message.
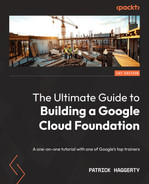
Before I discuss specific logs, let’s take a quick detour and check out Google Cloud Logging’s Logs Explorer. The Logs Explorer option can be found in the Logging section of the navigation menu. It’s Google’s central tool for viewing logs. As of the time of writing, it looks similar to the following screenshot:
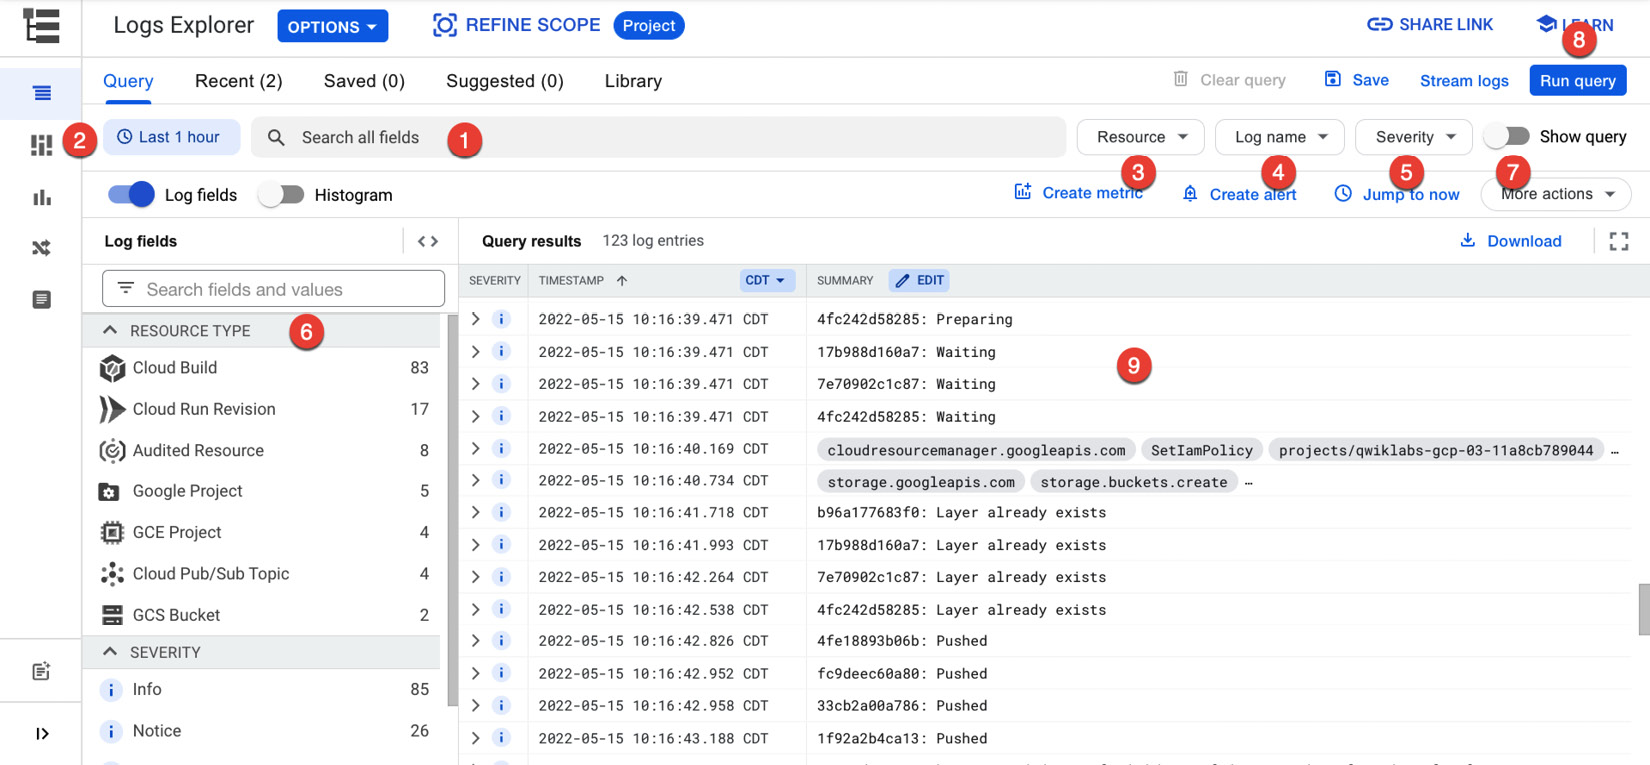
Figure 7.2 – Logs Explorer
In the Logs Explorer window, you can see the following:
- Insert something you’d like to search the logs for.
- Set a window of time for the search; the default setting is the last hour.
- If you prefer, you can search by resource type.
- Or you can search by log name.
- Or you can search by log severity.
- Even easier, you can simply apply a filter. The filters on this list are context-sensitive, in that they change depending on the log values being returned. Essentially it’s Google’s way of saying, “In the logs I’m seeing, these might be some ways you’d want to filter them.”
- If you prefer, you can display the log query and edit it directly before you run it.
- When you are ready, run the query.
- The results will be displayed here. In this case, you are looking at the middle of a set of logs coming out of the Cloud Build job that built my demo application.
Speaking of my demo application, what kinds of log messages do you think were generated when I tested it? The answer is a bunch of them.
Google breaks logs into categories. A good discussion of the available logs in Google Cloud can be found at https://cloud.google.com/logging/docs/view/available-logs. I want to focus on the main three: platform logs, user-written logs, and security logs.
First, there are the platform logs. Platform logs are generated by specific Google Cloud products. More information on platform logs can be found at https://cloud.google.com/logging/docs/api/platform-logs. In the preceding screenshot, you are seeing logs coming out of the Cloud Build job to build my application’s container. If I wanted, I could use the log fields filter (#6 in the preceding screenshot) and filter out everything but the Cloud Build logs. Instead, I’m going to use the log name filter (#4) and filter the entries to the Cloud Run platform logs. The results look like this:

Figure 7.3 – The Cloud Run logs
The bottom two entries in the preceding screenshot show my test HTTP GET request, which was successfully handled (200), along with my browser automatically asking for the page’s favicon.ico. I haven’t set this up, hence the unhappy 404-not-found response. Above those messages, you see the logs I’m generating in my code. There are two Hello world listening on port 8080 messages indicating that Cloud Run must have fired off two containers, each one indicating that it’s ready to receive traffic. Also, I can see a single message when I requested the application’s home page: Hello world received a request. Since I’m logging to standard-out in my code, Cloud Run captures these messages on my behalf and loads them into Cloud Logging.
Another log message type would be user-written logs. What I did in the preceding Hello World example isn’t technically considered user-written (pedantic much?) because I didn’t create my own log file to do it. If I had instead used the Cloud Logging API, such as in the example at https://github.com/googleapis/nodejs-logging/blob/main/samples/quickstart.js, to create a log named my-log and written to that, then it would be classified as user-written. Yes, it’s hair-splitting, but for now, let’s stick to Google’s definitions.
The last log type I’d like to mention, and arguably the most important to laying a good Google Cloud foundation, is security logs. The majority of your security logs are contained within what Google calls Audit Logs (https://cloud.google.com/logging/docs/audit). They include the following:
- Admin Activity logs: These are changes to resource configurations or metadata. Always on, always free, immutable, and stored for 400 days, this is where you look if you want to answer questions such as who added that new VM? Who changed that permission? And where did that Cloud Storage bucket come from?
- Data Access logs: Off by default for everything but BigQuery, not free, and stored, by default, for 30 days when enabled, these logs contain entries indicating user access and the change of data stored in Google Cloud. Since these logs are mostly off by default, you are going to have to decide whether you want to enable these logs for more than just BigQuery or not. More to come.
- System Event logs: These are changes made to your resources by automated Google systems. For example, if Google needs to upgrade the hardware where your VM is running and moves it seamlessly to a new box, that’s a log event in the system event logs. That example is called a live migration if you are Google Compute Engine curious.
- Policy Denied logs: These are generated when a user attempts to do something in Google Cloud but are prevented by a VPC Service Controls security policy. So, a log entry is generated when you tried to access the files you had in Cloud Storage but are denied, not because you don’t have access, but because you are attempting to access the data from your home machine, which is not within the configured service perimeter.
- Access Transparency logs: These can be enabled if you have the right type of support package. Once enabled, if you open a ticket with Google Support, and the support rep needs to access some of your data or systems while troubleshooting, then these logs will be generated. In addition, you can enable access approval, and the support rep will have to check with you for approval before touching your resources.
Note
This log will not generate entries if Google happens to touch something of yours while troubleshooting a lower-level problem. So, if Cloud Storage is broken for multiple clients, and they look at your files while troubleshooting, there will be no log entry.
To see an example of a security log at work, let’s look at the admin activity log. In this example, I’ve gone into Logs Explorer and used the log name filter to restrict to the Cloud Audit | Activity log. Additionally, I’ve used the log fields filter to only show the Cloud Run Revision entries. So, I’m asking Logs Explorer to just show me the Cloud Run-related admin activity log entries. The results are displayed as follows:

Figure 7.4 – The Cloud Run admin activity logs
The two entries are where I first created the service for my Hello World demo application, and where I set its permissions to allow for anonymous access. Nice.
Before I wrap up the discussion of logging, for now, I’d like to talk a little about log exports.
Configuring log entry destinations
By default, all your logging information is collected at the project level and stored in log storage buckets. The flow of the logs resembles the following diagram:

Figure 7.5 – Routing logs
So, the steps logged messages run through are similar to the following:
- Log entries are generated, and they enter through the Cloud Logging API.
- If a logs-based metric has been created, then matching entries are tallied and reported as measurements to Cloud Monitoring.
- All log entries are then passed to each configured log sink. The sinks then identify the entries they are interested in and forward them to a specific destination.
The log sinks might be configured with exclusion and inclusion rules. The exclusions are processed first, ignoring any log entries matching a pattern. Then, the inclusion filter decides which of the remaining log entries should be captured and replicated into the configured destination.
Log entries can be routed into the current project or a remote one, where they will be stored in one of the following resources:
- Log buckets: These are specialized Cloud Storage buckets designed to store logging entries. This is the only sink destination that is queried by Logs Explorer in Google Cloud Console.
- BigQuery datasets: Exporting log entries to BigQuery allows finer-grained queries from a wider audience of data analysts.
- Cloud Storage: This is, typically, used for inexpensive long-term storage, possibly with retention and/or auto-delete life cycle rules.
- Pub/Sub: This is a good option when you need to route entries for secondary processing using some sort of code. The code could be custom created or it could be a third-party log management tool such as Splunk.
The two initial log storage buckets are _Default and _Required. _Required is a non-configurable storage bucket fed by a non-configurable log sink. The admin activity, system event, and access transparency (if enabled) logs are routed here and stored for 400 days. These are your core security audit logs, so when you are trying to figure out how that resource got removed or who modified that permission, you can find the details here.
The _Default log bucket and corresponding sink capture all the other log entries and store them for 30 days. Both are configurable.
Note: Not All Logs Are Enabled by Default
One of the key decisions you will need to make when configuring your logging foundation is which optional logs to enable. Generally, more information is better when you are trying to troubleshoot something. Having said that, logs, as with most things in Google Cloud, can cost extra. As such, you will need to give some serious thought to the logs you have enabled all the time, and those that you only enable when troubleshooting. We’ll go into more detail on that soon.
Now that we’ve had a taste of Google Cloud Logging, let’s head over and see what Cloud Monitoring has to offer. Then, we can get to laying that foundation.
Monitoring your resources
Have you ever read Google’s books on building reliable systems? If not, head over to https://sre.google/books/ and take a look. At the time of writing, Google has three Sight Reliability Engineering (SRE)-related books, all of which you can read, in full, from the preceding link.
In Google’s original SRE book, they have a diagram that resembles the following:
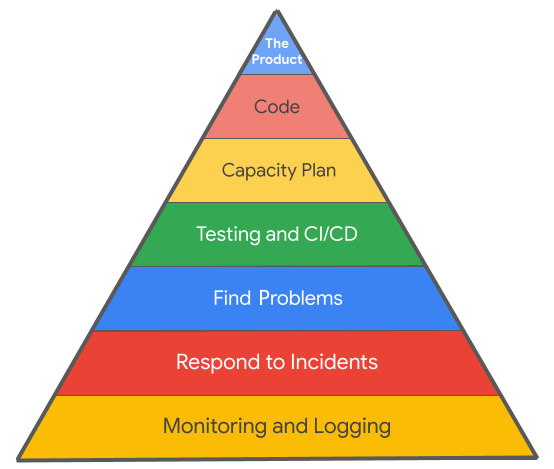
Figure 7.6 – The SRE pyramid
At the top of the pyramid is the application you are building, the product. To get the product, first, we must do the work and write the code. However, if our application is going to work well, then we need a capacity plan, and we need to follow good testing and CI/CD release procedures. At some point, something is going to happen, and we are going to need to be able to find and fix problems in response to a formalized incident response. All of that will depend on us having good information, and that information will come from monitoring and logging.
We’ve discussed logging, so how does monitoring fit in?
Monitoring helps us to understand how well our application is doing. Do you remember my story about being sick and missing Disney World? When the doctor takes a measurement of your temperature, that’s a form of monitoring.
Have you ever heard of the four golden signals? In the same original SRE text that I mentioned earlier, Google lays out what they call the four golden signals. The gist is KISS. When you start monitoring, begin with the four most commonly important pieces of performance information, and then expand from there.
The four golden signals are listed as follows:
- Latency: How long does it take the application to get an answer back to the caller? Latency is frequently one of your non-functional requirements.
- Traffic: How much load is on the system? Typically, this is measured as requests per second, queries per second, bits per second, and the like.
- Errors: How many errors are being generated in a particular window of time?
- Saturation: The least obvious of the golden four, this is a measure of fullness. Something in your system will have a maximum capacity or load that it can handle. If your database supports 8,000 QPS, and your current load is 6,000 QPS (a traffic measure), then you are sitting at 3/4s saturation.
The four golden signals might be conceptually obvious, but how do you collect the data you need for each? Ah, that’s where monitoring comes in.
To monitor products in Google Cloud, my advice is for you to work your way through the following three steps until you find what you’re looking for:
- Check the Google Cloud resource you want to monitor and see whether it has any built-in monitoring. If it does, and most Google Cloud products will, Google is offering you an opinionated view of important things to pay attention to. Many times, you won’t have to go beyond this step.
- Check to see whether Google has created a dashboard for what you want to monitor in Monitoring | Dashboards. If so, then this is another place where Google is attempting to show you what to pay attention to.
- If neither of the preceding steps provides you with the information you want, then use Monitoring | Metrics Explorer. To use it, first, you need to spend some time in the documentation (start at https://cloud.google.com/monitoring/api/metrics) researching Google’s available metrics.
Let’s run through the monitoring checklist one at a time using my Hello World application. In the folder containing my app, there’s a sub-folder that has a Python load generator that can run out of a Kubernetes cluster. I’ve spun up a GKE cluster and deployed the load generator into it. I have it configured to throw 30 RPS of load onto my Hello World application, which I’ve deployed to Cloud Run.
So, if I wanted to monitor an application running in Cloud Run, the first option says that I should start by checking to see whether Cloud Run has any monitoring. And yes, it does! Here, you can see a screenshot of the METRICS tab of the Cloud Run page for my application:

Figure 7.7 – Monitoring Cloud Run
Look at all that nice data. There’s a RPS count, which shows that I’m pretty close to my 30 RPS target. There are request latencies for the 50th, 95th, and 99th centiles, which shows me that 99% of all the requests are getting an answer back in under 12 ms. The container instance count shows that there were several containers for a while, but Google has figured out that the 30 RPS load can be handled by a single active container, and that’s all that’s running now. On the second row, I see billable container instance time because Cloud Run bills for every 100 ms of execution time. Then, there’s container CPU and memory utilization. In Cloud Run, you can configure the CPU and memory resources provided to a running container, and the setting I’m running under now, 1 CPU and 512 MiB memory, looks to be more than enough. As of the time of writing, Google has just previewed partial CPU Cloud Run capabilities, and if I could drop the CPU my service specifies, I could likely save money.
See? Monitoring.
Not bad. Usually, with Cloud Run, I don’t need to look any further. If I did, I’d find that option 2’s pre-created dashboards, Monitoring | Dashboards, don’t give me anything for Cloud Run. However, there is a nice dashboard for GKE, so you might want to check that out at some point.
Moving on to option 3, Metrics Explorer, requires some prep work. Metrics Explorer has a lot of options on exactly how it can display a selected metric (https://cloud.google.com/monitoring/charts/metrics-explorer), so make sure you spend some time learning the interface. Before you can even start though, you need to do a bit of homework to figure out the specific metric that you’d like to examine.
Researching metrics starts at https://cloud.google.com/monitoring/api/metrics. For my example, I’m going to follow the link to Google Cloud metrics, and then scroll down to the Cloud Run section. At the top of this section is the base metric name. In this case, it’s run.googleapis.com/, so all the Cloud Run metric’s technical full names will start with that.
Next, scroll through the metrics until you find the one you need. For our example, let’s go with the following:

Figure 7.8 – Cloud Run metric
So, this is a metric that will show the amount of data downloaded from your Cloud Run application, with several details. Specifically, it shows the following:
- The technical and human-readable versions of the metric name.
- This shows the metric’s type. In this case it’s a whole number (INT64) representing the number of bytes (By) of data. DELTA tells us that the metric is measuring change (as opposed to a gauge metric, which would show you an amount, like the gas gauge in a car).
- A metric description, including how frequently the metric is sampled or measured.
- Information on how long it takes after a measurement is taken before the new value shows in Metrics Explorer.
- Any available labels, or ways to group/filter the metric.
Heading over to Metrics Explorer and searching for the metric using either the technical or human-readable name (double-check the full technical name to ensure you’re using the right metric) will allow you to see the visualization. In this case, it would look similar to the following:
Figure 7.9 – Sent bytes
Nice. So, it’s an easy view displaying the amount of data being downloaded by your application. With a little research, Metrics Explorer can be a powerful tool, but again, using options one or two first will generally save you time.
Now that you understand how monitoring works for many of the core Google Cloud resources, let’s take a moment to discuss the VMs running Google Compute Engine.
Monitoring agents and Google Compute Engine
Imagine you have a VM running in Google Compute Engine. From Google’s perspective, your VM is probably one of several running on the same physical server in a Google Cloud compute zone. Google can see your VM as it runs and tell how much CPU you are using, how big your disk is, and how much data you’re sending across the network because all of that is happening at the physical server level. What Google can’t do, by default, is see what’s happening inside of your VM. Google can’t see the logs being generated by that application you have running, or how much of the disk and memory is being used by said application.
For that, you need to get an inside view of the VM’s black box. The traditional option would be to log into the VM using RDP or SSH and look at the logs and metrics from the OS. That’s fine, and not only will it work in GCP, but it also won’t add anything to your Google Cloud bill. The problem is that the VM is likely a very small part of what you are doing in Google Cloud. Since the VM isn’t pushing its logs out to Cloud Logging, you can’t really go to a single place and see the VM logs side by side with what’s happening in that GCP data storage service that your VM is accessing. To make that work, you need to open a window into the VM that Google can see through. That window is created by Google’s Ops Agent: https://cloud.google.com/stackdriver/docs/solutions/agents/ops-agent.
The Google VM Ops Agent can be installed in a number of ways, including manually via SSH, from the Observability tab in the VM’s details page in Compute Engine, using the VM Instances dashboard, or you can create an Agent Policy (https://cloud.google.com/stackdriver/docs/solutions/agents/ops-agent/managing-agent-policiesz) and automate the Ops Agent installation across entire sections of your organizational resource hierarchy. Honestly, the best practice is to install the Ops Agent into the VM image itself, and then use nothing but custom images in production. If you need a little help to get that working, take a look at HashiCorp Packer.
The Ops Agent is configured using YAML and can stream system logs, application logs, and resource utilization metrics out of the VM and into Google Cloud Logging and Monitoring. Nice.
Now, before we move on to laying our logging and monitoring foundation, let’s talk a little about how metric scopes work.
Metric scopes
If you visit the Monitoring | Overview page in Cloud Console for one of your projects, in the upper-left corner you’ll see a Metrics Scope link, similar to the one shown in the following screenshot:

Figure 7.10 – Link to Metrics Scope
Opening your Metrics Scope link will display a page resembling the following:
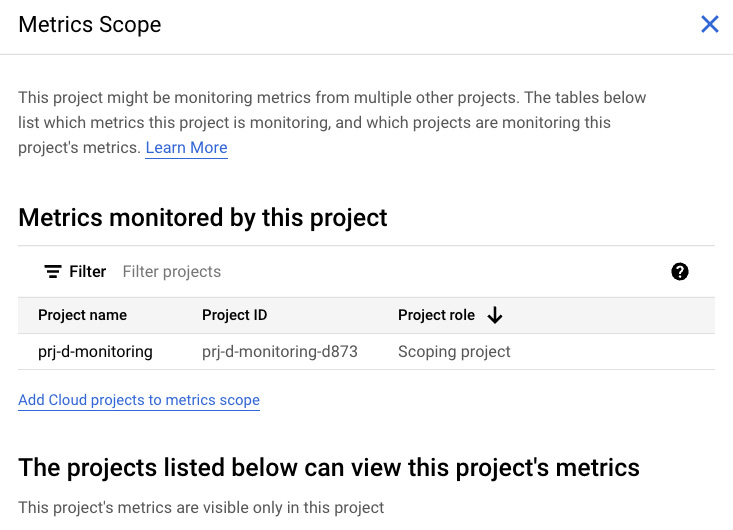
Figure 7.11 – Current Metrics Scope
A metrics scope is a group of one to many projects that can be monitored from the currently viewed project. Let’s imagine you have a microservice-based application with services spread out over five different projects. Since the different projects are different parts of the same application, sometimes, you just want to go into project 3 and monitor the resources you have there. That’s the default, and each project comes preconfigured with a metric scope containing itself. So, if you want to monitor project 3’s resources, then just go to project 3 and do so.
But metric scopes could be edited, and you can add other projects to what’s monitorable from here. So, in my five-project microservice story, you could create a project 6 specifically to help monitor the application as a whole. You add projects 1–5 into the metrics scope for project 6, and now you can use project 6 to monitor resources across the entire application.
Perfect. So, we’ve seen how logging works and how monitoring can help. Now, let’s put them together and get them into our foundation.
Step 8 – setting up foundational Cloud Logging and Cloud Monitoring
Every resource you use in Google Cloud will impact how and what you collect in terms of logging and monitoring information. At this point, our goal is to get a few logging and monitoring fundamentals in place as part of our foundation, and then we can extend that foundation as needed. You will need to decide which of the following recommendations makes sense in your environment, and then adapt them as needed.
Let’s start with logging.
Logging foundation
Let’s make this clear. Logging is good because it contains information needed to spot security issues, troubleshoot applications, and more, but logging also costs money. I’d love to simply say that you should enable every type of log you can, but the reality is that the cost would likely outweigh the possible benefits. The following recommendations try to balance information needs and cost. Regardless of whether you go with my recommendations or not, make sure that you spend some time in your billing reports, so you know exactly how much you are spending as it relates to logging and monitoring. Do not get surprised by instrumentation spending.
Here is my list of logging baseline recommendations:
- Admin Activity logs: They are already on and free, so you’re good.
- Access Transparency logs: If your support package includes Access Transparency logs, then turn them on. We’ll talk more about support packages in Chapter 8, Augmenting Security and Registering for Support.
- Ops Agent: Install this in all of your VMs, but monitor and set budgets on the related costs. Depending on what you’re running on the VMs, these logs can get big. Generally, I think they are worth the cost, but remember that you can configure both the Ops Agent and Cloud Logging sink exclusions to filter down the entries if so desired.
- VPC Flow Logs: Sample network packets as they move across the VPC. They are off by default, and I’d leave them off unless you are actively troubleshooting a VPC network connection problem.
- Firewall Rules Logs: They contain each admitted decision and rejected decision made by your firewalls. They are another set of off-by-default logs that can get really big, really fast. I’d leave them off unless you are troubleshooting firewalls.
- HTTPS Load Balancer logs: They are on by default. I recommend leaving them on, but you might want to exclude most (exclusions can be percentage-based) of the successful requests and log any HTTP errors.
- Cloud Identity logs: Check the Cloud Identity configuration options as there is a way to share its logs with Google Cloud. Enable it so that you can see all of the related changes and authentication attempts inside Google Cloud.
- Cloud Billing: We’ve already discussed exporting these logs to BigQuery for better analysis, so we should be good here.
- Data Access logs: They are off by default for everything but BigQuery. These logs contain any access or change to data made by one of your users, and they can be selectively enabled resource by resource and project by project. Turning them on can generate a lot of logs, but they will also allow you to answer questions such as Who modified that file in Cloud Storage? But did I say they could get big?
Here, you are going to have to do some planning. If you like the idea of data access logs, then you can enable them for all projects, but you need to spot-check how much you are paying. Typically, this is where I start, by enabling them across the entire organization.
If my data access logs are getting too big and expensive, then one possible cost-savings measure is to enable data access logs for production projects across the entire production organizational folder, but disable them in dev and non-production. If you need to troubleshoot something in dev, you can enable them temporarily. Perhaps enable them for selected resources rather than all resources. Additionally, you can use log exclusions to support enabling data access logs, but then only sample the log entries.
For some of the preceding optional logs, enabling them with Terraform will be part of setting up that particular resource. Firewall logs will be enabled in the Terraform resource for creating the firewall, and the VPC Flow Logs will be enabled when creating a subnet. If you’d like to install the Ops Agent in your VMs, you can do that when configuring the VM itself, or you might look at Google’s blueprint resource to create Ops Agent policies at https://github.com/terraform-google-modules/terraform-google-cloud-operations/tree/master/modules/agent-policy.
Of course, for the data access logs, the easiest way to enable them is using Terraform. Enable them for the org using google_organization_iam_audit_config and/or for folders using google_folder_iam_audit_config resources. For example, to enable data access logs for all the services within a folder, you could use the following:
resource "google_folder_iam_audit_config" "config" { folder = "folders/{folder_id}"service = "allServices"
dynamic "audit_log_config" {for_each = ["DATA_WRITE", "DATA_READ", "ADMIN_READ"]
content {log_type = audit_log_config.key
}
}}
If you are using Google’s example foundation scripts that I used in earlier chapters, then you can enable the data access logs in the 1-org step by setting the data_access_logs_enabled variable to true. To see how the script works, examine the envs/shared/iam.tf file.
Once you’ve made some decisions regarding the logs to enable, give some thought to log aggregation.
Aggregating logs
Log aggregation gives you the ability to export logs from multiple projects into a single searchable location. Usually, this will either be a BigQuery dataset or a Cloud Storage bucket. BigQuery is easier to query, but Cloud Storage could be less expensive if you are storing the logs long-term for possible auditability reasons. I prefer BigQuery with a partitioned storage table. I mean, what’s the use of copying all the logs to a single location if you aren’t going to be searching through them from time to time? Partitioning the table will make date-filtered queries faster, and the storage will be less expensive for partitions that are 90 days old or older.
For log aggregation, first, create a centralized project where you can store the logs. If you are using the Google example org Terraform scripts, then the project created for this is in the fldr-common folder and is named prj-c-logging.
Log aggregation can be configured with the gcloud logging sinks command or by using Terraform. Google has a log export module that you can find at https://github.com/terraform-google-modules/terraform-google-log-export. It provides facilities to create a BigQuery, Cloud Storage, or Pub/Sub destination, which is then used to sink the specified logs. Once again, if you are using the example foundation scripts, log sinks are created and configured in the 1-org step. To see how the script works, examine the envs/shared/log_sinks.tf file.
With the key decisions made on how to store logs, let’s talk a bit about monitoring.
Foundational monitoring
On the monitoring end, exactly what you need to view will be a project-by-project decision. In other words, if you need to monitor a particular service that you’ve created, do that in the service’s host project. Foundationally speaking, it might be a nice idea to create a central project within each environmental folder for when you need a single pane of glass. So, in the dev folder, create a project with the metrics scope configured that can see all the other projects in the dev environment. When you need to monitor some services in dev-project-1 and dev-project-2 from a single location, this project will be set up for that.
If you are using the example foundations scripts from Google, the central monitoring project is created in the 2-environments step of the modules/env_baseline/monitoring.tf script. Essentially, it’s just a project created using Google’s project factory blueprint with a name such as prj-d-monitoring. However, the script doesn’t actually configure the metrics scope. You can either configure that manually using the UI or via the monitoring API. In the UI you would do the following:
- Sign in to the central monitoring project for the desired environment.
- Navigate to Monitoring | Overview | Metrics Scope.
- Identify all the projects you’d like to add, and then click on Add Cloud projects to metrics scope.
There’s also a (currently beta) Terraform resource that you can use: google_monitoring_monitored_project.
Note: A Metrics Scope Can Contain No More Than 375 Linked Projects
So, if you have more than 375 projects in your dev/non-prod/prod environment folders, then you would need to create multiple “single-pane-of-glass” monitoring projects. Perhaps you have 1,000 different service projects, but they make up 25 major application types. In that case, perhaps you will create 25 different monitoring projects, one per major application type.
Excellent! With an idea of the things that should be in your monitoring foundation, let’s take a moment to point out a few other considerations.
Food for thought
I could seriously write a book on logging and monitoring in Google Cloud. In this chapter, I’ve tried to focus on the things that should be part of most Google Cloud foundations, without getting into all the variations you’ll need to implement depending on exactly what you are doing in Google Cloud. Now, let’s talk about some stuff you should at least consider.
Security Information and Event Management (SIEM) tools are third-party tools designed to help you scan your logs for untoward activities. Splunk, Elasticsearch, Sumo Logic, ArcSight, and QRadar, just to name a few, could all be configured to connect to Cloud Logging using Pub/Sub. Then, they can analyze what’s happening in your logs and spot naughty people trying to do naughty things. Additionally, Google now has Chronicle, which can scan logs alongside information coming out of Security Command Center for various threats.
Homegrown log analysis could be constructed in a few different ways. You could centrally aggregate your key logs into a Pub/Sub topic, read the topic with Apache Beam running in Dataflow, and then dump your logs into BigQuery for longer-term storage. Then, the Dataflow/Beam code could scan the log entries for anything you liked and alert you of findings in near real time. It would require custom coding, but you could grow the solution how and where you need it. I guess it all depends on whether you’re part of a build-it or buy-it sort of organization.
Another way you could do homegrown log analysis would be using BigQuery. Use Cloud Scheduler to run a job in Cloud Run or to call a cloud function once every 15 minutes. The function code executes a query in BigQuery looking for events since the last run. You could scan for admin activity log entries, logins using high-privilege accounts, IAM permission changes, log setting changes, permissions changes on important resources, and the like. If anything is found, send out a notification.
If your issues are hybrid-cloud related, and you are attempting to integrate systems running outside GCP into Cloud Logging and Monitoring, then check out Blue Medora BindPlane. It supports integration with Azure and AWS, along with on-premises VMware, and various application and database types.
Last but not least, please give some thought to how you are going to build reliable systems in Google Cloud. Read those Google SRE books I mentioned earlier (https://sre.google/books/) so that you can put the SRE teams in place, have good plans for your formalized incident response, and understand more about how to build your SLOs.
Cool beans. And with that, it’s time to wrap up our foundational monitoring and logging discussion and move on to our final two Google Cloud foundation steps.
Summary
In this chapter, we continued to build our secure and extensible foundation in Google Cloud by completing step 8, where we implemented key parts of our logging and monitoring foundations. We overviewed the tools that Google has for us to help with instrumentation, and then we focused on logging and monitoring. We explored how Google ingests and routes logs, and we looked at the various log types. Then, we moved on to monitoring and saw the various ways Google helps us monitor the services we have running inside of Google Cloud. Lastly, we discussed the additional elements our foundation needed as it relates to logging and monitoring.
Great going, y’all! Keep on hanging in there, and we are going to get this foundation built.
If you want to keep on moving through Google’s 10-step checklist with me, your personal tutor, by your side, flip the page to the next chapter where we are going to discuss our final two foundational steps: security and support.