
Chapter Three
Step III: Business & Financial Due Diligence
Time to take a deeper dive on your best ideas
It's now time to perform detailed business and financial due diligence. Many of the diligence items outlined below were researched at a high level in Step II. You gained initial comfort to justify additional work. Now, you are set to take a much deeper dive.
For business diligence, you are trying to figure out the quality of the company's operating model. Is it a sustainable business with a strong moat? Alternatively, has it been struggling but you see a path to redemption? Much of this analysis is qualitative, requiring sound judgment and insight. Experience and familiarity with specific business models and sectors is particularly helpful. We will help you develop the skills to quickly dissect a business.
For financial diligence, you must examine the company's core financial statements to determine where it has been and where it is going. A large portion of this analysis is making observations about key financial items and seeking defensible answers. Why are sales going up or down? Why are margins expanding or contracting? Getting answers to the “why's” is critical.
Your overall diligence should go beyond simply identifying companies with high-quality fundamentals. Embrace the flexibility and creativity needed to unearth less obvious opportunities, including underperformers with potential for substantial improvement. The latter requires high conviction gained through deep and thorough research.
But don't get overwhelmed by the due diligence process—we have created a concise framework to guide your work. Our framework takes the form of two five-question checklists, one for business diligence and one for financial. These checklists will help you organize and track your diligence process. Once completed, you will be in good shape to move forward or reject the given opportunity.
Business Due Diligence
Business due diligence centers on determining whether a company is high-quality, or can become high-quality. Beyond understanding the core business, you need to focus on its competitive position and place in the value chain. How resilient is the business model and can you gain comfort on key risks? Paramount here is whether the business solves an important problem and has long-term staying power. This deeper analysis builds on the foundation laid in Step II.
Our framework in Exhibit 3.1 is designed to help you assess whether a business is worth putting money behind. Your ability to obtain satisfactory answers to the five key questions below is critical. If the answers to these questions leave you uncomfortable, then the stock is probably not right for your portfolio. However, with each stock analyzed, you learn and improve your investment acumen.
EXHIBIT 3.1 Business Due Diligence Checklist
Business Due Diligence Checklist
- What does the company do?
- How does it make money?
- What is its moat & competitive position?
- How strong are customer & supplier relationships?
- What are key risks to the business?
I. What does the company do?
To paraphrase some of the world's top investors, unless you can quickly describe what a company does in plain English, then the stock is probably not for you. Peter Lynch famously explained: “The simpler it is, the better I like it.”
While highly complex businesses may present opportunity, they often present increased risk. There are typically more potential unknowns and uncertainties to consider, and more things can go wrong. Common sense dictates that if you don't understand a business, then you shouldn't invest in it. On the other hand, as your skill set expands, your comfort level with complexity will expand alongside. Sizable reward may await those who solve what perplexes others.
Study as much company- and sector-specific material as possible to learn the in-depth “story.” Per Step II, key sources include the Annual Report, SEC filings, investor presentations, and sell-side research reports. In Step III, next level research involves combing through prior earnings releases, call transcripts, and industry journals. You should also read the company's letter to shareholders in its Annual Report, which can be revealing in terms of corporate culture and identity. Ideally, sample the product and ask around for other people's opinions. Pros talk to industry experts and executives for insight.
Beyond the basic business model, you seek insights into why the company is worth backing. Is it a secular grower, with demand for its products and services accelerating? Is it gaining market share? Are there meaningful growth or profitability initiatives in place?
Returning to Delphi, initial work in Step II revealed key information about the business, but far from enough to fully appreciate the opportunity. We know that the company manufactures critical components for OEMs, such as General Motors, Ford, and Volkswagen. And we know that their products enable customers to meet increasing driver safety requirements, tighter fuel economy and emission standards, and evolving consumer preferences. Now, in Step III, we explore the core product offering in more detail as well as the staying power of the secular drivers.
As highlighted in the investment write-up in Exhibit 2.2, Delphi was structured around four primary business units, each providing products for distinct vehicle solutions:
- Electrical/Electronic Architecture (40% of sales) – provides complete design of a vehicle's electrical architecture, including connectors, wiring assemblies & harnesses, electrical centers, and hybrid power distribution systems
- Powertrain Systems (30% of sales) – integrates engine management systems including fuel handling & injection, combustion, and electronic controls
- Electronics & Safety (19% of sales) – provides critical components, systems, and software for passenger safety & security, infotainment, and vehicle operation, including body controls, reception & navigation systems, and displays
- Thermal Systems (11% of sales) – provides heating, ventilation & air conditioning (HVAC) systems, such as compressors, condensers, radiators, and cooling/heat exchangers
For each of its core business units, Delphi was committed to superior quality and delivery, competitive pricing, and flawless new product launches. It was also positioning its portfolio at the forefront of secular mega-trends tied to “Safe, Green and Connected.” Over time, new product options related to these themes were poised to become standardized features, resulting in penetration gains.
- Safe – technologies intended to proactively reduce the risk of a crash occurring, as well as passenger protection in the event of a crash
- Examples: lane departure warning systems, blind spot detection, and collision avoidance
- Green – technologies designed to help reduce emissions, increase fuel economy, and minimize the environmental impact of vehicles
- Examples: products supporting hybrid and electric vehicles, as well as those that improve fuel economy and emissions, e.g., fuel injection systems
- Connected – technology content focused on increasing personalization, entertainment, and convenience while driving
- Examples: integrated mobile voice & data, embedded global positioning systems (GPS), and infotainment
It should be noted that many early potential investors were skeptical of Delphi's ability to transform itself into a technology leader given its legacy. But, management and the Board were highly focused on aligning with consumer demand and regulatory tailwinds. This positioned Delphi to realize above-market growth for years to come.
II. How does it make money?
So you know what the company does. But, how does it make money? Profits are a function of sales and costs. There are four ways for a company to increase profits: increase volume, raise price, lower variable unit costs, and reduce fixed overhead.1 The first two relate to sales, the last two relate to costs.
For most companies, two or three key business drivers truly impact performance. These are highlighted in earnings releases and investor presentations, and closely tracked by the research and investor communities. Gauging business performance and outlook relies upon understanding key dynamics for these drivers.
Sales growth drivers for both volume and price vary by sector. For a cable company, this means number of subscribers times monthly average revenue per user (ARPU). Subscriber count relies upon penetration of products such as video and high speed internet, while ARPU is driven by product pricing and bundling. For homebuilders, the sales growth formula is based on number of homes sold times average sales price (ASP). Home volumes and prices rely upon the strength of the housing market, which feeds from employment, wages, consumer confidence, demographic trends, lending standards, and interest rates. Ideally, you want to be aligned with secular or cyclical tailwinds that drive growth.
Cost is a function of how much expense is related to producing each unit, as well as corporate overhead. For variable costs per unit, companies seek to improve their materials purchasing/mix, labor efficiency, manufacturing processes, and technology. For fixed overhead, companies strive to control corporate expenses such as salaries, administrative, and rent.
Auto suppliers make more money as the OEMs produce more vehicles, including backlog build. Beyond volumes, Delphi's sales growth was driven by increased content per vehicle and product mix. Therefore, we scrutinized key trends in technology, environmental and safety standards, and innovations.
For pricing, auto suppliers are generally subject to price-downs, which are contracted annual selling price reductions to the OEMs. Some of Delphi's peers were subject to price-downs of 3% to 4%. For Delphi, we assumed a more modest 2% drag on annual sales growth supported by its recent track record and “critical-needs” products.
Monthly auto sales volumes are widely reported in terms of SAAR (seasonally adjusted annual rate). Given Delphi's diversified geographic exposure, regional SAAR analysis was needed for Europe, North America, Asia Pacific, and South America. As shown in Exhibit 3.2, the global auto sales recovery was in full swing by 2011. Emerging market volumes, particularly in China (captured in Asia Pacific), were expected to grow by nearly 50% over the next five years. This was highly beneficial for Delphi given its strong Chinese presence.
EXHIBIT 3.2 Global Light Vehicle Volumes
(units in millions)
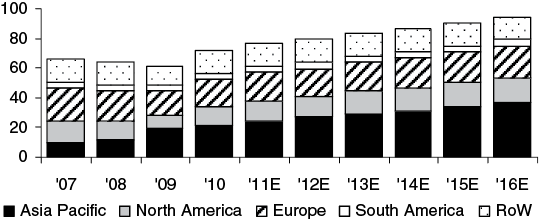
Source: IHS Automotive and Barclays Capital
Delphi's growing backlog and design wins on new platforms further supported these trends. The company was strategically investing in next-generation technologies to drive long-term growth, as demonstrated by its healthy projected capex spend (see Exhibit 3.11). OEM trends towards supplier base consolidation and global car platforms also positioned preferred partners like Delphi for market share gains.
On the content side, tightening fuel economy (see Exhibit 3.3) and safety standards were driving higher content per vehicle. This was further augmented by demand for increased connectivity, electronics, infotainment, and active safety systems exemplified by the increasing trends towards telematics (see Exhibit 3.4).
EXHIBIT 3.3 Fuel Economy Standards by Geography
(miles per gallon)
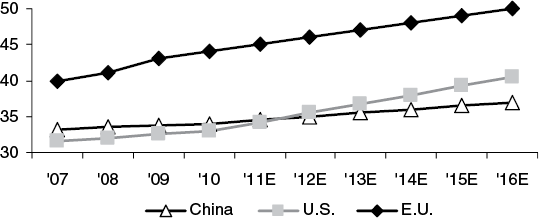
Source: International Council on Clean Transportation (ICCT)
EXHIBIT 3.4 Installation Rates of Embedded Telematics
(% of production volume)
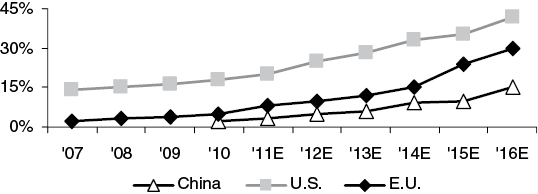
Source: IHS Automotive
On the profitability side, Delphi's margin opportunity appeared just as compelling as its growth story. The company was becoming increasingly disciplined in its bidding for new business, which created a higher-quality backlog and product mix for Delphi. Our analysis suggested that the company was positioned to realize several hundred basis points (bps)2 of margin improvement in the coming years due to:
- Product mix shift – focus on higher-margin products tied to electrification, connectivity, and safety
- BCCs – ongoing migration of manufacturing base to best-cost regions, over 90% at time of IPO
- Flexible workforce – ability to “flex” to market conditions, 70% variable cost structure and no UAW (United Automobile Workers union)
- Lean savings – deep-seated continuous improvement culture driven by management and the Board, resulting in one of the “leanest” cost structures in the sector
- Pricing – emphasis on premium pricing, which was supported by disciplined bidding, product quality, and stickiness
- Operating leverage – ability to leverage fixed cost base across increasing volumes
- Emerging markets – penetration of high-margin products combined with leverage over OEMs
III. What is its moat & competitive position?
Quality businesses tend to have sustainable competitive advantages over their peers and high barriers to entry. This is commonly referred to as a “moat.” Differentiated products, intellectual property, scale, brand, sticky customer relationships, low-cost structure, and high upfront capital investment all support the resilience of a business model.
Industries with fewer competitors and high barriers to entry have greater prospects for outperformance. Companies that face fierce competition risk lower growth, profitability, and diminishing returns. This is especially true when participants engage in irrational behavior to gain market share. Also, be mindful that industries currently generating high returns on capital may attract new entrants. So, even top-performing companies can never get complacent.
Fortunately for Delphi, its moat was well-defined. Key barriers included:
- Low-cost structure – arguably the leanest cost structure in the industry with an average hourly wage of $7, resulting from its BCC-heavy footprint, local sourcing, and no UAW exposure
- Market leadership & global scale – holds top or secondary market position for most of its core products; operates 110 manufacturing facilities in 30 countries; 16,000+ scientists, engineers, and technicians focused on R&D
- Spec'd-in products – direct collaboration with OEMs to develop innovative and tailored solutions with differentiated technology; Delphi products are designed into new vehicle platforms years before launch date, resulting in sizable backlog and high switching costs; products found in vast majority of top-selling models globally
- Customer relationships – decades-long collaboration with major OEMs; 15 strategically located technical centers dedicated to product development, complemented by on-site design and engineering teams at customer locations
- China – market leader in China with long-standing presence dating back to 1992 serving both domestic and foreign OEMs; expects roughly 50% of future growth to be generated from emerging markets
From a competitive perspective, Delphi contended with multiple global players in each segment, as disclosed in the S-1 (see Exhibit 3.5).
EXHIBIT 3.5 Competitors by Segment
| Segment | Competitors |
Electrical/Electronic Architecture |
Leoni, Molex, TE Connectivity, Sumitomo, Yazaki |
Powertrain Systems |
BorgWarner, Bosch, Continental, Denso, Hitachi, Magneti Marelli |
Electronics & Safety |
Aisin, Autoliv, Bosch, Continental, Denso, Harman, Panasonic |
Thermal Systems |
Denso, MAHLE Behr, Sanden, Valeo, Visteon |
Delphi's competitive advantages varied by segment. For Electrical/Electronic Architecture, the company was an innovator in optimizing product weight and cost. In Powertrain, its technological know-how and R&D enabled it to go toe-to-toe with the likes of German-engineering heavyweights Bosch and Conti. And, in Electronics & Safety, Delphi was a leader in active safety, infotainment, and user experience systems.
IV. How strong are customer & supplier relationships?
To understand a business, you must study its position in the value chain. In other words, how powerful is its standing vis-à-vis customers and suppliers? This analysis centers on concentration, tenure, negotiating power, and other relationship dynamics.
Customers
A company's fortunes are directly tied to those of its customers. When concentration is high, customer disruption or a major contract loss can be disastrous. Furthermore, a company's ability to negotiate favorable terms may be limited vs. one whose customer base is fragmented. A public company often discloses its top customers and concentration under a “Business” or “Customers” section in the 10-K.
High concentration requires in-depth customer diligence. This work is similar to that for the actual investment opportunity. Follow key customers' performance trends, outlook, and financial health.
Customer due diligence also involves the length of the relationships. In general, the longer the better as evidence of stickiness and durability. While a single customer representing 20% of sales may raise eyebrows, you get more comfortable if the relationship has been in place for decades. You also want to look at specific relationship dynamics. For example, if product switching costs are high or the customer has few alternatives, you gain confidence in the stickiness factor.
Per Delphi's S-1, its top 10 customers comprised over 65% of total sales with the top 3 customers representing 38% (see Exhibit 3.6).
EXHIBIT 3.6 Delphi Customer List
| Customer | % of Sales |
| General Motors (GM) | 21% |
| Ford Motor Company | 9% |
| Volkswagen Group | 8% |
| Daimler AG | 6% |
| PSA Peugeot Citroën | 5% |
| Renault SA | 4% |
| Shanghai GM | 4% |
| Fiat Group | 3% |
| Hyundai Kia Automotive | 3% |
| Toyota Motor Corporation | 3% |
While not too alarming, this level of concentration required scrutiny. Fortunately, Delphi's relationships with its top customers went back decades. The track record was time-tested. For the most part, its key customers also had strong credit profiles, with most rated investment grade.
Perhaps most reassuring, Delphi pledged increased customer diversification to IPO investors in late 2011. Management stated that no customer would account for more than 15% of sales going forward. Delphi's buyback of GM's $4.3 billion equity stake earlier in the year gave further comfort to IPO investors that their largest customer's influence would lessen over time.
Delphi also laid out a geographic diversification plan whereby it would target a 30% / 30% / 30% / 10% regional balance for North America / Europe / Asia-Pacific / South America. This compared to a 33% / 43% / 16% / 8% mix at the IPO.
Suppliers
As with heavy reliance on a few customers, you need to be mindful of supplier concentration. Large suppliers tend to have substantial leverage over their customers, which heightens the risk of aggressive behavior. This is especially true for hard-to-get materials or sole-source situations. In general, investors need to be mindful when the supplier-provided inputs or services comprise a significant portion of the company's cost of goods sold (COGS).3
Some companies specifically list their key suppliers in the 10-K or prospectus, while others note their exposure to certain raw materials. Common raw materials include metals (e.g., aluminum, copper, steel) and petroleum products (e.g., oil, gas, resins). A company that relies on one or two suppliers is susceptible to their material shortages and operational disruptions.
While Delphi doesn't explicitly list its supplier and raw material exposure in its S-1, it does note that:
“We procure our raw materials from a variety of suppliers around the world. Generally, we seek to obtain materials in the region in which our products are manufactured in order to minimize transportation and other costs. The most significant raw materials we use to manufacture our products include aluminum, copper and resins.”
Like Delphi's customer concentration, this heavy commodity exposure merited scrutiny. Fortunately, its list of global suppliers was deep and diverse. The company's global footprint also enabled it to source locally, as appropriate. We saw the larger risk as related to underlying commodity price volatility and Delphi's ability to pass through spikes. As we discuss later, however, Delphi was effective at mitigating this exposure through pass-through contracts and hedging.
V. What are the primary risks to the business?
Operational Risks
You must constantly be on the look-out for risks to your thesis. We have already touched on many of the operational risks facing companies, namely cyclical exposure, competitive pressures, customer/supplier issues, and escalating input costs. To those, we need to add currency movements, technological obsolescence, and financial leverage.
As noted in Delphi's S-1, its operational risks include:
- Production Volume – “Automotive sales and production are highly cyclical. Lower global auto sales result in our OEM customers lowering production, which has a direct impact on our cash flows. The most recent example of this was the 2009 downturn in which North American and Western Europe auto production declined 43% and 26%, respectively, below levels in 2007.”
- Competition – “We operate in the highly competitive automotive supply industry. Competition is based primarily on price, technology, quality, delivery and overall customer service.” Competition is a reality in every industry. Even for those industries with a benign competitive environment today, tomorrow may bring new unforeseen entrants.
- Customers – “Declines in the market share or business of our five largest customers may have a disproportionate adverse impact on our revenues and profitability.” Concentration exposes a company to problems at key customers, including operational issues or financial struggles.
- Suppliers – “Any significant disruption in our supplier relationships, particularly relationships with sole-source suppliers, could harm our profitability.” As with customers, supplier concentration represents heightened vulnerability to third parties.
- Input Costs – “In recent periods there have been significant fluctuations in the global prices of copper, aluminum and petroleum-based resin products, and fuel charges, which have had an unfavorable impact on our business.” Adverse swings in key raw material prices can meaningfully impact financial results. Delphi used a combination of hedging and contractual pass-through agreements with customers to help mitigate this risk.
- Currency – “Currency exposures may impact future cash flows. ~65% of our 2010 revenue was invoiced in currencies other than the U.S. dollar … [most notably] the Mexican Peso, Euro, Chinese Yuan, Turkish Lira and Great British Pound.” While Delphi's reported USD sales and earnings were impacted by FX, its margins were typically protected given its strategy of matching sales and costs in the same currency.
- Emerging Technologies – “We may not be able to respond quickly enough to changes in regulations and technological risks, and to develop our intellectual property into commercially viable products.” All businesses must live with the threat of substitute technologies that alter the value proposition of existing products and services.
- Leverage/Liquidity – “A prolonged economic downturn or economic uncertainty could adversely affect our business and cause us to require additional sources of financing, which may not be available.” Companies need to manage their balance sheets and liquidity to create sufficient cushion for downturns. This typically comes in the form of revolver capacity, cash on hand, and a prudent debt load and maturity schedule.4
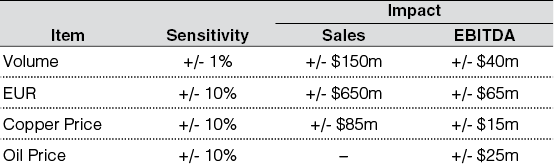
Once you identify the key risks, you seek to quantify them to inform your investment decision. In Exhibit 3.7, we show Delphi's sensitivities to moves in production volumes and EUR/USD exchange rates, as well as copper and oil prices. For each percentage move in the underlying risk factor, we show the corresponding impact on sales and EBITDA.
EXHIBIT 3.7 Risk Sensitivity Analysis
Non-operational Risks
You must also identify non-business-related risks to your thesis. These may be regulatory, geopolitical, environmental, or legal. Often, these risks are more difficult to foresee than the operational ones. That does not, however, let you off the hook.
Non-operational risks are particularly relevant for companies in certain industries and geographies. For Delphi, the auto supply industry has a well-documented history of product recall and environmental regulatory issues. In addition, its sizable operations in China carry emerging markets and country-specific geopolitical risk.
As disclosed in Delphi's S-1, its non-operational risks include:
- Regulatory – “We may not be able to respond quickly enough to changes in regulations.” Unanticipated changes in regulations, rules, or laws always loom as a potential threat.
- Geopolitical – “We face risks associated with doing business in non-U.S. jurisdictions…Our business in China is…sensitive to economic and market conditions.” Substantive operations in “high-risk” countries represent a key concern as they increase susceptibility to domestic unrest, regime changes, business climate uncertainties, sanctions, and even tariffs.
- Environmental – “We may be adversely affected by…environmental regulation, litigation or other liabilities.” Environmental risks are typically specific to the industry. For example, asbestos-related lawsuits resulted in multi-billion dollar penalties and some notable bankruptcies in the industrials sector from the 1980s through the early 2000s.
- Legal – “We may incur material losses and costs as a result of warranty claims, product recalls, product liability and intellectual property infringement actions.” Investors must live with the reality of legal risk for all their holdings. In autos, product failures and recalls are particularly relevant.
Existential Risks
Existential threats endanger a company's very existence. Emerging disruptive technologies constantly threaten age-old business models. As part of your diligence, you need to gain comfort that the company is well-positioned to withstand technological change. This same analysis can also be used to identify short ideas.
Ideally the company is at the forefront of innovation and itself a disruptor. This is how the New Delphi positioned itself. The company's vision and courage to embrace automobile electrification and connectivity early on set up Delphi for success in the coming decade.
In the retail sector, the demise of both Blockbuster Video and Borders Group are high-profile examples of companies that were upended by disruptive technologies. Blockbuster, the video rental retailer, generated sales of $6 billion and EBITDA of $500 million in 2004. By 2010, however, its sales and EBITDA had declined to $3.25 billion and −$20 million, respectively. What happened? Did people lose interest in watching movies at home? Of course not. A new method for delivering movies to viewers' living rooms emerged, but Blockbuster failed to evolve.
The primary disruptor was Netflix, which first offered DVD-by-mail rentals and then adapted to offer online video streaming. Over the same 2004 to 2010 timeframe, Netflix's sales of $500 million and EBITDA of $25 million increased to $2.2 billion and $325 million, respectively. Blockbuster ultimately filed for bankruptcy in September 2010 while NFLX saw its share price rise from a split-adjusted $1 at its 2002 IPO to $25 by the end of 2010. By year-end 2019, its share price was $324.
Borders, the book and music retailer, experienced a similar fate at the hands of e-commerce juggernaut Amazon.com. In 2005, Borders generated sales of nearly $4 billion and EBITDA of $300 million, which fell to $2.2 billion and −$200 million, respectively, by 2010.
Why? Did people lose interest in reading books? On the contrary, book sales soared but Amazon reaped the rewards. Borders failed to adapt its business model and ultimately filed for bankruptcy in January 2012. Meanwhile, AMZN saw its share price rise from a split-adjusted $2 at its 1997 IPO to over $250 by the end of 2012. By year-end 2019, its share price was $1,848.
Financial Due Diligence
Financial due diligence centers on the analysis and interpretation of a company's historical and projected financial performance. It goes hand in hand with business due diligence. Both are necessary and neither alone is sufficient.
While some math skills are required, the good news is that the basics suffice—addition, subtraction, multiplication, and division. It also helps to be able to navigate your way through the three primary financial statements—income statement, balance sheet, and cash flow statement. The ability to use Microsoft Excel is highly beneficial, if not a prerequisite.
Given the basic math, the easy part is performing the actual calculations. The hard part comes afterwards in the interpretation of the data. What is driving the company's performance? Why is the company out/underperforming its peers? Is it sustainable? How will competitors react? What will performance look like over the next one, two, five, or even ten years. Ultimately, your analysis seeks to provide comfort on future performance, which of course is never certain.
As with business diligence, we provide a five-question checklist for performing financial due diligence (see Exhibit 3.8).
EXHIBIT 3.8 Financial Due Diligence Checklist
Financial Due Diligence Checklist
- Where has the company been?
- Where is it going?
- Is the balance sheet healthy?
- Does it generate strong free cash flow?
- How does management allocate capital?
I. Where has the company been?
First, you need to focus on the company's historical performance. How and why did it experience growing, flat, or declining sales and profitability? Typically, a three-to-five-year historical period is sufficient to form conclusions, especially if it spans prior cycles. Make sure the numbers are “clean,” i.e., properly adjusted for one-time items and any M&A. You also need to compare these trends against peers and understand the differences.
We noted earlier that your diligence needs to have the flexibility to uncover turnarounds and fixer-uppers. Having recently emerged from bankruptcy, Delphi clearly fell into this bucket. Its Chapter 11 filing in 2005 was the product of an uncompetitive cost structure, excess debt, and burdensome pension liabilities. At the time, Delphi had negative EBITDA and liabilities totaling approximately $22 billion. The company was bleeding cash with no clear path to covering its ongoing interest, pension, and operating expenses.
As a side note, only Delphi's U.S. assets were subject to the Chapter 11 filing. While the U.S. turnaround story grabbed most of the headlines, the European restructuring project was no less impressive. Delphi transformed its European business into an earnings machine with double-digit margins that were previously unheard of. This was driven by a best-cost manufacturing base in Northern Africa and Eastern Europe, an hourly workforce comprised of 30% temps, and the successful sourcing of engineering talent from BCCs, such as Poland.
During its multi-year bankruptcy, Delphi dramatically reduced its product lines from 119 down to 33. No less important, the company chose to focus on areas where it was best positioned to win, exiting 11 businesses, including the Steering and Passive Safety segments. By summer 2009, Delphi's lead shareholders negotiated an agreement with GM to take back its remaining U.S. unionized plants.
The resulting New Delphi featured a clean balance sheet, right-sized cost structure, and streamlined product portfolio. From a purely financial point of view, bankruptcy also enabled Delphi to lower its corporate tax rate to 20%. Lower taxes meant higher conversion of operating income to EPS and FCF. This provided a clear advantage vs. U.S. peers who were subject to higher rates.
As shown in Exhibit 3.9, after a dramatic downturn from 2007 through 2009, the company's fortunes started to improve. In 2010, sales increased 17.5% and were on pace for similar growth in 2011. What drove this massive sales increase? Fortunately, helpful color was provided in the MD&A5 of Delphi's 2011 S-1:
“Our improved sales reflect the impacts of increased OEM production as well as the level of our content per unit. These improvements continue to indicate a stabilization of the global economy. However, volumes in North America and Western Europe continue to be substantially less than [those] prior to 2008 and 2009.”
Now let's look at Delphi's profitability, which followed a parallel path. Gross margins improved dramatically from a 2009 low of 1.9% to 15.7% in 2011E. Net income went from −$866 million to +$1.1 billion. And, the company started generating substantial FCF. Per the MD&A:
“In 2010, we largely completed our restructuring activities, resulting in a lower fixed cost base, improved manufacturing footprint and reduced overhead. We dramatically reduced our U.S. and Western European footprints, realigned our SG&A cost structure and increased the variable nature of our employee base.”
Delphi's newly flexible labor force and operating leverage were critical profit drivers. Further, the company was benefiting from an improved commodity price environment. But was this success sustainable?
EXHIBIT 3.9 Delphi Five-Year Historical Financial Summary – Income Statement and Free Cash Flow

II. Where is it going?
Now that you know where the company has been, it's time to figure out where it is going. Try to visualize what the company will look like over the next one, two, five, or even ten years. Growth expectations are critical for valuation. Equity investors tend to reward faster-growing companies with higher trading multiples than slower-growing peers. They also focus on organic vs. acquisition-driven growth, with the former generally viewed more favorably.
Growth refers to sales and earnings. Investors look for both. Sales growth without earnings growth raises obvious cost questions. Similarly, earnings growth without sales growth raises questions about sustainability. There's only so much cost to squeeze out of the lemon.
The company's growth outlook needs to be reflected in the financial model, typically five years of projections. The goal is to project the highest probability outcome. Inevitably there will be deviations. But, if the core assumptions are well-researched and vetted, the chances for dispersion narrow.
While the future is inherently uncertain, you need to look for clues. Start with the most recent earnings call transcripts, MD&A, and investor presentations. Many companies also provide guidance in the form of a range. Your view on management capability and credibility will inform your interpretation. Sell-side research and consensus estimates offer further perspective, particularly from the most well-regarded analysts.
Regardless of where guidance or consensus falls, you need to do your own work. In some cases, “consensus” masks a wide disparity between the individual analyst estimates that comprise it. Therefore, it is essential to develop an understanding of the company's key financial drivers and model accordingly.
To craft financial projections, start by revisiting the work you did in the prior section. Focus on historical growth rates for sales, EBITDA, and EPS, as well as margin trends. Only then can you start to look forward. Will growth continue at the same trajectory, accelerate, or decelerate?
As previously discussed, often two or three key variables drive financial performance and hence the projections. Recall that Delphi's sales are largely a function of global production volumes by region, backlog, and price. Therefore, annual sales projections are typically based on forward-looking third-party production data, new business/backlog growth, and price-downs.
For profitability projections, investors focus on gross profit, EBITDA, and net income. Gross profit, defined as sales less COGS, is the profit earned after subtracting costs directly related to the production of products and services. COGS are largely variable and correlated to the volume of goods or services sold. Gross margin is calculated as gross profit as a percentage of sales.
A detailed modeling approach for gross profit projects COGS based on price and volume for key expense inputs. Delphi's key COGS primarily include materials and labor with additional costs relating to manufacturing overhead and freight. A “quick and dirty” approach, on the other hand, assumes gross margin as a % of sales based on recent trends, independent research, or management guidance.
The same holds true for modeling EBITDA and EBIT, which are net of COGS and SG&A (selling, general & administrative expenses), a.k.a., corporate overhead. The detailed approach projects SG&A as a separate line item and subtracts it from gross profit to calculate EBIT.6 You then add back D&A expense to solve for EBITDA. D&A is often projected as a percentage of sales based on historical levels.
SG&A expense is largely fixed and often modeled by growing it at GDP or an “inflation-plus” rate. Or, SG&A can be modeled as a percentage of sales in line with recent trends. For either approach, be mindful of major cost-cutting or expansion initiatives, which can significantly impact this line item.
For net income, you need to factor in interest expense and taxes. To the extent these expenses are dynamic, it is prudent to model them separately rather than relying on high level margin assumptions. This is particularly important for levered companies that are repaying debt and hence lowering their interest expense going forward. It is also applicable for companies that are raising debt to repurchase shares or fund growth.
For per share metrics, most notably EPS and FCF/S, you divide the numerators—net income and free cash flow, respectively—by diluted shares. For the denominator, keep in mind potential stock buybacks, issuances, or other corporate actions that could impact the future share count.
Exhibit 3.10 displays our specific model assumptions for Delphi. They reference historical performance as well as production outlook by geography, backlog estimates, and standard pricing reductions. Per Exhibit 3.11, these assumptions resulted in sales growing at a 6%+ CAGR over the next five years. Gross margins surpassed 17.5% by the end of the projection period, while EBITDA margins reached 14.5%.
Further, we modeled EPS and FCF/S growing meaningfully faster than revenue and EBITDA due to a reduced share count from stock buybacks. Our buyback assumptions started at $250 million in Year 1 and scaled to $750 million by Year 5.
EXHIBIT 3.10 Summary Model Assumptions

EXHIBIT 3.11 Delphi Five-Year Projected Financial Summary – Income Statement and Free Cash Flow

III. Is the balance sheet healthy?
A strong balance sheet is essential for a healthy business. It provides flexibility for growing operations, both organically and through M&A, as well as for capital returns. It also provides a buffer during difficult times. Conversely, a weak balance sheet constrains growth, limits access to external capital, and reduces the margin for error.
To understand a company's balance sheet, you need to explore its capital structure and key credit statistics. Capital structure refers to the amount, components, and terms of a company's debt and equity. The more debt, the greater the risk. As witnessed during the run-up to the Great Recession, many sophisticated investors underestimated the perils of a stretched balance sheet.
Capital structure affects both financial and operational performance. Higher leverage means higher interest expense, which negatively impacts earnings and cash flow. A challenged capital structure may also mean less funds for operations. On a more extreme level, it leads to liquidity problems and potentially bankruptcy.
In the event of bankruptcy, equity investors suffer severe impairment or total loss as they occupy the most junior position in the capital structure. Unlike lenders, shareholders have neither guaranteed interest payments nor contractual principal repayment at a set maturity date. As noted in Step II, equity investors tend to prefer lower leverage and higher coverage.
Equity investors also need to be cognizant of when a company's debt comes due, i.e., the debt maturity schedule. Upon maturity, debt obligations must be refinanced with fresh capital from the market or retired with cash on hand. If not, then the company will be in default. The inability to refinance or repay debt may be due to poor financial performance or weak capital markets, or both. Regardless, the result is often bankruptcy.
From a balance sheet perspective, Delphi emerged from bankruptcy with a significantly improved credit profile. At the time of the IPO, leverage was reduced to 1x and the company's $1.45 billion cash balance meant that leverage was only 0.3x on a net basis. A new $1.3 billion undrawn revolver also bolstered the company's liquidity profile. Further, the company had no significant debt maturities over the next five years.
This positioned Delphi for strong organic and inorganic growth. Its balance sheet capacity could be used for R&D/capital projects, M&A, buybacks, and dividends. Going forward, we modeled Delphi's credit profile continuing to improve through EBITDA growth and mandatory debt repayment (see Exhibit 3.12).
EXHIBIT 3.12 Delphi Five-Year Projected Financial Summary – Balance Sheet Summary

Leverage, of course, is not all bad. Used properly, it can be a powerful value driver. Debt is inherently cheaper than equity and is often the optimal way to fund growth … up to a point. Therefore, be sure to analyze balance sheet capacity when evaluating an opportunity.
Additional debt can be used to repurchase shares or fund M&A, thereby increasing EPS. For a company with 1.5x leverage vs. peers at 2.5x, you can model in 1x incremental leverage to fund a buyback or make an acquisition. Then, assess pro forma EPS for each scenario. This analysis helps identify potential catalysts. For Delphi, at only 1x total leverage post-IPO, we saw potential for buybacks beyond what we modeled, as well as future M&A.
IV. Does it generate strong free cash flow?
Free cash flow is the lifeblood of a company. It is the cash generated after paying all cash expenses—COGS, SG&A, interest, and associated taxes—as well as the funding of capex and working capital. As such, it denotes a company's ability to invest in growth, return capital to shareholders, or repay debt. For many investors, P/FCF or FCF yield is the primary valuation basis on which they invest.
Investors analyze the percentage of EBITDA or net income that gets converted into cash flow. You may see a company report that FCF exceeded net income, a powerful signal. Ideally, this is due to low capex requirements or working capital efficiency. However, be on the look-out for FCF that is inflated due to one-time items, underinvestment, or temporary tax benefits. Similarly, a company with strong earnings but consistently weak FCF may portend trouble ahead.
FCF generation is driven by multiple factors, with profitability being foremost among them. Margins for gross profit, EBITDA, and EBIT show a company's operating profitability. Net income goes one step further, netting out financial charges such as interest expense and taxes. However, even a high margin business can have a poor FCF profile if its capital intensity is too high. Capital intensity refers to cash spending needs for maintenance and growth initiatives, most notably capex and working capital.
Capex are the funds that a company uses to purchase, improve, expand, or replace PP&E. Historical levels help guide projections for future capex. Note that these projections may deviate from historical levels depending on the company's strategy or phase of operations. A company in expansion mode might have elevated capex for some portion of the projection period. Fortunately, planned capex is typically discussed in the 10-K or on earnings calls.
It is also important to differentiate between expenditures deemed necessary to continue operating the business (“maintenance capex”) and those that are discretionary (“growth capex”). Companies typically get the benefit of the doubt that growth capex can be curtailed in difficult times. For Delphi, we modeled capex increasing from just under 4% in 2011 to 4.5% of sales throughout the projection period given planned investments in new product launches (see Exhibit 3.12).
Net working capital (NWC) is the cash needed to fund a company's operations on an ongoing basis. It is the sum of the cash tied up in credit sales and inventory (“current assets”) minus the cash owed to vendors (“current liabilities”). As a general rule, heavy NWC requirements are looked upon unfavorably. Capital tied up in accounts receivable and inventory means less cash available to the company and its shareholders.
Investors look at a variety of metrics to measure NWC efficiency. Perhaps the simplest is NWC as a percentage of sales. Year-over-year trends are particularly telling. A notable increase in NWC as a % of sales may be a warning sign. Meaningful NWC efficiency improvements, on the other hand, bolster a company's FCF profile. For Delphi, we assumed NWC at a relatively flat 3.7% to 3.8% of sales throughout the projection period.
Given the above, in conjunction with its accelerating volumes and increased profitability, Delphi's FCF generation outlook was strong. Per Exhibit 3.11, we modeled Delphi's FCF to accelerate meaningfully during the projection period.
V. How does management allocate capital?
Effective capital allocation is a key differentiator for best-in-class companies. Disciplined management teams continuously assess the relative returns on their allocation of capital. In other words, what is the highest return for each dollar spent? The most prevalent ways to deploy cash include:
- Organic growth projects
- Mergers & acquisitions
- Share repurchases
- Dividends
- Debt repayment
Skeptical that capital allocation is a core value driver? Well, consider the following. For both Blockbuster and Borders, imagine a world where they decided early on to allocate capital to digital or online solutions vs. increasing their storefronts. Perhaps they would still be alive today.
Companies typically look first to allocate capital to internal opportunities. Organic growth projects are viewed as lower risk. These initiatives may come in the form of new facilities, locations, machinery, R&D, product introductions, or technology platforms.
Companies may also look externally at M&A opportunities as the best use of cash. Strategic fit and price paid are obviously critical here, as is the acquirer's track record. Does the company have a strong history of executing accretive deals and delivering on announced synergies? Are the potential targets strategic and value-enhancing?
Other capital allocation strategies focus on direct return of capital, most notably stock buybacks and dividends. Here, track record is also important. For prior buybacks, analyze how much stock the company repurchased and at what prices. For companies announcing first-time buybacks, your analysis should center on balance sheet capacity and pro forma EPS.
A company's dividend strategy requires similar analytics. Does the company pay regular dividends or large one-time payments as cash accumulates? For how long has the company paid a dividend and has it been increasing? What is the current dividend yield? Is the dividend a meaningful portion of net income, as reflected in its payout ratio? A company with a 50% payout ratio and consistent 3% to 4% yield is more likely to get investors' attention.
Debt repayment can also enhance shareholder returns. This is especially true for a quality company with a heavy debt load but a clear path to deleveraging. Sponsor-backed IPOs (former LBOs that have gone public) and highly cyclical companies merit attention in this respect. Accelerated debt repayment via FCF results in lower interest expense and hence higher EPS. Furthermore, deleveraging may re-rate the company with a higher multiple as it de-risks the equity and creates capacity for growth.
For Delphi, we modeled FCF funding buybacks in the absence of M&A. This was a notable upgrade from the Old Delphi, which had a long-standing reputation among equity investors as an unfocused and inefficient allocator of capital. Silver Point and Elliott, in conjunction with the Board and post-emergence management team, made strong capital allocation at New Delphi a priority. Investors that were paying attention could have deduced this from the new Directors' backgrounds and their strong alignment with the value-oriented shareholder base.
As a result, we assumed annual buybacks scaling from $250 million to $750 million throughout the projection period. Assuming 25% annual share price appreciation, diluted shares decline from 328 million in 2011 to 284 million by 2016E. This led to a roughly 15% EPS growth CAGR and 19% for FCF/S over the 5-year projection period (see Exhibit 3.11).
Key Takeaways
- Understand what the company does and how it makes money
- Focus on the two or three core drivers of the company's business
- Business due diligence seeks to verify a company's competitive position and the resilience of its business model, a.k.a. its “moat”
- Differentiated products, intellectual property, scale, brand, customer relationships, pricing power, and high upfront capital investment all support a company's moat
- Financial due diligence explores historical performance, primarily as a prologue for the future—visualize what the company will look like over the next one, two, five, or even ten years
- Equity investors ignore balance sheet and capital structure at their own peril
- Efficient capital allocation is a key differentiator for best-in-class companies
- The most prevalent ways to deploy capital include: organic growth projects, M&A, buybacks, dividends, and debt paydown
Notes
- 1 Variable costs change depending on the volume of goods produced and include items such as materials, direct labor, transportation, and utilities. Fixed costs remain more or less constant regardless of volume and include items such as lease expense, advertising and marketing, insurance, corporate overhead, and administrative salaries.
- 2 A basis point represents 1/100th of a percentage point.
- 3 COGS are the direct expenses associated with producing the products and services provided by the company. Typical COGS include materials, labor, distribution, and manufacturing costs.
- 4 Companies should seek to have a balanced debt maturity schedule that is spaced out over several years vs. all coming due at the same time (see later in this chapter, Financial Due Diligence: III. Is the balance sheet healthy?).
- 5 Management's Discussion and Analysis. Mandatory SEC filing disclosure that provides an overview of the prior reporting period's financial performance, and typically trends and outlook.
- 6 The EBIT calculation assumes that D&A expense is included in COGS and, to a lesser extent, SG&A.