CHAPTER 3
The CDS Basis I: The Relationship Between Cash and Synthetic Credit Markets
Anyone composing a history of banking would observe that the use of interest-rate derivatives increased liquidity in the world's financial markets. Such instruments made it easier for users and providers of capital to price and hedge cash market debt capital products. Interest-rate swaps are now a leading indicator of the financial markets and a tool by which cash market efficiency is maintained. We can observe a similar happening in credit markets. Credit derivatives were introduced around 1994–1995, although liquid markets did not develop until a few years after that. They are now an important part of the global capital markets, and have contributed to increased liquidity in the cash credit market. They also enable market participants to price credit as an explicit asset class.
The growth of the credit derivatives market has produced a highly liquid market in credit default swaps across the credit curve. This liquidity in turn has helped to generate further growth in the market. There is a wide range of users of credit default swaps, from banks and other financial institutions to corporate and supranational bodies. The liquid nature of the credit default swap market has resulted in many investors accessing synthetic, rather than cash, markets in corporate credit. As well as greater liquidity, the synthetic market also offers investors the opportunity to access any part of the credit term structure, and not just those parts of the term structure where corporate borrowers have issued bonds. The liquidity of the synthetic market has resulted in many investors accessing both the credit derivatives and the cash bond markets to meet their investment requirements.
Because the synthetic market in credit is a reliable indicator of the cash market in credit, it is important for all market participants to be familiar with the two-way relationship between the two markets. The relationship is represented by the credit default swap basis: a measure of the difference in price and value between the cash and synthetic credit markets. This chapter is a review of the basis, and an assessment of the relationship between the two markets.
This chapter considers the close relationship between the synthetic and cash markets in credit. This relationship manifests itself most clearly in the shape of the credit default swap basis. We look at why the synthetic market price will differ necessarily from the cash market price. We then consider the factors that drive the basis, before looking at the implications this has for market participants.
The Market Differential
For a large number of corporate—and certain sovereign—names, the liquidity of the credit derivative market frequently exceeds that available for the same reference names in the cash market.1 It is this feature that has enabled fund managers to exploit their expertise in credit trading by originating synthetic collateralized debt obligation (CDO) vehicles that enable them to arbitrage between cash and synthetic markets; for instance, see Fabozzi and Goodman (2001) and Choudhry (2002). As well as greater liquidity, the synthetic market also offers investors the opportunity to access any part of the credit term structure, and not just those parts of the term structure where corporate borrowers have issued paper. The liquidity of the synthetic market has resulted in many investors accessing both the credit derivatives and the cash bond markets to meet their investment requirements.
In the previous chapter, we described the asset-swap approach to valuing credit default swap (CDS) contracts, which was used at the start of the market. We illustrated the no-arbitrage argument that indicated why this should be the case. In practice, the CDS spread will differ from the asset-swap (ASW) spread, and this has important implications for market participants in both cash and synthetic credit markets. Middle-office desks and risk managers that use the asset-swap technique to independently value default swap books are at risk of obtaining values that differ from those in the market. This is an important issue for credit derivative market-making banks.
There are a number of reasons why the cash market spread differs from the same reference asset credit default swap premium. This is noted, for instance, in Choudhry (2001) and Bomfim (2002). The latter illustrates the divergence of ASW and CDS spreads using financial entity and industrial entity reference names. The divergence is greatest with the industrial names considered in Bomfim's article.
The Credit Default Swap Basis
Although the theoretical case can be made as to why the CDS price should be equal to the ASW price, market observation tells us that this is not the case. This difference in pricing between the cash and synthetic markets was noted in the previous section, and results from the impact of a combination of factors. In essence, it is because credit derivatives isolate and trade credit as their sole asset, separately from any funding consideration, that they are priced at a different level than the asset swap on the same reference asset. There are other important factors, however, that must be considered, which we consider shortly.
FIGURE 3.1 Selected reference name credit default swap and asset-swap spreads, May 2003

The difference between the CDS and the ASW price is known as the basis. The basis is given by
Where D – S > 0, we have a positive basis. A positive basis occurs when the credit derivative trades higher than the asset-swap price, and is common. Where D – S < 0, we have a negative basis. This describes where the credit derivative trades tighter than the cash bond asset-swap spread.2
FIGURE 3.1 shows the basis for a sample of reference credits during May 2003. We use mid-prices for 5-year CDS and ASW for each name. The sample reflects the customary market state, with a positive basis for all but one of the names.
We illustrate further the different trading levels by looking at two issuer names in the Euromarkets, Telefonica and Fiat. FIGURE 3.2 shows the yield spread levels for a selection of U.S. dollar bonds and Eurobonds issued by Telefonica, as of November 2002. We note that the credit default swap price is at levels comparable with the cheapest bond in the group, the 7.35% 2005 bond, issued in U.S. dollars.
A similar picture emerges when looking at a group of Fiat bonds, also from November 2002, as shown in FIGURE 3.3. Note that the credit curve given by the credit default swap prices inverts. This is because a year earlier, Fiat had issued a very large size “exchangeable” bond that had a July 2004 put date. The basis, previously flat, widened to over 100 basis points due to market makers hedging this bond with convertible bonds of the same name.
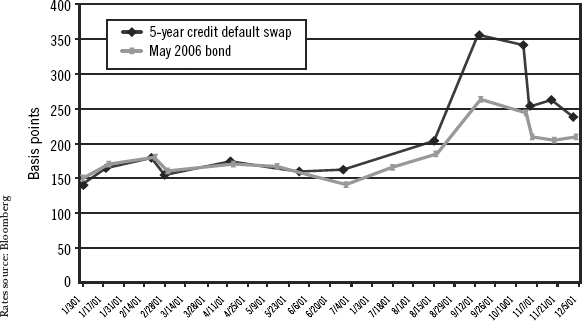
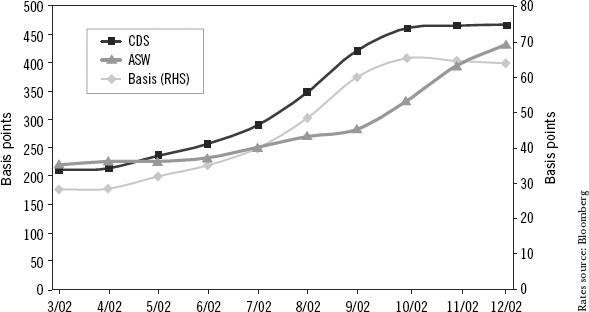
The basis will fluctuate in line with market sentiment on the particular credit. For instance, for a worsening credit, the basis can become positive quite quickly. This is illustrated in FIGURE 3.4, which shows the widening in spread between the 5-year credit default swap levels with the similar-maturity May 2006 bond of the same name (in this case, British Airways PLC). The impact of the deteriorating business outlook in the last quarter of 2001 is prevalent, with the improving situation also illustrated toward the end of the year.
FIGURE 3.2 Telefonica bond asset-swap and credit default swap spread levels, November 2002
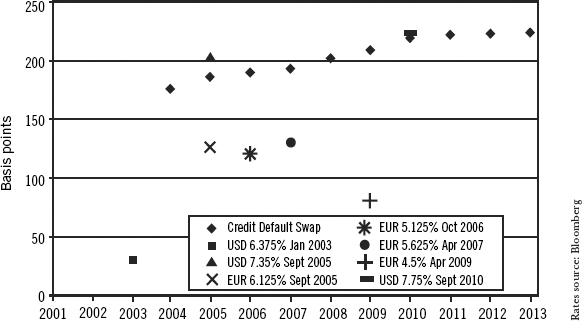
FIGURE 3.3 Fiat bond asset-swap and credit default swap spread levels, November 2002
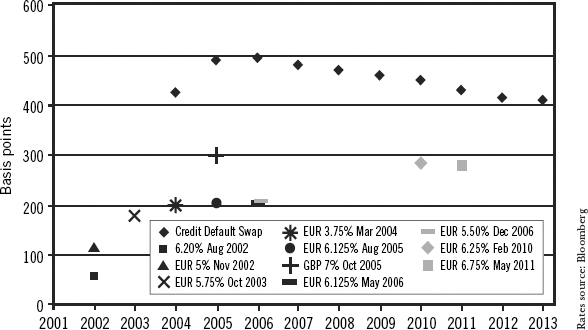
FIGURE 3.4 British Airways PLC, credit default swap versus bond spread levels.
Factors Behind the Basis
The basis arises from a combination of factors, which we may group into:
- Technical factors
- Market factors
Technical factors, which are also referred to in the market variously as fundamental or contractual factors, are issues related to the definition or specification of the reference asset and of the CDS contract. Market factors, which are also referred to as trading factors, relate to issues connected with the state of the market in which contracts and reference assets are traded. Each factor exerts an influence on the basis, forcing it wider or tighter; the actual market basis at any one time will reflect the impact of all these factors together. We consider them in detail next.
Technical Factors
Technical factors that will influence the size and direction of the basis include the following:
CDS premiums are above zero: the price of a CDS represents the premium paid by the protection buyer to the protection seller—in effect an insurance premium. As such, it is always positive. Certain bonds rated AAA (such as U.S. agency securities, World Bank bonds, or German Pfandbriefe) frequently trade below Libor in the asset-swap market; this reflects the market view of credit risk associated with these names as being very low and also better than bank quality. A bank writing protection on such a bond, however, will expect a premium (positive spread over Libor) for selling protection on the bond. This will lead to a positive basis.
Greater protection level of the CDS contract: credit default swaps are frequently required to pay out on credit events that are technical defaults, and not the full default that impacts a cash bondholder. Protection sellers will therefore demand a premium for this additional risk, which makes the CDS trade above the ASW spread.
Bond identity and the delivery option: many CDS contracts that are physically settled name a reference entity rather than a specific reference asset. On occurrence of a credit event, the protection buyer often has a choice of deliverable assets with which to effect settlement. The looser the definition of deliverable asset is in the CDS contract documents, the larger the potential delivery basket: as long as the bond meets prespecified requirements for seniority and maturity, it may be delivered. Contrast this with the position of the bondholder in the cash market, who is aware of the exact issue that he is holding in the event of default. Default swap sellers, on the other hand, may receive potentially any bond from the basket of deliverable instruments that rank pari passu with the cash asset—this is the delivery option afforded the long swap holder. In practice therefore, the protection buyer will deliver the cheapest-to-deliver bond from the delivery basket, exactly as he would for an exchange-traded futures contract. This delivery option has debatable value in theory, but can have significant value in practice. For instance, the bonds of a specific obligor that might be trading cheaper in the market include:
- The bond with the lowest coupon
- A convertible bond
- An illiquid bond
- An asset-backed security (ABS) bond compared to a conventional fixed-coupon bond
- A very-long-dated bond
Following experience in the U.S. market (see Tolk [2001]), the United States adopted “modified restructuring” as one of the definitions of a credit event, which specifically restricts the delivery of long-dated bonds where restructuring is the credit event that triggers a contract payout. Nevertheless the last-named item is still relevant in the European market.
We see then that the delivery option therefore does carry value in the market. Similarly, for an option contract, this value increases the closer the contract holder gets to the “strike price,” which for a CDS is a credit event. Market sentiment on the particular reference name will drive the basis more or less positive, depending on how favorably the name is viewed. As the credit quality of the reference name worsens, protection sellers will quote higher CDS premiums; the basis will also widen as the probability of a credit event increases. This is illustrated in FIGURE 3.5, the basis graph for AT&T. In March 2002, the firm was rated A2/A. By October, the CDS spread had widened considerably, and in common with other firms in its sector whose telecoms customers had reduced expenditure, its rating has been downgraded to Baa2/BBB+. Where the opposite has occurred, and firms are upgraded as credit quality improves, the market has observed a narrowing basis.
FIGURE 3.5 AT&T basis: increasing as perceived credit quality worsens
As a consequence of all these factors, protection sellers will demand a higher premium for taking on a long position synthetically compared to a cash position.
Accrued coupon: this factor may be associated with cash- or physically settled contracts. In certain cases, the reference bond accrued coupon is also delivered to the protection buyer in the event of default. This has the effect of driving the CDS premium (and hence the basis) higher.
Assets trading above or below par: unlike a long cash bond position, a CDS contract provides protection on the entire par value of the reference asset. On occurrence of a credit event, the CDS payout will be par minus the recovery value (or minus the asset price at the time of default). If the asset is not trading at par, this payout will either over- or undercompensate the protection buyer, depending on whether the asset is trading at a premium or discount to par. So if the bond is trading at a discount, the protection seller will experience a greater loss than that suffered by an investor who is holding the cash bond. For instance, an investor who pays $90 per $100 nominal to buy a cash bond has less value at risk than an investor who has written CDS protection on the same bond. If the bond obligor defaults, and a recovery value for the bond is set at $30, the cash investor will have lost $60 while the CDS seller will have lost $70. As a result, the CDS price will trade at a higher level than the asset-swap price for the same asset where this is trading below par, leading to a larger basis.
The reverse applies for assets trading above par. If the reference asset is trading at a premium, the loss suffered by a CDS seller will be lower than that of the cash bondholder. This has the effect of driving the basis lower.
Funding versus Libor:3 the funding cost of a bond plays a significant part in any trading strategy associated with it in the cash market. As such, it is a key driver of the ASW spread. A cash bond investor will need to fund the position, and we take the bond's repo rate as its funding rate.4 The funding rate, or the bond's cost-of-carry, will determine if it is worthwhile for the investor to buy and hold the bond. A CDS contract, however, is an unfunded credit derivative that assumes a Libor funding cost. So an investor who has a funding cost of Libor plus 25 basis points will view the following two investments as theoretically identical:
- Buying a floating-rate note priced at par and paying Libor plus 125 bps
- Selling a CDS contract on the same FRN at a premium of 100 bps
Thus, the funding cost in the market will influence the basis. If it did not, the above two strategies would no longer be identical and arbitrage opportunities would result. Hence a Libor-plus funding cost will drive the basis lower. Equally, the reverse applies if the funding cost of an asset is below Libor (or if the investor can fund the asset at sub-Libor), which factor was discussed earlier.
Another factor to consider is the extent of any “specialness” in the repo market.5 The borrowing rate for a cash bond in the repo market will differ from Libor if the bond is to any extent special; this does not impact the default swap price, which is fixed at inception. This is more a market factor, however, which we consider in the next section.
Counterparty risk: the protection buyer in a CDS contract takes on the counterparty risk of the protection seller, which does not occur in the cash market. This exposure lasts for the life of the contract, and will be significant if, on occurrence of a credit event, the protection seller is unable to fulfill his commitments. This feature has the effect of driving down the basis, because to offset against this risk, the buyer will look to a CDS premium that is below the cash asset-swap spread. In addition, the protection buyer will wish to look for protection seller counterparties that have a low default correlation to the reference assets being protected, to further reduce counterparty risk exposure. For instance, the counterparty risk exposure of a protection buyer in a CDS contract is increased when the contract has been written by an investment bank on a bank that is also a CDS market maker.
On the other side, the protection seller is exposed to counterparty risk of the protection buyer. Should the latter default, the CDS contract will terminate. The protection seller will suffer a mark-to-market loss if the CDS premium has widened since trade inception.
Legal risk associated with CDS contract documentation: this risk has been highlighted in a number of high-profile cases, where an unintendedly broad definition of “credit event,” as stated in the contract documents, has exposed the protection seller to unexpected risks. Typically, this will be where a “credit event” has been deemed to occur beyond what might be termed a default or technical default. This occurred, for instance, with Conseco in the United States, as first discussed in Tolk (2001).
Associated with legal risk is documentation risk, the general risk that credit events and other terms of trade, as defined in the CDS documentation, may be open to dispute or arguments over interpretation. We can expect documentation risk to decrease as legal documentation is standardized across a larger number of shares. The 2003 International Swaps and Derivatives Association (ISDA) definitions also seek to address this issue.
Market Factors
Market factors that will influence the size and direction of the basis include the following:
Market demand: strong demand from protection buyers such as commercial banks protecting loan books, or insurance companies undertaking synthetic short selling trades, will drive the basis wider. Equally, strong market demand from protection sellers will drive the basis tighter.
Liquidity premium: the CDS for a particular reference asset may reflect a liquidity premium for that name. An investor seeking to gain exposure to that name can buy the bond in the cash market or sell protection on it in the CDS market. For illiquid maturities or terms, the protection seller may charge a premium. At the 2- to 5-year maturities, the CDS market is very liquid (as is the cash market). For some corporate names, however, cash market liquidity dries up toward the 10-year area. In addition, depending on the precise reference credit, the default swap may be more liquid than the cash bond, resulting in a lower default swap price, or less liquid than the bond, resulting in a higher price.
Liquidity in the cash market can be quite restricted for below-investment-grade names, and secondary market trading is usually confined to “current” issues. Similar to the repo market, the relationship flows both ways, and liquid names in the cash market are usually liquid names in the CDS market. For corporate names for whom no bonds exist, however, CDS contracts are the only way for investors to gain an exposure (see below).
Relative liquidity is also related to the next item on our list.
Shortage of cash assets: in some markets, it is easier to source a particular reference name or reference asset in the CDS market than in the cash market. This has always been the case in the loan market; although there has been a secondary market in loans in the United States for some time, it is relatively illiquid in Europe. In the bond market, it can be difficult to short some corporate bonds due to problems in covering the position in repo, and also the risk that the bonds go special in repo. When cash assets are difficult to short, traders and speculators can buy protection in the CDS market. This does not involve any short covering or repo risk, and also fixes the cost of “funding” (the CDS premium) at trade inception. The demand for undertaking this in CDS will have a positive impact on the basis.
The structured finance market: the rapid growth of the market in synthetic CDOs has both arisen out of, and driven, the liquidity of the CDS market. These products are considered in detail in Choudhry (2002) and Anson et al. (2004). Synthetic CDOs use CDS contracts to source reference credits in the market, and frequently make use of basket CDSs and a portfolio of credits. As investment vehicles, they sell protection on reference names. The counterparty to the CDO vehicle will hedge out its exposure in the CDS market. Large demand in the CDS market, arising from hedging requirements of CDO counterparties, impacts the basis and frequently drives it lower.
New market issuance: the impact of new bond and loan issues on the CDS basis illustrates the rapid acceptance of this instrument in the market, and its high level of liquidity. Where previously market participants would hedge new issues using interest-rate derivatives and/or government bonds, they now use CDSs as a more exact hedge against credit risk. The impact on the basis flows both ways, however, and may increase or decrease it, depending on specific factors. For example, new issues of corporate bonds enlarge the delivery basket for physically settled CDS contracts. This should widen the basis, but the cash market may also widen as well, as investors move into the new bonds. For loans, a new issue by banks is often hedged in the CDS market, and this should cause the basis to widen. Convertible bond issuance also tends to widen the basis; we noted earlier the impact of the issue of an exchangeable bond by Fiat on the CDS basis for that name.
The Basis Smile
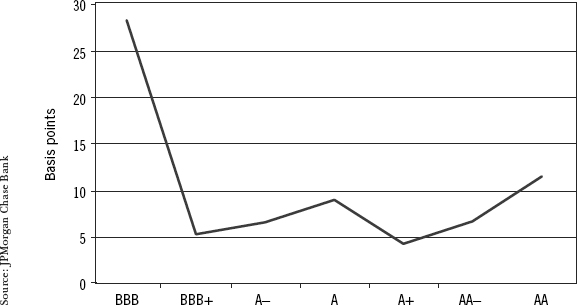
If plotted graphically, the CDS-cash basis tends to exhibit a smile. This is illustrated in FIGURE 3.6 and is known as the basis smile. This reflects a number of the features we have discussed above. The main reasons for the smile effect is that highly rated reference names, such as AA or higher, fund in the asset-swap market at sub-Libor. If an entity is buying protection on such a name, however, it will pay above-Libor premiums. The basis therefore tends to increase with better quality names, and results in the smile effect. Other factors that impact the smile are the cheapest-to-deliver options for lower-rated credits.
FIGURE 3.6 Basis smile for industrial names, November 2002
The Dynamics of the Default Swap Basis
We consider now the interaction of the different factors that drive the basis.
Positive and Negative Basis Situations
At any time, the CDS basis will reflect the combined impact of all the above factors. Some of these will affect the basis with positive bias, whereas others will have a negative bias. Generally, technical and market factors that tend to drive the basis wider include:
- CDS premiums above zero
- The delivery option
- Accrued coupon
- Bond price below par
- Funding below Libor
- Legal and documentation risk
- Market liquidity
- New bond issuance
- Difficulty of shorting cash bonds
The factors that tend to drive the basis lower include:
- Counterparty risk
- Bonds priced above par
- Funding above Libor
- Impact of the structured finance market
A reversal of market circumstances, however, can lead to the same factor having a reverse impact. For instance, if a credit is viewed in the market as being of decreasing quality, factors such as the delivery option, bonds trading below par, difficulty in shorting the cash bond, and worsening liquidity will all push the basis wider. If the credit is viewed as improving in terms of quality, however, the impact of these factors will diminish (for instance, the delivery option has decreasing value as the probability of a credit event's occurring decreases).
The market norm is a positive basis, for all the reasons that we have discussed. Although some of the factors above do influence the basis toward a negative value, observation tells us that the market norm is a positive basis. The combination of all the various factors tends to result in a negative basis for reference names that are highly rated in terms of credit quality. This is because those factors that drive the basis lower carry greater influence for highly rated names. Specifically,
- the cash bond price is generally closer to par for high-quality credits; and
- the value of the delivery option is less, as there is less chance of default or credit event for AAA- and AA-rated names.
In addition, compared to sub-investment-grade names, highly rated names are more often selected as reference credits in synthetic CDOs. All these factors combine to drive the basis lower for good-quality names, and this sometimes leads to negative values.
As well as being relatively uncommon, a negative basis is usually temporary. It usually reflects a particular set of circumstances, which disappear over time. A negative basis also represents an arbitrage opportunity for market participants who can trade across cash and synthetic markets, which would return the basis to positive territory as soon as it was exploited in the market. We illustrate the temporary nature of the negative basis in FIGURE 3.7. This shows how the basis had reverted to positive for those sectors that had exhibited negative basis, within three months.
Market Observation of the Basis Trend
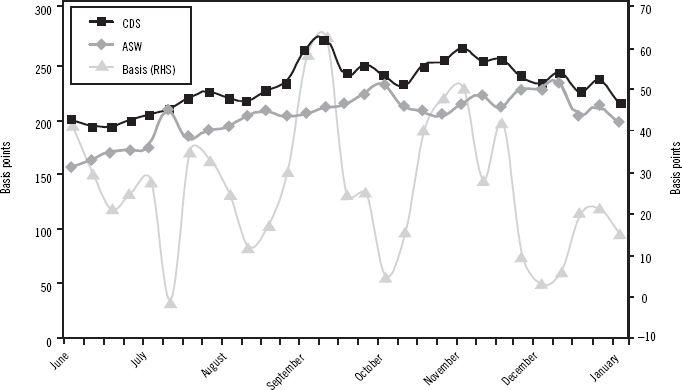
To illustrate the interplay between cash and synthetic markets, and the influence of all the above factors acting in concert, we show in FIGURE 3.8 the ASW and CDS spreads for a sample of 100 investment-grade U.S. dollar-denominated corporate bonds, during June 2002 to January 2003. This shows the default swap basis trend during this period—with the overall basis staying positive on the whole, but moving between positive and negative.
FIGURE 3.7 Basis values compared across sectors, September–December 2002

We conclude from this observation that
- the overall default swap basis was essentially positive;
- the CDS spread volatility at least matches that of the cash market, and sometimes exceeds it;
- at times the basis moved with the cash spread, but not to the same extent, thus widening as the cash spread widened;
- there is a high degree of correlation between the two markets, as we would expect; and
- the basis itself moves in the direction of the market—in other words, we observe that the basis widens as cash and synthetic spreads widen.
We may conclude further, then, that the basis acts much as the repo rate acts in the cash bond market. The relationship between special rates in repo and bond prices moves both ways, and one can lead the other depending on circumstances (see Bank of England [1997]). The CDS market has a two-way relation-ship with the cash asset-swap market, and each will lead the other according to circumstance.
FIGURE 3.8 The dynamics of the credit default swap basis, 2002–2003
The iTraxx Index Basis6
The iTraxx and CDX indexes have developed into a reasonably liquid set of CDS contracts and as such are viewed as a key credit market indicator by investors. As a market benchmark, they can be taken to represent the market as a whole, similar to an equity index, and as such can provide a guide to the health of the credit market as well as imply market perception of future direction. Because there is an intrinsic “fair value” implied for the index, which differs from the actual market level at any time, there is also a CDS index basis that can be observed. Assessing this basis therefore is an important part of an investor's relative value analysis of the market.
A CDS index basis arises because of the different approaches available to valuing the index spread.7 We can describe the following:
![]() Theoretical spread: This is the average of the single-name CDS spreads for all the constituent names in the index, weighted by probability of default.8 It is also known as the fair spread.
Theoretical spread: This is the average of the single-name CDS spreads for all the constituent names in the index, weighted by probability of default.8 It is also known as the fair spread.
![]() Market spread: This is the spread quoted for trading in the market. It is based on the theoretical spread, but adjusted using a flat credit curve. It is also known as the intrinsic spread or the real spread.
Market spread: This is the spread quoted for trading in the market. It is based on the theoretical spread, but adjusted using a flat credit curve. It is also known as the intrinsic spread or the real spread.
There is also the average spread, which is simply the average of all the constituent name CDS spreads equally weighted.
The index basis is given by
![]()
From a relative value analysis point of view, we require a tractable means of calculating the two spreads or at least of measuring the basis. This is considered next.
The Index Spread
The theoretical spread is sometimes defined as the average spread, but this is not correct because it does not weight the constituent names' probability of default. In fact, the theoretical spread will differ from the average spread because of the nature of the construction of the index: an investor will receive the same spread for all reference names, whereas the average CDS spread of the constituent names will be different from this fixed spread.
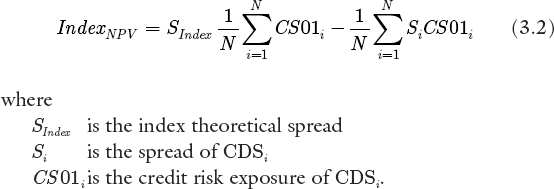
Instead, we define the theoretical spread for a CDS written on the index as the spread that equates the net present value of the swap to zero. The expression for the spread is derived from the expression for the net present value of the CDS. The latter assumes—exactly as for an interest-rate swap—that the premium leg of the CDS is equal to the default leg. This is written as
Note that CS01 is also referred to as risky-DV01, risky- PV01, or risky-PVBP. It is defined as the change in market value of a CDS contract for a 1-basis-point change in the CDS premium.10 The expression for the CS01 is given in the shaded box (see EXAMPLE 3.1).
EXAMPLE 3.1 CDS mark-to-market risk exposure
In Chapter 1, we described the approach to pricing a CDS contract. In essence, the CDS spread premium is that value that equates the net present value of the contract to zero, given our assumption that under no-arbitrage principles the fixed (premium) leg of the swap must equal the floating (default) leg. Therefore, we may write
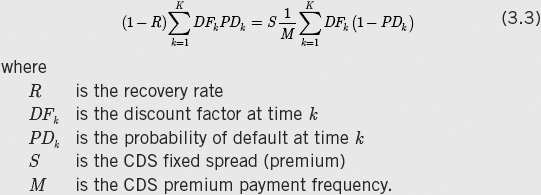
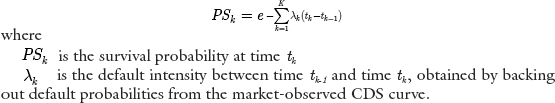
Note that (1 − PDk) is the probability of survival to time k, which is given by the expression shown, although in certain texts it is written out as a separate expression.9
From (3.3) we can derive an expression for the CDS CS01, which is the main CDS risk exposure measure. CS01 is the change in market value of a CDS for a 1-basis-point change in the CDS spread, and is usually given by
![]()
Some market practitioners refer to “risky-DV01” as the change in CDS value for a 1-basis-point parallel shift in the CDS credit-risky curve.
Given (3.2), the expression for the index theoretical spread can be written as

In general, the theoretical spread lies below the index pure average spread.
The market or real spread differs from the spread given by (3.4). The difference arises because market convention is to value the index CDS using a flat credit curve.11 So we describe the market spread as that spread that makes the net present value for the contract, assuming a flat credit curve, equate to the net present value given by (3.4) above. So formally, for SMarket we write
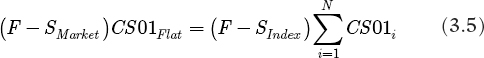
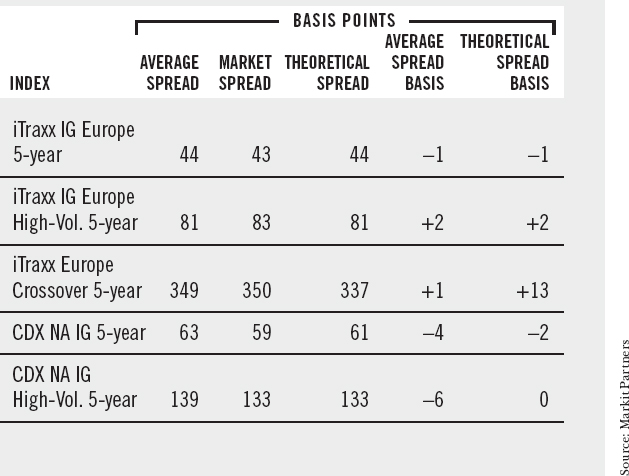
where

In practice, the difference between the index theoretical spread and the market spread is not great, except for indexes composed of high-volatility names. From the expressions above, we can see that a key driver of the spread difference is the steepness of the credit-risky curves for each constituent name; the steeper the curve(s), the greater the difference between the two spreads. At any CDS spread level, a flatter credit-risky curve means a lower CS01.
The level of the index fixed premium also influences the difference: if the fixed premium lies above the theoretical spread, the market spread will be lower than the theoretical spread, and vice versa. This is because of the impact of the change in the market spread on the flat curve CS01, with increases in the spread reducing the CS01.
Market Observation
In practice, the basis in index CDS is small, with exceptions being observed for high-volatility indexes. We consider the June 2011 iTraxx investment-grade Europe index (series 5), which commenced trading in March 2006 as the 5-year benchmark. FIGURE 3.9 shows the levels for the market and theoretical spreads for this index during March 2006–June 2006, while FIGURE 3.10 shows the basis. Observe that the basis fluctuates from negative to positive and back, although the absolute values are small.
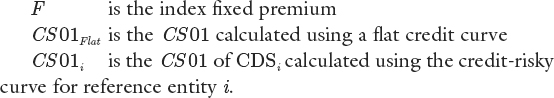
Irrespective of its absolute value, observing the basis enables investors to gauge perceived fair value for the index. By comparing the market spread against the theoretical spread, we can assess whether the index is trading at fair value or not. For instance, during June 2005 the iTraxx Europe crossover 5-year index was observed with a basis of around 13 basis points, which suggested mispricing of the index fair value. For comparison, we show the basis values for other indexes at the same time, with data reported by Markit Partners.
FIGURE 3.9 iTraxx IG Europe index CDS theoretical and market spreads, March–June 2006

FIGURE 3.10 iTraxx IG Europe index CDS basis

TABLE 3.1 Index CDS basis for selected indexes, June 2006
The Impact of the Basis on Trading Strategy
From the inception of trading in CDS, market participants have known that inefficiencies in pricing can result in arbitrage opportunities. Using CDS, the basic market neutral strategy (credit-risk free) is to buy the cash bond and swap it in the asset-swap market, and buy protection using CDS. The trader receives the bond coupon now as floating coupon, and pays the CDS premium. To match payment and receipt bases, the bond is a floating-rate bond whose coupon is swapped out to fixed rate.
The existence of the basis enables us to quantify the theoretical gain for the arbitrageur. As with other basis-type trades, typified by the government bond basis, the existence of a non–zero basis implies a risk-free arbitrage opportunity. If the basis is non–zero, a trader can put on a credit-risk-free arbitrage trade across the cash and synthetic markets. The two scenarios are:
- Positive basis: sell the cash bond and sell protection on that bond.
- Negative basis: buy the bond and buy protection using a CDS. In this trade, the investor has the value of the delivery option (we assume a physically settled CDS).
The first trade requires short-covering in the repo market, which exposes the investor to funding risks if the bond goes special. The latter trade is easier to implement, as there are no short-cover issues to consider, but it must be funded on the balance sheet. Therefore, the investor's funding costs will also impact the profitability of the trade. If it is sub-Libor, the trade should look attractive, and the investor will profit by the amount of the basis; if the funding cost is above Libor, it must be below the negative basis value for the trade to work. Because the basis trade for a negative basis is easier to implement, however, negative basis values rarely stay negative for long, and revert to positive once arbitrageurs get to work.
The basis can also be used to identify ways to enhance portfolio returns for a fund manager who is able to switch from cash to synthetic markets and vice versa. As the basis moves, it indicates which sector is experiencing widening spreads, into which fund managers can switch. Alternatively, a fund manager who has a view on which corporate sectors are likely to experience significant moves in the basis can move into that sector and undertake a basis trade to benefit from this move.
We examine these issues further in Chapter 6.
Summary
From this study of the credit default swap basis, we can conclude that the CDS market is very liquid and very closely correlated to the movements of the cash bond market. Although the theoretical argument can be made, using the no-arbitrage principle, that the CDS premium must equal the asset-swap premium, market observation tells us that a non–zero credit default swap bond basis always exists between the CDS and asset-swap markets. A non–zero basis arises from the influence of a number of technical and market factors, the impact of which varies with market conditions.
The basis moves closely with the markets as a whole. The relationship between the synthetic and cash markets, which is measured by the basis, is a two-way one, and the synthetic market will often lead the cash market. This experience, which mirrors the relationship in the interest-rate market between cash bonds and interest-rate derivatives, is a clear indicator of the liquid market that now prevails in credit default swaps.
References
Anson, M., F. Fabozzi, M. Choudhry, and Ren-Raw Chen. 2004. Credit derivatives: Instruments and applications. Hoboken, NJ: John Wiley & Sons.
Bank of England. 1997. Review of the gilt repo market. Quarterly Bulletin (February).
Bomfim, A. 2002. Credit derivatives and their potential to synthesize riskless assets. Journal of Fixed Income 12 (3) (December): 6–16.
Choudhry, M., 2001. Some issues in the asset-swap pricing of credit default swaps. Derivatives Week, Euromoney Institutional Investor PLC (December 2).
_____. 2002. Combining securitisation and trading in credit derivatives: An analysis of the managed synthetic collateralised debt obligation. In Euromoney debt capital markets handbook 2002. London: Euro-money Publications.
Fabozzi, F., and L. Goodman, eds. 2001. Investing in collateralised debt obligations. New Hope, PA: FJF Associates.
Tolk, J. 2001. Understanding the risks in credit default swaps. Moody's Special Report (March 16).
1. For instance, see RISK, Robeco CSO, May 2002. The asset-swap market is described as being part of the cash market, despite the fact that an interest-rate derivative (the swap element) is part of an asset swap.
2. At this stage, we state the formal definition of the credit default swap-bond basis as being the difference between the credit default spread and the par bond floating-rate spread of the same reference asset, the latter as expressed for an asset swap on the bond.
3. It is a moot point whether this is a technical factor or a market factor. Funding risk exists in the cash market, and does not exist in the CDS market: the risk that, having bought a bond for cash, the funding rate at which the cost of funds is renewed rises above the bond's cost-of-carry. This risk, if it is to be compensated in the cash (ASW) market, would demand a higher ASW spread, and hence would drive the basis lower.
4. This being market practice, even if the investor is a fund manager who has bought the bond outright: as the bondholder, he can repo out the bond, for which he will pay the repo rate on the borrowed funds. So the funding rate is always the bond's repo rate for purposes of analysis.
5. If the repo rate for a specific bond is greater than around 20 bps lower than the “general collateral” rate for that asset class's repo rate, it is deemed special. The cost of funds payable by the holder of a special bond that is repo'ed out will be lower than Libor.
6. The author would like to thank Suraj Gohil for his invaluable assistance with this section. Any errors remain the sole responsibility of the author.
7. One is reminded again that a more accurate term for spread with respect to credit derivative prices is premium, particularly with respect to CDS prices, as the spread is not a spread over anything. However, the term is in common usage in the market.
8. Probability of Default (PD) = Spread/(1 − R) where R is the recovery rate.
9. We would write (1 − PDk) = PSk where PSk is the survival probability to time k. It is given by
10. Strictly speaking, we define it as the change in contract market value for a 1-basis-point parallel shift in the credit curve. As with a bond instrument DV01, this is often taken as representing a change in market value for a 1-basis-point change in yield (bond) or CDS premium (CDS).
11. This is also the methodology employed by the CDSW screen on the Bloomberg.