CHAPTER 4
Supply and Demand and the Credit Default Swap Basis
In this chapter, we consider the impact of supply and demand across both the cash and synthetic markets and their impact on the basis. This serves to further illustrate the interaction between the two markets. We then discuss why the traditional asset-swap (ASW) method of measuring the basis may no longer be preferred, a theme explored to greater depth in Chapter 5.
One of the factors that impact the basis is supply and demand, in both cash and synthetic markets. For many reference names, there is greater liquidity in the synthetic market than in the cash market, which would tend to influence the basis into negative territory, but other factors push the basis the other way (see previous chapter). With structured finance assets such as asset-backed securities (ABS), though, supply in the cash market is a key factor, and has been responsible for a negative basis over a longer time period than observed in conventional bond markets.
Supply and Demand
The bonds we will consider in this illustration are all examples of residential mortgage-backed securities (RMBS)—in fact, a special class of RMBS known as Home Equity.1 We show three of these bonds in TABLE 4.1, with rate spreads as of September 2004.
TABLE 4.1 Securities used in illustration, showing CDS and cash market prices, September 21, 2004

All three bonds were part of new issues, for first settlement in September 2004. The mezzanine tranches were in high demand at time of issue. Under conventional circumstances, the CDS price for these securities would be expected to lie above the Note yield. But in fact, the opposite is true, as the market quotes shown in Table 4.1 indicate. This reflects the lack of supply of these bonds in the market, such that investors are forced to access them in the synthetic market.
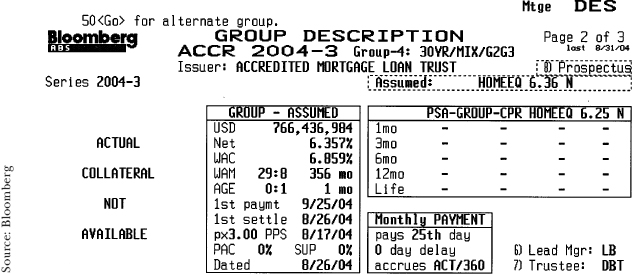
The small size of these Note tranches is a key reason behind the low availability of paper. We see that only $7.6 million of the ACCR bond is available, a very low figure in any securitization. The entire securitization itself is a large issue, as we see from FIGURE 4.1. This shows the Bloomberg DES page for the transaction, which is called Accredited Mortgage Loan Trust. From this, we see that a total of $766,436,984 of Notes was issued as part of this deal, but the tranche in question—the Baa3/BBB-rated 2M7 piece—made up less than 1% of this total. Given this paucity of supply, the bond can be sourced more easily in the CDS market, but this carries with it a reduction in yield spread, associated with the greater demand over supply.2
FIGURE 4.1 Bloomberg screen DES for ACCR Home Equity securitization transaction
We observe similar characteristics for the two other bonds in our sample. The Countrywide Asset-Backed Certificates transaction is made up of a total of $4.426 billion in 12 different tranches; the mezzanine tranche rated Baa3/BBB was issued in size of only $46 million. The total size of the New Century Home Equity Loan Trust deal was $1.937 billion, while the particular mezzanine tranche we are interested in was issued in size of only 1% of this total. This bond exhibits the widest spread in our small group, with the CDS trading at a premium of 55 basis points to the theoretical cash price.
CDS Mechanics
The CDS contracts written on these structured finance securities have minor differences in their terms compared to vanilla single-name CDS instruments. This includes the following:
![]() A premium payment set to match the payment date of the cash bond, in this case a monthly payment on the 25th of each month. The standard CDS payment terms are quarterly in arrears.
A premium payment set to match the payment date of the cash bond, in this case a monthly payment on the 25th of each month. The standard CDS payment terms are quarterly in arrears.
![]() In practice, an unfixed maturity date. The CDS written on these bonds is set to match their maturity. From FIGURE 4.2, we see that the ACCR 2M7 tranche has a weighted-average life (WAL) of 5.4 years. This is of course an estimate based on a specified prepayment rate, which is standard practice for all RMBS bonds. In reality, the bond may well pay off before or after 5.4 years. The CDS contract language specifies that the contract expires when the cash bond itself is fully paid off.
In practice, an unfixed maturity date. The CDS written on these bonds is set to match their maturity. From FIGURE 4.2, we see that the ACCR 2M7 tranche has a weighted-average life (WAL) of 5.4 years. This is of course an estimate based on a specified prepayment rate, which is standard practice for all RMBS bonds. In reality, the bond may well pay off before or after 5.4 years. The CDS contract language specifies that the contract expires when the cash bond itself is fully paid off.
![]() The transaction undertaken by the investor for the CDS that references the ACCR 2M7 tranche was for a notional of $10 million. This is more than the actual amount in existence of the physical bond. Hence, it is standard practice for all structured finance CDS contracts to always be cash-settled instruments.
The transaction undertaken by the investor for the CDS that references the ACCR 2M7 tranche was for a notional of $10 million. This is more than the actual amount in existence of the physical bond. Hence, it is standard practice for all structured finance CDS contracts to always be cash-settled instruments.
FIGURE 4.2 Bloomberg screen DES for 2M7 tranche of ACCR transaction, September 21, 2004

By setting the terms in this way, investors are able to access these types of names and asset classes where the cash market bond is no longer available to them, by selling protection on the bond tranches using a CDS.
The CDS market maker that is the counterparty to the CDS investor may gain from acting in this business in the following ways:
- Buying protection on this class of assets releases economic capital that can be invested in higher-yielding assets elsewhere.
- It may be able to find similar assets in the cash market that yield a higher spread than the CDS protection it is paying for.
- It can treat this business as trading activity—CDS market making—and seek to gain a trading profit.
Irrespective of the motivation of the investor and the CDS counterparty to these trades, this business illustrates the contribution to market liquidity of credit derivatives, as well as the impact of supply and demand on reversing the market convention of a positive basis.
A Different Basis Measure
The difference between the CDS and the ASW price, the CDS basis, was given in the previous chapter as
credit default spread (D) − the asset-swap spread (S).3
Where D − S > 0, we have a positive basis. A positive basis occurs when the credit derivative trades higher than the asset-swap price, and is the norm. Where D − S < 0, we have a negative basis. This describes where the credit derivative trades tighter than the cash bond asset-swap spread. It is more unusual to see this for any length of time. On balance, the net impact of all the factors that drive the basis serves to make it positive. In essence, this is because the seller of protection on a standard CDS contract is affording a greater level of protection on the reference name than a cash investor in a bond issued by that reference name.
The ASW method, however, gives a different measure for the basis than other spread measures. FIGURE 4.3 shows Bloomberg screen ASW for the British Telecom 8.125% 2010 bond, as of December 1, 2005. This indicates an asset-swap spread of 74.0 basis points. FIGURE 4.4 shows screen CRVD for the British Telecom reference name, which lists the ASW spread as well as CDS prices for that entity. We see that the price for this bond in the CDS market is 61.25 basis points; this is the 5-year CDS price for British Telecom, and would appear to be the best price to compare because the bond in question is a 5-year bond. From these two values, it is a simple calculation to determine the basis as defined above, which would be −12.75 basis points. The value shown in Figure 4.4, however, is 32.1 basis points, a positive value. This is because screen CRVD measures the basis relative to the bond Z-spread, which is shown as 26.2 basis points and lies below the CDS curve (also shown in Figure 4.4).
FIGURE 4.3 Bloomberg screen ASW, asset-swap spread for British Telecom bond as of December 1, 2005

FIGURE 4.4 Bloomberg screen CRVD, CDS curve versus Z-spread for British Telecom bond as of December 1, 2005

So, we note that either the asset-swap spread or the Z-spread can be used in the basis calculation. Each gives a different measure of the basis. Although market practitioners appear to use the latter as often as the former, it is important to be aware of exactly what is being measured, so that relative analysis remains accurate. We explore this issue in the next chapter.
References
Choudhry, M. 2001. Some issues in the asset-swap pricing of credit default swaps. Derivatives Week (December 2).
_____. 2004a. Structured credit products: Credit derivatives and synthetic securitisation. Singapore: John Wiley & Sons.
_____. 2004b. The credit default swap basis: Analysing the relationship between cash and synthetic markets. Journal of Derivatives Use, Trading and Regulation 10 (1) (June): 9–26.
Fabozzi, F., ed. 2004. The handbook of fixed income securities, 7th ed. New York: McGraw-Hill.
1. For further information on Home Equity securities, see Fabozzi (2004). For further detail on securitization generally, ABS, and mortgage-backed securities (MBS), see Choudhry (2004a).
2. In effect, the cash market Note yield of 350 bps for this bond is a theoretical construct. Because the bond in effect cannot be purchased, as no paper is available, the cash market yield for this name cannot actually be earned by any investor.
3. At this stage, we may state the formal definition of the credit default swap—bond basis as being the difference between the credit default spread and the par bond floating-rate spread of the same reference asset, the latter as expressed for an asset swap on the bond.