CHAPTER 6
Trading the CDS Basis: Illustrating Positive and Negative Basis Arbitrage Trades
The foregoing chapters have introduced and described the cash–synthetic credit market basis, which we have chosen to call the credit default swap (CDS) basis. A basis exists in any market where cash and derivative forms of the same asset are traded. We have seen how, given that the derivative represents the cash asset in underlying form, there is a close relationship between the two types, which manifests itself in the basis and its magnitude. Fluctuations in the basis give rise to arbitrage trading opportunities between the two forms of the asset. This has proved the case in a more recent market, that of credit derivatives.1
In Chapter 2, we summarized the logic behind the no-arbitrage theory of pricing credit default swaps, which suggests that the premium of a CDS should be equal to an asset-swap (ASW) spread for the same reference name. There are a number of reasons why this is not the case, described in Chapter 3, and in practice a non–zero basis exists for all reference names in the credit markets. The existence of a non–zero basis implies potential arbitrage gains that can be made if trading in both the cash and derivatives markets simultaneously. In this chapter, we describe trading the basis, with real-world examples given of such trades, illustrating the positive basis trade and the negative basis trade.
Relative Value and Trading the Basis
The introduction of credit derivatives into the financial markets has provided a new asset class for investors in credit-risky assets. That credit derivatives, particularly credit default swaps, can be traded in a liquid market in a wide range of names provides investors and other market participants with an additional measure of relative value across the cash and synthetic markets. The existence of a non–zero basis, either positive or negative, can act as a powerful indicator of value in either or both markets. In addition, during an economic boom period or time of general business confidence, when corporate credit spreads are tight, investors look to new opportunities to meet target rates of return or realize value. Exploiting mispricing in cash and synthetic markets, through basis arbitrage trading, is one such opportunity.
As we noted in passing in Chapter 3, there are two types of basis trade:
![]() Negative basis trade: this position is defined as buying the bond and buying protection on the same reference name. It is generally put on if the CDS spread2 is relatively low compared to where it has been, and if the cash bond spread is relatively high. The objective of a negative basis trade is to earn a credit-risk-free return by buying and selling the cash and the synthetic. In a negative basis trade, the cash bond is viewed as cheap and the CDS as dear.
Negative basis trade: this position is defined as buying the bond and buying protection on the same reference name. It is generally put on if the CDS spread2 is relatively low compared to where it has been, and if the cash bond spread is relatively high. The objective of a negative basis trade is to earn a credit-risk-free return by buying and selling the cash and the synthetic. In a negative basis trade, the cash bond is viewed as cheap and the CDS as dear.
![]() Positive basis trade: this is where the arbitrageur will sell the bond and sell CDS protection on the same name, to exploit a price differential that is brought about by a relatively high CDS price and a relatively low cash bond spread.
Positive basis trade: this is where the arbitrageur will sell the bond and sell CDS protection on the same name, to exploit a price differential that is brought about by a relatively high CDS price and a relatively low cash bond spread.
As we discussed in Chapters 3 and 5, there is more than one way to measure the basis. Whichever approach we employ, in essence we are comparing a CDS premium to a spread over Libor, so all analysis is undertaken relative to Libor. Put simply, we wish to earn a spread pickup on our trade, so the largest possible spread gain will generate the largest profit. There are other considerations as well, which can include the following:
- Extent of credit-risk premium received and/or earned
- Any impact of the “cheapest-to-deliver” option for the protection buyer
- Impact of funding cost of the cash asset
- The effect of basis trades in reference names that trade at sub-Libor in the cash market3
- The relative levels of liquidity in the cash and synthetic market
- The effectiveness of the trade hedge
The last point we mention is very important. To be a pure arbitrage, the basis package must hedge both credit risk and interest-rate risk. For large-size trades, spread risk may also need to be hedged.4 Otherwise the trade will not be a pure risk-free one, and the final return on it will be influenced by (at the time of inception) unknown factors.
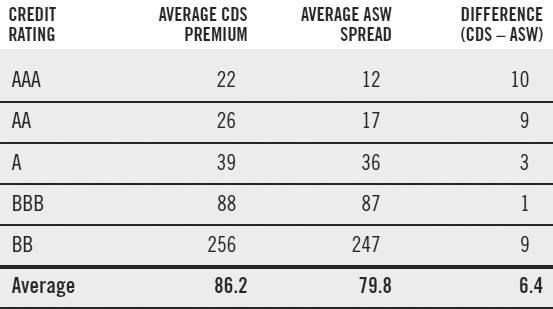
As we noted in Chapter 3, the various factors that drive the basis tend to drive it to positive territory. In other words, a positive basis is the norm. TABLE 6.1 shows the average CDS premium and ASW spread across the ratings categories for selected industrial names during 2005. For no set of names was a negative basis the average value. In other words, we should expect the CDS to trade higher than the cash. On average, CDS spreads are 6–7 basis points above ASW spreads. Overall, a negative basis is a good initial indicator that special factors are at work.
TABLE 6.1 Average CDS and ASW spreads for selected industrial names during 2005
Spread source: Bloomberg
Factors Influencing the Basis Package
When constructing the basis trade, it is important that we compare like-for-like, and that we hedge the trade as effectively as possible. That is, we need to consider the most appropriate cash market spread against which to measure the CDS spread, and we need to also construct the hedge with care.
Measuring the Basis
The question of which cash market spread to use when measuring the basis is an important one. We saw in Chapter 5 that the different measures for the cash spread produce different values for the basis. The answer to this problem is not clear-cut; credit default swaps and cash bonds trade in different markets, with different market drivers, and a pure comparison may not actually be possible. We know that we need to select a Libor-based spread; the question is, which spread? As we noted earlier in this book, the CDS “spread” is not a spread at all, but rather, a fixed premium received quarterly by the protection seller. Although, in theory, the CDS spread and the ASW spread measure the credit risk of the reference name, other, more specific factors drive each of them, such that, in effect, they are actually measuring slightly different things. The CDS premium can be viewed as a pure credit-risk price—that is, it is the credit premium for the name. Although other factors will drive this premium, including supply and demand, at least as an unfunded instrument and par product, we know these considerations do not apply. We want to compare it therefore to the cash measure that is the most accurate measure of the reference entity's credit risk.
FIGURE 6.1 Bloomberg page YAS for ThyssenKrupp AG 4.375% March 2015, as of March 13, 2006
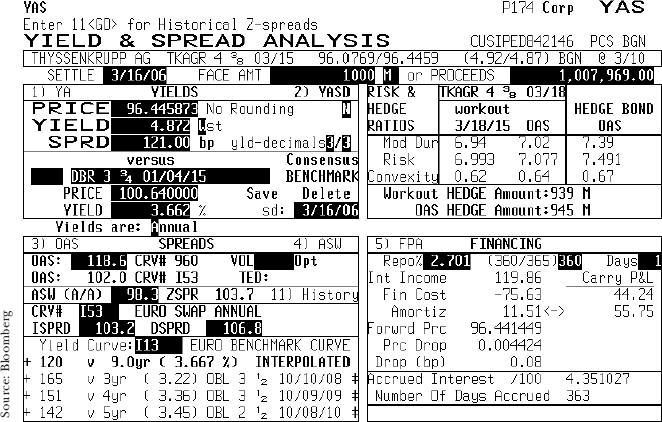
FIGURE 6.2 Bloomberg page CRVD for ThyssenKrupp AG reference name, as of March 13, 2006
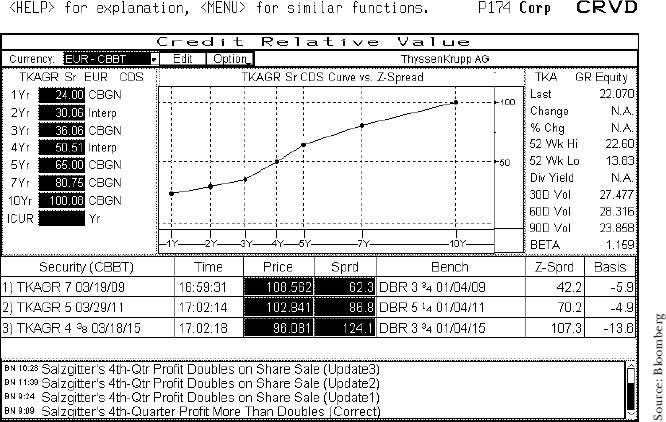
A cash bond spread can be measured in a number of ways, as we saw in Chapter 2. FIGURE 6.1 shows the Bloomberg YAS page for a ThyssenKrupp AG issue, the 4.375% March 2015 bond. This shows the different bond spread measures that can be calculated. In a basis trade, it is the spread that is the best indicator of the reference name's credit-risk premium that we should, ideally, be comparing the CDS spread to. The CDS price is 93.7 basis points (bps), which is an interpolated spread based on the CDS curve. The CDS curve is shown on screen CRVD for this name, given in FIGURE 6.2.
We see from Figure 6.1 that for this name, we have
- an I-spread (ISPRD) of 103.2 bps;
- an asset-swap (ASW) spread of 98.3 bps; and
- a Z-spread (ZSPR) of 103.7 bps.
So, in other words, the Libor spread for this bond ranges from 98.3 bps to 103.7 bps. The spread to the government bond benchmark is 121 bps, based on the price of the bond at Euro 96.445. In other words:
![]() the interpolated spread of 103.2 bps is the straight difference between the bond gross redemption yield and Libor rate for the same term;
the interpolated spread of 103.2 bps is the straight difference between the bond gross redemption yield and Libor rate for the same term;
![]() in an asset-swap package, the investor would receive Libor + 98.3 bps and an implied receipt of Euro 3.555 up front (as the bond is priced below par) while paying the coupon of 4.375% over the term of the deal; and
in an asset-swap package, the investor would receive Libor + 98.3 bps and an implied receipt of Euro 3.555 up front (as the bond is priced below par) while paying the coupon of 4.375% over the term of the deal; and
![]() the Z-spread of 103.7 bps represents the spread over and above the interbank interest-rate swap curve that would equal the bond's present value with its coupon and principal payments over the term to maturity.
the Z-spread of 103.7 bps represents the spread over and above the interbank interest-rate swap curve that would equal the bond's present value with its coupon and principal payments over the term to maturity.
As we noted, for basis trading purposes, ideally we should use the bond spread that best represents the credit premium payable for taking on the issuer's credit risk. There is no real “true” answer, although in practice the ASW spread and the Z-spread are the most commonly used. Note, however, as in this case, for bonds that trade close to par, the various spread measures are actually quite close.
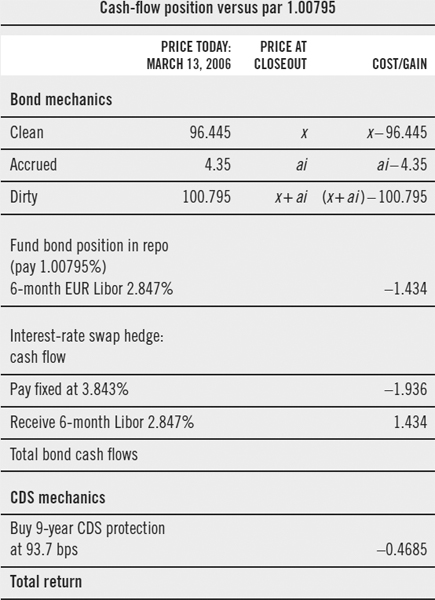
As part of the analysis in a real-world situation, we should also consider the actual return generated by a basis trade package. This takes into account market factors such as bid-offer spread and funding costs. TABLE 6.2 shows how we would undertake this analysis at the closeout of the trade, be it after 1 month, 3 months, 1 year, or other target horizon. In this analysis, the total return of the trade is, unsurprisingly, a function of the actual price of the bond at closeout. The actual result is not known, as we do not know the price of the bond in the future, at the time we put on the trade, hence the blank fields in Table 6.2—we show this table to suggest how we should look to perform the analysis. Later on in this chapter, we show some real-world trade results.
TABLE 6.2 Suggested return analysis for negative basis trade for 6-month trade horizon, ThyssenKrupp bond
The Hedge Construction
It is intuitively easy to view a basis package as a straight par-for-par trade of notionals. That is, we would buy (or sell) $10 million nominal of a bond against buying (or selling) $10 million of notional in the CDS. This type of trade is still quite common due to its simplicity. Unless the cash bond in question is priced at par, however, this approach is not correct, and the analysis will not be accurate. The biggest errors will arise when the bond is trading significantly away from par.
As part of the analysis into the trade, then, we need to assess how much nominal of bond to buy or sell against a set amount of CDS notional, or conversely, how much CDS protection to put on against a set amount of the bond. There is no one way to approach this; the key is the assumption made about the recovery rate in the event of default. In practice, traders will adopt one of the following methods:
![]() Par/par: this is a common approach. In such a trade, identical par amounts of the bond and the CDS are traded. The advantage of this method is that the position is straightforward to maintain. The disadvantage is that the trader is not accurately credit-risk hedged if the bond is priced away from par. The CDS pays out par (minus the deliverable asset or cash value on default) on default, but if the bond is priced above par, greater cash value is at risk in a negative basis trade. Therefore, this approach is recommended for bonds priced near to par or for trades with a long-term horizon. It is not recommended for use with bonds at higher risk of default (for instance, sub-investment-grade bonds), as default events expose this trade to potentially the highest loss; it is also more at risk for anything other than small changes in spread.
Par/par: this is a common approach. In such a trade, identical par amounts of the bond and the CDS are traded. The advantage of this method is that the position is straightforward to maintain. The disadvantage is that the trader is not accurately credit-risk hedged if the bond is priced away from par. The CDS pays out par (minus the deliverable asset or cash value on default) on default, but if the bond is priced above par, greater cash value is at risk in a negative basis trade. Therefore, this approach is recommended for bonds priced near to par or for trades with a long-term horizon. It is not recommended for use with bonds at higher risk of default (for instance, sub-investment-grade bonds), as default events expose this trade to potentially the highest loss; it is also more at risk for anything other than small changes in spread.
![]() Delta-neutral: this is an approach similar to that used for duration-weighted bond spread trades such as butterfly/barbell trades (see Choudhry [2004b]). It is appropriate when the maturity of the bond does not match precisely the maturity of the CDS.
Delta-neutral: this is an approach similar to that used for duration-weighted bond spread trades such as butterfly/barbell trades (see Choudhry [2004b]). It is appropriate when the maturity of the bond does not match precisely the maturity of the CDS.
![]() DV01: this approach sets the CDS notional relative to the actual price of the bond. For example, in a negative basis trade, if the bond is trading at EUR120, then we would buy 120% notional of the CDS. This is a logical approach, and recommended if the bond is trading away from par. An assumption of the recovery rate will influence the choice of hedging approach and the notional amount of CDS protection to buy. This is discussed in the next section.
DV01: this approach sets the CDS notional relative to the actual price of the bond. For example, in a negative basis trade, if the bond is trading at EUR120, then we would buy 120% notional of the CDS. This is a logical approach, and recommended if the bond is trading away from par. An assumption of the recovery rate will influence the choice of hedging approach and the notional amount of CDS protection to buy. This is discussed in the next section.
Hedging and Risk
Basis trades are termed as “arbitrage” trades, but strictly speaking are not pure arbitrage trades because they are not risk free. More accurately, they should be called relative value trades. Here, we discuss some issues in unhedged risk.
For instance, the coupon on the bond is not hedged: to do this, we would need to put on a series of coupon strips synthetically to hedge each coupon payable during the life of the bond. In the event of default, the timing of default is crucial; if this occurs just prior to a coupon payment, the actual loss on the trade will be higher than if default occurred just after a coupon payment. In either case, the CDS position does not protect against coupon risk, so remains unhedged.
Another risk factor is the recovery rate assumed for the bond. The rate of recovery cannot be hedged, and the actual recovery after event of default will impact the final profit/loss position. The impact is greatest for bonds that are priced significantly away from par. To illustrate this, consider a bond priced at $110.00. To hedge a long position of $10 million of this bond, assume we buy protection in $11 million nominal of the CDS. We do not use a par/par approach because otherwise we would be underhedged. Now consider, in the event of default, the following recovery rates:
![]() 0% recovery: we receive $11 million on the CDS, and lose $11 million (1.10 × 10,000,000) on the bond, so net we are flat.
0% recovery: we receive $11 million on the CDS, and lose $11 million (1.10 × 10,000,000) on the bond, so net we are flat.
![]() 50% recovery: we receive $5.5 million on the CDS, and lose $6 million on the bond (the bond loss is $5 million nominal, and so we receive back $5 million, having paid out $11 million), so net we are down $500,000.
50% recovery: we receive $5.5 million on the CDS, and lose $6 million on the bond (the bond loss is $5 million nominal, and so we receive back $5 million, having paid out $11 million), so net we are down $500,000.
So, in other words, under a 50% recovery rate scenario, we are underhedged still, and would need more notional of CDS to cover the loss on the bond. If the recovery rate is 30%, we will lose on the position, while the higher over 30% it is, we will lose progressively more. Note that the reverse analysis applies when the bond is priced below par. Overall, then, we conclude that the assumption of the recovery rate must influence the notional size of the CDS position.
Generally, the market assumes the following recovery rates:
- Investment-grade: 40%
- Insurance companies and corporates: 30%
- Sub-investment-grade: 20%
Some banks assume a 50% recovery rate in their pricing models. One more robust approach might be to take into account historical data of actual defaults and ultimate recovery rates. At the current time, however, some markets, notably those in Europe and Asia, suffer from a paucity of data. So, for the time being, market participants use assumed recovery rates.
Trade Examples
Here, we illustrate the concept of basis trading with hypothetical trade ideas. For the purposes of this hypothetical illustration, we determine at the outset to run the trade for a 1-month time horizon, so after 1 month, we unwind the trade and see how the trade idea has performed, by checking market prices at the time of the unwind (that is, 1 month later). In reality, we may have a longer horizon, or keep running a trade that is offside because our view is a longer-term one.
Positive Basis Trade
In a positive basis trade, the CDS trades above the cash spread, which can be measured using the ASW spread or the Z-spread.5 The potential arbitrage trade is to sell the basis—that is, sell the cash bond and sell protection on the same reference name. We would do this if we expect the basis to converge or narrow.
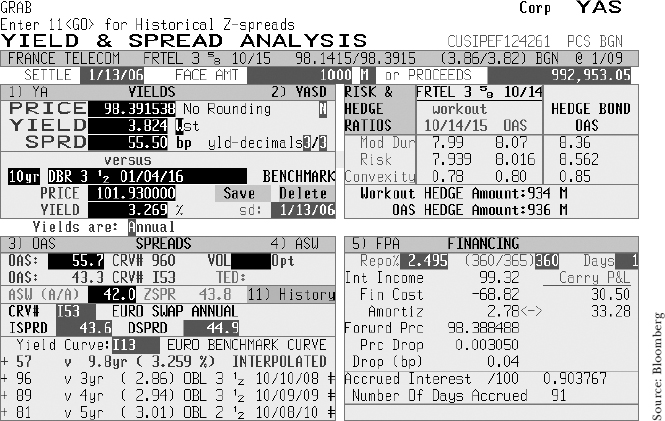
To illustrate this, we describe an example of a basis trade in France Telecom. The cash side of the trade is a euro-denominated bond issued by France Telecom, the 3.625% 2015, rated A3/A−, and which is trading on December 8, 2005, as follows:6
| Bond | France Telecom 3.625% 2015 |
| ISIN | FR0010245555 |
| Maturity | October 14, 2015 |
| Price | 97.52–97.62 clean |
| ASW | 42.9 bps |
| Z-spread | 45.2 bps |
| CDS price | 77–87 bps (10-year CDS) |
| Repo rate | 2.06–2.02 (Libor minus 35 bps) |
FIGURE 6.3 Asset-swap spread on screen ASW, France Telecom 3.625 % 2015 bond, December 9, 2005

FIGURE 6.4 Cash-CDS basis for France Telecom, December 9, 2005
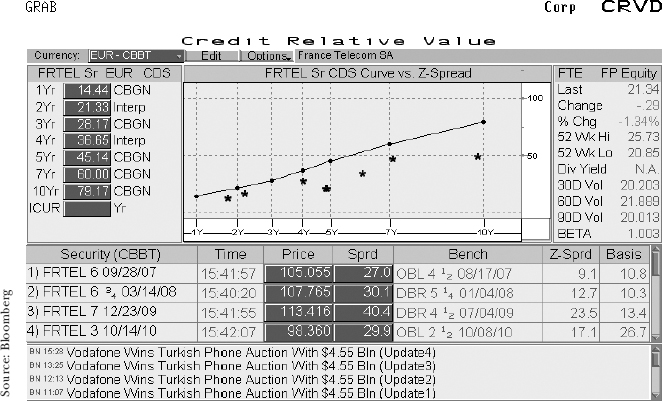
The asset-swap spreads can be seen in FIGURE 6.3 (they are slightly different from the levels quoted above because the screens were printed the next day and the market had moved). This is Bloomberg screen ASW for the bond. The basis for this bond is positive, as shown in FIGURE 6.4, which is Bloomberg screen CRVD.
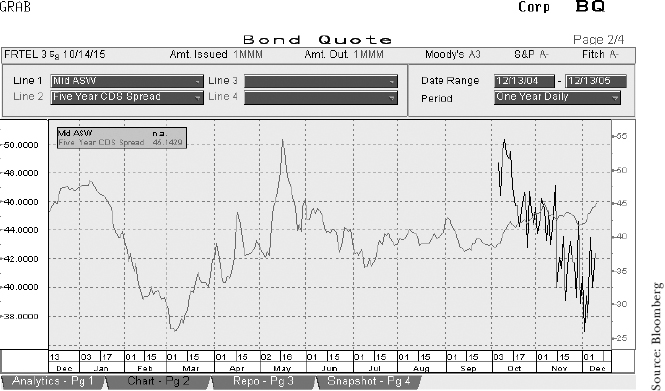
From the above, we see that the basis is (77 − 45.2), or +31.8 basis points. If we have the view that the bond will underperform, or that the basis will otherwise narrow and go toward zero and/or negative, we will sell the basis. We consider historical data on the basis during our analysis, as shown in FIGURE 6.5, which is from screen BQ and shows the 1-year historical ASW spread against the 5-year CDS spread.7
FIGURE 6.5 1-year historical CDS-ASW spread, France Telecom, December 2005
The trade is put on in the following terms:
- Sell EUR 6 million nominal of the bond at 97.52 clean price, 98.1158 dirty price.
- Sell protection EUR 5.85 million notional CDS at 77 bps.
Because we are shorting the bond, we fund it in reverse repo, which is done at 2.02%, or Libor minus 35 bps.
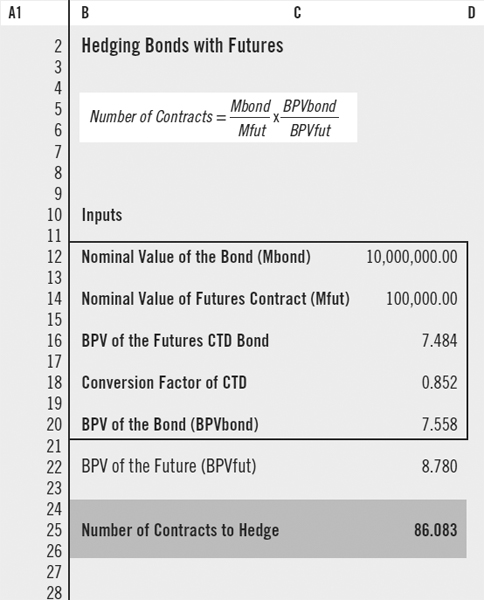
The credit risk on the bond position is hedged using the CDS. The interest-rate risk (DV01) is hedged using Bund futures contracts. The hedge calculation is a straightforward one, and uses the ratio of the respective DV01 of the bond and futures contract; see Choudhry (2005) for the hedge calculation mechanics.8 From this, we determine that we need to buy 52 lots of the Bund future to hedge the bond position.
TABLE 6.3 Futures hedge calculation spreadsheet
Source: © Stuart Turner. Reproduced with permission.
For readers' reference, we show the DV01 hedge calculation in TABLE 6.3, which is the Excel spreadsheet used to determine the futures hedge.9 Note that the example shown is for a hypothetical hedge, not our specific example—we show it here for instructional purposes. TABLE 6.4 shows the Excel formulas.
TABLE 6.4 Table 6.3 showing Microsoft Excel formulas
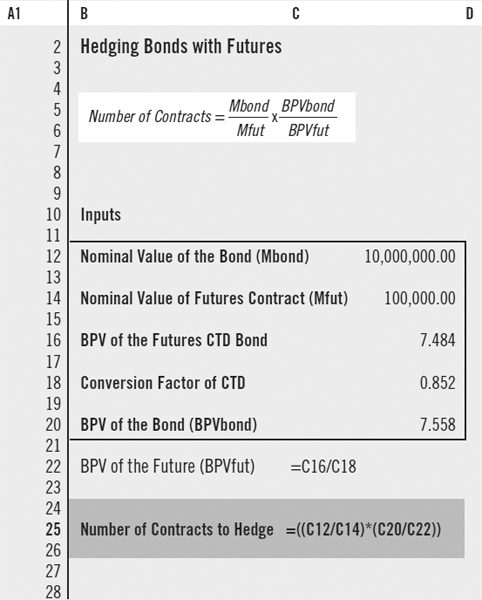
Source: © Stuart Turner. Reproduced with permission.
The analysis is undertaken with reference to Libor, not absolute levels such as the yield-to-maturity. The cash flows are:
| Sell bond: | pay 42.9 bps |
| Sell protection: | receive 77 bps |
In addition, the reverse repo position is 35 bps below Libor. Because it represents interest income, we consider this spread a funding loss, so we incorporate this into the funding calculation; that is, we also pay 35 bps. We ignore the futures position for funding purposes. This is a net carry of
![]()
or −15.9 basis points. In other words, the net carry for this position is negative. Funding cost must form part of the trade analysis. Funding has a greater impact on the trade net p&l the longer it is kept on. If the trade is maintained over 1 month, the funding impact will not be significant if we generated, say, 5 bps gain in the basis, because that is 5 bps over a 10-year horizon (the maturity of the bond and CDS), the present value of which will exceed the 15.9 bps loss on 1 month's funding. If the position is maintained over a year, the impact of the funding cost will be greater.
Position After 1 Month
On January 10, 2006, we record the following prices for the France Telecom bond and reference name:
| Bond | France Telecom 3.625% 2015 |
| Price | 98.35–98.45 |
| ASW | 42.0 bps |
| Z-spread | 43.8 bps |
| CDS price | 76–80 bps |
Spreads are shown in FIGURE 6.6.
To unwind this position, we would take the other side of the CDS quote, so the basis is now at (80 – 43.8), or 36.2 basis points. In other words, it has not gone the way we expected, but has widened. Because we sold the basis, the position has lost money if we unwind it now. The decision to unwind would be based on the original trade strategy: if the trader's time horizon was 6 months or longer, then the decision may be made to continue holding the position. If the trader's time horizon was shorter, it is probably sensible to cut one's losses now. Note that this trade is running at negative net carry, so it incurs a carry loss if maintained, irrespective of where the basis is going.
FIGURE 6.6 France Telecom bond YAS page for asset-swap and Z-spreads, January 10, 2006
Negative Basis Trade
In general, it is more common to observe a positive basis than a negative basis, for most market sectors. That said, negative basis observations are not uncommon. In the event of a negative basis condition, the potential arbitrage is to buy the basis—that is, to buy the bond and buy protection on the same reference name. We illustrate such a trade here.
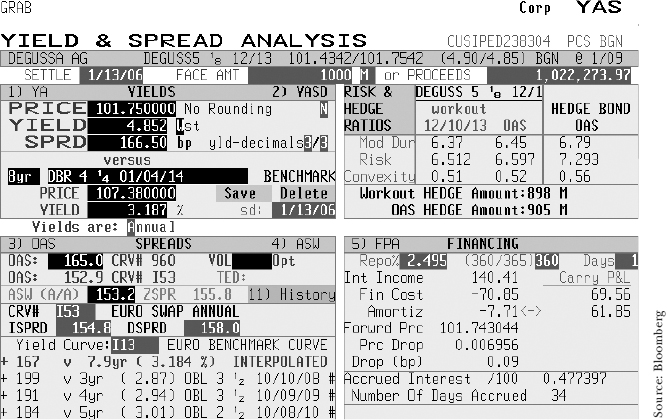
The bond identified here was observed as trading at a negative basis on December 8, 2005. It is the Degussa AG 5.125% of December 2013, which is a euro-denominated bond rated Baa1/BBB+. Its terms are as follows:
FIGURE 6.7 Degussa 5.125% 2013 bond, asset-swap page, December 9, 2005

| Bond | Degussa AG 5.125% |
| December 2013 | |
| ISIN | XS0181557454 |
| Maturity | December 10, 2013 |
| Price | 103.68 |
| ASW | 121.6 |
| Z-spread | 122.7 |
| CDS price | 5-year: 75–80 |
| 7-year: 95–105 | |
| 10-year: 113–123 | |
| Interpolated 8-year offer: 111 bps | |
| Repo rate | 2.44% (Libor + 2) |
These rates are seen in FIGURE 6.7, the ASW page for this bond, while the basis and basis history are seen in FIGURES 6.8 and 6.9, respectively. The basis is (111 − 122.7), or −11.7 basis points. We expect the basis to widen—that is, move from negative toward zero, and then into positive territory. We therefore buy the bond, and buy protection on the Degussa name. The interest-rate hedge is put on in the same way as before; again, we weight the CDS notional amount to match the risk of the bond because the bond is trading away from par, and so a greater amount of CDS notional is required.
FIGURE 6.8 Cash-CDS basis, Degussa AG, December 9, 2005
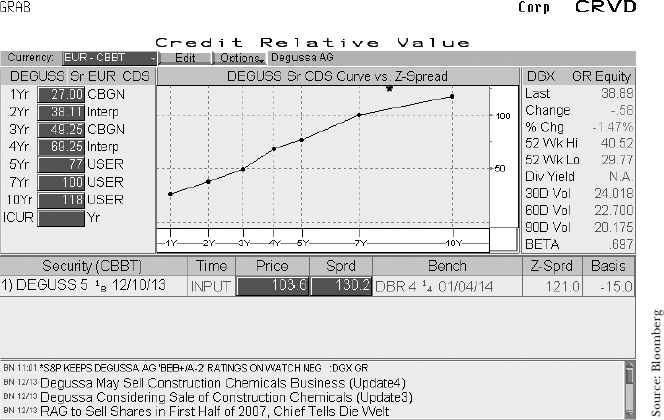
FIGURE 6.9 1-year CDS-ASW spread, Degussa AG, December 9, 2005
The trade cash flows are as follows:
| Buy bond | receive 121.6 bps |
| Buy protection | pay 111 bps |
| Repo | pay 2 bps |
This is a net carry of +8.6 bps, so this trade runs at a funding gain each day. We expect the basis to widen, at which point we will unwind the trade to extract our profit.
Position After 1 Month
On January 10, 2006, we record the following prices for the Degussa bond and reference name:
| Bond | Degussa AG 5.125% |
| December 2013 | |
| Price | 101.75 |
| ASW | 153.2 bps |
| Z-spread | 155.8 bps |
| CDS price | 152–162 |
Spreads are shown in FIGURE 6.10.
The basis is (152 − 155.8), or –3.8 basis points, that is, it has become less negative. The basis has widened, as we expected, and is now in profit. The p&l is positive, and is (−11.7 − (−3.8)), or 7.9 basis points, together with the funding gain accrued each day. We can unwind the trade to take profit now—or continue to run it, at a net positive carry, if we expect the basis to move further in the same direction, and then into positive territory.
FIGURE 6.10 Asset-swap and Z-spreads for Degussa bond, January 10, 2006
Notice how the gain itself is small, just a few basis points. Arbitrage basis trading in government bonds is often undertaken in very large size for precisely this reason, because the small potential gain means that to make the trade worthwhile, we have to deal in size. This is not always possible in corporate markets because of smaller issue sizes and lower liquidity levels in the cash market.
EXAMPLE 6.1 Negative Basis Trade: British Airways PIC
In this example, we illustrate an unusual example of a reference name trading at large negative basis. The reference name is British Airways PLC, which was experiencing credit downgrade issues during 2005—both general issues relevant to its (airline) sector, and specific issues associated with its passenger performance and industrial relations. An observation of the negative basis spread, which widened considerably in a short time, suggested that the spread would narrow again (heading toward positive territory) over the next 3 to 6 months.
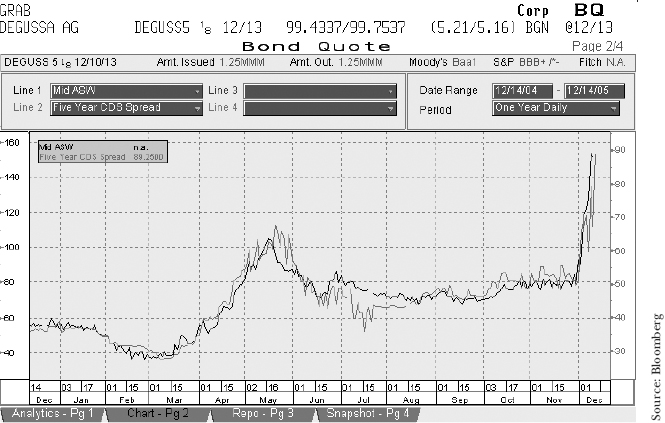
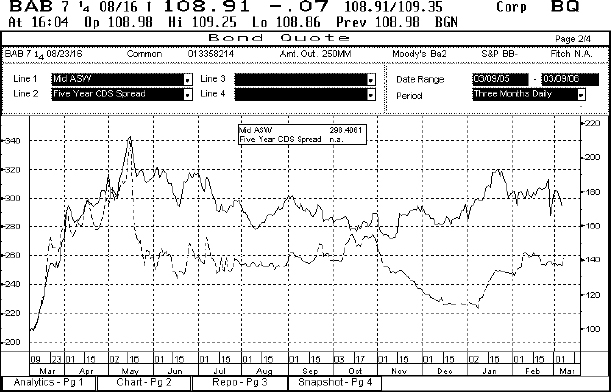
Accordingly, a negative basis trade was considered an appropriate trade. Details of the bond being purchased, the 7.25% of August 2016, are shown in FIGURE 6.11. The performance of the basis in the 3 months preceding the trade start date is given in FIGURE 6.12, which is screen BQ from the BLOOMBERG PROFESSIONAL® service and shows the CDS-ASW spread during this time. Note how the basis, already negative, moves into greater negative territory quite quickly in early May 2005.
FIGURE 6.11 Bloomberg page DES for British Airways 7.25% 2016 bond
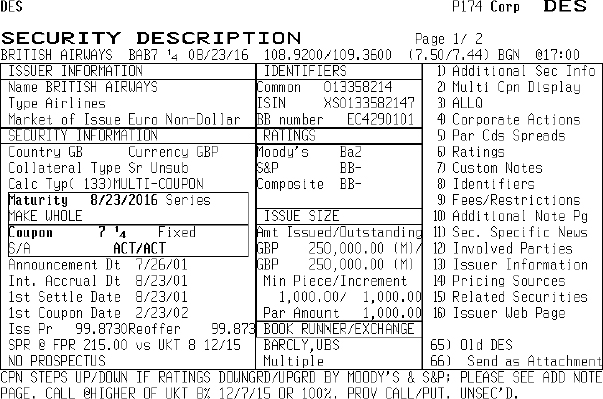
Source: Bloomberg
FIGURE 6.12 BA bond CDS-ASW basis performance, March 2005–May 2005

Source: Bloomberg
FIGURE 6.13 BA bond CDS-ASW basis performance, March 2005–Octoher 2005
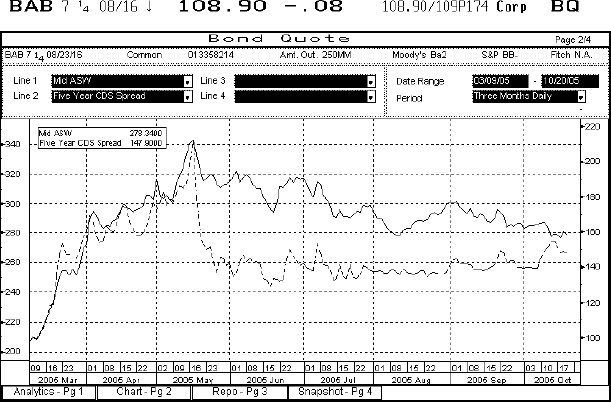
Source: Bloomberg
FIGURE 6.14 BA bond price performance, March 2005–Octoher 2005
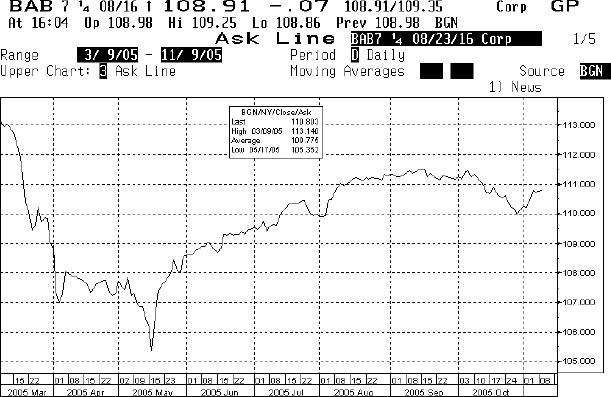
Source: Bloomberg
The trade is put on May 18, 2005, at the following terms:
- Buy £5 million BAB 7.25% 2016 bond
- Price £106.41 (yield 7.878%)
- Buy CDS protection £5 million notional
The CDS spread is 180 basis points (bps). At the ASW spread of 332.58, this represents a basis of −152 bps. On October 17, 2005, we unwind the trade. The price of the bond is now £110.43 (yield is 7.337%), and the CDS spread is 152.6 bps. At an ASW spread of 278.8 bps, this represents a basis of −126 bps. So the profit on this trade is 26 bps.10
FIGURE 6.13 shows the basis performance from the trade start date to the trade unwind date. We note how the spread has narrowed—as predicted—during the trade term. FIGURE 6.14 shows the bond price performance, while FIGURE 6.15 shows how the basis has behaved since the trade was unwound: note how it widened out again in March 2006, the time of writing.
FIGURE 6.15 BA bond CDS-ASW basis performance, March 2005–March 2006
Source: Bloomberg
The funding considerations followed those described earlier when we discussed the ThyssenKrupp bond. The bond was funded at Libor-flat, so there is no price impact either way on the funding side. This reflects that all analysis is conducted relative to Libor-flat. Because, in this case, the funding is at L-flat, there is no impact. The interest-rate hedge can be carried out with futures contracts, the benchmark bond (in this case gilts), or with an interest-rate swap. With a swap to matched maturity, we would pay fixed to receive floating, which would be Libor-flat. If we hedge with futures, there are no funding issues. If we hedge with a gilt, we need to note the reverse repo rate applicable on the gilt, in case it goes special during the term of the trade. If it does not, then the gain on lending funds against gilts will be matched on the other side in what we pay out for shorting the gilt—both rates will be at sub-Libor and should have no impact. In the actual case of this bond, the hedge was undertaken with a matched-maturity interest-rate swap.
FIGURE 6.16 Bloomberg screen RRRA, repo funding of BA bond at libor-flat
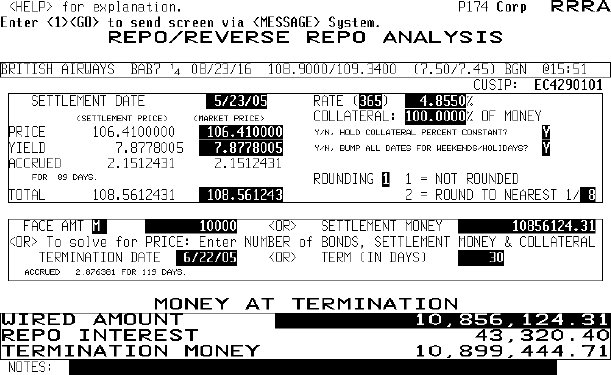
Source: Bloomberg
Finally, FIGURE 6.16 shows the Bloomberg screen RRRA, used to calculate cash flows when we fund the BA bond in repo. The trade was funded at 1-month intervals in repo.
Conclusion
The trades we describe illustrate the mechanics for CDS basis trades, both positive and negative basis. We saw how an arbitrage gain can be made, at theoretically zero credit risk, by buying or selling the basis, provided our initial view is correct. Opportunities for basis trading are rare, and often require good market intelligence on specific corporate names, which can be used to formulate views on these names. Hence, an expertise in credit analysis is essential. In addition, liquidity levels in the cash Eurobond market can be low, depending on the name, and should therefore also be considered when formulating the trade idea.
References
Choudhry, M. 2004a. Structured credit products: Credit derivatives and synthetic securitisation. Singapore: John Wiley & Sons.
_____. 2004b. Fixed income markets: Instruments, applications, mathematics. Singapore: John Wiley & Sons.
_____. 2005. Corporate bond markets: Instruments and applications. Singapore: John Wiley & Sons.
1. The trades described here are not pure arbitrage trades, because they are not completely risk free. This is discussed in the section on hedging and risk.
2. Throughout this book, we have referred to the CDS “spread” when a more accurate term would be “premium” or “fee.” The CDS spread is not a spread over anything, but more simply a fixed price quoted in basis points. However, market common practice is to refer to the CDS “spread” in the same way as we refer to an asset-swap spread, which is a spread over Libor, so we continue the practice here.
3. Names such as the World Bank or U.S. agency securities trade at sub-Libor in the cash market, so additional analysis is required to determine basis trade profit potential.
4. This is the risk that the relative spread of cash assets to Libor or the swap rate changes. One instrument that can be used to hedge spread risk is the LIFFE Swap-Note contract. For details of this derivative, see Choudhry (2004a, 2004b).
5. See Chapter 2 for a description of the different ways to measure the basis and an example of a Z-spread calculation.
6. Prices are taken from the BLOOMBERG PROFESSIONAL® service (bond and repo) and market makers (CDS).
7. Our view on where the basis is going may be based on any combination of factors; these can include speculation about future direction based on historical trade patterns, specific company intelligence such as expectations of a takeover or other buyout, views on credit quality, and so on. We do not discuss the rationale behind the trades in this book, which are the personal view of the individual trader, merely the trade mechanics!
8. The hedge calculation is based on a ratio of basis-point values (DV01) of the bond to be hedged and the futures contract. See Tables 6.3 and 6.4 for the calculation spreadsheet.
9. The hedge spreadsheet was written by Stuart Turner and is reproduced with permission.
10. This is gross profit, before factors such as bid-offer spread and hedge costs are taken into account.