Chapter 6. Building a Basic Report
This chapter discusses using SQL Server Data Tools 2014 Business Intelligence (SSDT-BI) for Visual Studio 2013 and shows how to create a new project to build a basic report. Chapter 1, “Installing SQL Server Reporting Services,” discussed installing the SSDT-BI tool, which is used to demonstrate creating reports throughout this book. This chapter steps through creating a basic report. It describes the available report items, how to change item property values, and how to add page header and footer sections. It also discusses the basic settings to use when adding a table to display query data within a report. You will learn how to customize a report based on the recommended concepts discussed in Chapter 5, “Basic Report Design,” to present a simple and professional look. Chapter 7, “Intermediate Report Concepts,” dives further into these concepts, showing you how to add additional complex features, including prompts, charts, and actions.
The authors are often asked whether the preferred tool for building SQL Server Reporting Services (SSRS) reports is SSDT-BI or Report Builder. Table 6.1 compares the capabilities of these two tools and shows that SSDT-BI is a more feature-rich tool that allows you to work on multiple reports at once. These are the basic differences:
![]() SSDT-BI works best when you intend to create many reports and want to keep them organized and easily accessible.
SSDT-BI works best when you intend to create many reports and want to keep them organized and easily accessible.
![]() Consider Report Builder if you only plan to quickly create several reports with basic features. This tool has a familiar style, and you use it much the way you use Microsoft Office products, such as Microsoft Word.
Consider Report Builder if you only plan to quickly create several reports with basic features. This tool has a familiar style, and you use it much the way you use Microsoft Office products, such as Microsoft Word.

You should note that there are multiple versions of report authoring tools available, including several versions of SSDT-BI and Business Intelligence Development Studio (BIDS), as well as multiple versions of the Report Builder tool. Understanding report compatibility for the different versions of Reporting Services can be challenging. Table 6.2 identifies the different SSRS versions and the compatible Report Definition Language (RDL) generated from the various tools. It is important to create reports using a tool that generates files supporting the installed SQL Server Reporting Services version in your environment.

Tip: Authoring Tool Recommended Version
The authors recommend installing the highest version of SSDT-BI or BIDS that supports the lowest version of SQL Server Reporting Services in your environment. This book uses SSDT-BI 2014 for Visual Studio 2013 and SQL Server 2014 Reporting Services.
Don’t be concerned if you are using a different version. You can still follow along, but you should be aware that the tools may look slightly different, and some options or items may not be in exactly the same locations as demonstrated in this chapter.
Creating a Project
Before creating your first report in SQL Server Data Tools 2014 Business Intelligence (referred to as SSDT-BI from here on) for Visual Studio 2013, you must create a new project. All the reports inside a project can use common settings, such as a shared data source to connect to the Configuration Manager (ConfigMgr) database. In addition, a project establishes a common folder to store your created reports and provides a simple, organized view of all the reports you create from within Solution Explorer in Visual Studio.
In this section you will create a project for a fictional company named SSRS US. Perform the following steps to create this new project:
1. From the Windows Start menu, navigate to Microsoft SQL Server 2014 -> SQL Server Data Tools for Visual Studio 2013.
2. On the Microsoft Visual Studio Start Page, click File -> New -> Project (see Figure 6.1) to create a new project.

3. In the New Project dialog, shown in Figure 6.2, select Report Server Project from among the Business Intelligence templates. At the bottom of the dialog box, enter a name for the project (which automatically populates the Solution name field) and specify a location to store the project.

Notice that the Create directory for solution check box is checked by default. This option creates a folder in the location you have specified that will contain the project files, configuration, and reports. Click OK to create the project.
Tip: Recommended Project Location
The authors recommend storing a project on a network share where all ConfigMgr administrators and report creators can access the project. This enables sharing of already created reports as well as report templates among all report creators.
The authors also suggest including this network share in any backup solution available to ensure that it is recoverable if the data is lost or corrupted.
4. Once the project is created, add a new shared data source. In the Solution Explorer, on the top right-hand side of the Visual Studio page, right-click Shared Data Sources and select Add New Data Source, as shown in Figure 6.3.

5. On the Shared Data Source Properties dialog, specify a Name for the shared data source and configure a connection string by clicking Edit.
6. In the Connection Properties dialog, specify the server name of the SQL Server that contains the ConfigMgr database and then, using the dropdown, specify the ConfigMgr database name under the Select or enter a database name field, as shown in Figure 6.4. Click Test Connection to ensure that the connection is successful and then click OK to close the Connection Properties dialog.

7. Confirm that the settings in the Shared Data Source Properties dialog (see Figure 6.5) are correct and click OK.

Creating a Basic Report
Now that you have created a project, you can start creating your own reports. Going forward, to access any reports created using this project, you can simply launch SSDT-BI and open the saved project. All your settings will be restored, and your reports will be listed and available from the Reports folder in the Solution Explorer.
Building on the steps in the previous section, this section walks through the basics of creating a new report using SSDT-BI. Follow these steps:
1. In the Solution Explorer section, on the far right side of SSDT-BI, right-click the Reports folder and select Add -> New Item, as shown in Figure 6.6.

2. In the Add New Item dialog, shown in Figure 6.7, select Report from the list of items, specify a name for the report (such as Patch Compliance Progression), and click Add.

You now have a new blank report. As Figure 6.8 shows, the center section of SSDT-BI now contains the new blank report, ready to be populated.

Creating a Data Source
Before adding report items such as tables or charts, you must add a data source to a report. The data source is the connection information to the ConfigMgr database, indicating where the report gets its information. Perform the following steps to add a data source for your ConfigMgr database:
1. In the Report Data section on the left side of SSDT-BI, right-click the Data Sources folder and select Add Data Source, as shown in Figure 6.9.

2. In the Data Source Properties dialog, as shown in Figure 6.10, specify a name for the data source and select Use shared data source reference. From the dropdown, select the shared data source added in the “Creating a Project” section of this chapter (for example, SSRS US) and click OK.

Creating a Dataset
A dataset is an actual query used to get data for a report. Creating a query in SQL Server Management Studio allows you to quickly see the specified columns and results and to easily make any necessary changes to the query before creating a full report and running it in SSDT-BI. Once you are satisfied with your query and the results, simply copy it from SQL Server Management Studio and paste it in the Query field of the dataset, as demonstrated in this section. Follow these steps:
1. From the Report Data section on the left side of SSDT-BI, right-click the Datasets folder and select Add Dataset, as shown in Figure 6.11.

2. In the Dataset Properties dialog, as shown in Figure 6.12, specify a name for the dataset and select Use a dataset embedded in my report. For the Data source field, select the data source you created in the “Creating a Data Source” section of this chapter. In the Query field, paste the query previously created in SQL Server Management Studio. This example uses the query shown in Listing 6.1, patchcompliance.sql, which is included as online content for this book for your convenience (see Appendix C, “Available Online”). Then click OK to create the dataset.

LISTING 6.1 Patch Progression Query
SELECT Distinct
CS.Name0,
CS.UserName0,
CASE
When (sum(case when UCS.status=2 then 1 else 0 end))>0 then
('Needs '+(cast(sum(case when UCS.status=2 then 1 else 0 end)
as varchar(10))+ ' Patches'))
Else 'Good Client'
End as 'Status',
ws.lasthwscan as 'Last HW scan'
FROM
v_UpdateComplianceStatus UCS
LEFT OUTER JOIN dbo.v_GS_COMPUTER_SYSTEM CS on CS.ResourceID = UCS.ResourceID
JOIN v_CICategories_All catall2 on catall2.CI_ID = UCS.CI_ID
JOIN v_CategoryInfo catinfo2 on catall2.CategoryInstance_UniqueID =
catinfo2.CategoryInstance_UniqueID and
catinfo2.CategoryTypeName = 'UpdateClassification'
LEFT JOIN v_gs_workstation_status ws on ws.resourceid = CS.resourceid
LEFT JOIN v_fullcollectionmembership FCM on FCM.resourceid = CS.resourceid
WHERE
UCS.Status = '2'
and FCM.collectionid = 'SMS00001'
GROUP BY
CS.Name0,
CS.UserName0,
ws.lasthwscan,
FCM.collectionID
ORDER BY
CS.Name0,
CS.UserName0
Once the dataset is created, notice that all the columns returned from the query are listed below the dataset name (PatchDataset), as shown in Figure 6.13. The columns of the dataset will be used in report items that are added to the report. This is explained further in the “Adding a Table to a Report” section, later in this chapter.

Setting the Size of a Report
As discussed in Chapter 5, when you’re considering the size of a report, it generally is more important to pay attention to the width of the report than to the height. If a report spans multiple pages in height, it is easy to follow as the data flows down onto a second page, much as when you’re reading a document. However, if the report spans multiple pages in width, when viewed in a browser or printed on paper, it becomes difficult to follow the data across multiple pages.
Tip: Enabling the Ruler in SSDT-BI
Turning on the taskbar’s ruler in SSDT-BI helps you see the size of the report. This also helps you identify whether items will fall outside the page margins.
To turn on the ruler, click the ruler icon, as indicated by the arrow in Figure 6.14.

Follow these steps to configure the report size and margins to fit on an 8.5×11-inch sheet of paper:
1. From the Properties section, on the bottom-right side of SSDT-BI, select the Body property from the dropdown and expand the Size node.
2. Under the Size node, set the Width value to 8in, as shown in Figure 6.15. This allows for a total half-inch margin between the left and right sides of your report.

Note: The SSDT-BI Properties Section
Most objects in SSDT-BI can be adjusted or customized by editing their property values using the SSDT-BI Properties section. As your selections change to different items in a report, notice that the available properties change for the specific item that is selected.
Accessing Report Items
Report items, much like tables, charts, and text boxes, are available under the Toolbox menu by the Report Data section on the far left side of SSDT-BI. By default, the Toolbox menu is automatically hidden when not in use, and it is displayed only when you click on the tab shown in Figure 6.16. If you prefer to always have the Toolbox menu visible, showing the available report items, simply click the pin icon highlighted in Figure 6.17.


As Figure 6.17 shows, there are many report items you can add to a report. The following are the various items, with a brief description of the use of each one within a report:
![]() Pointer: The pointer is the default selected item in SSDT-BI. This is the simple mouse pointer that allows you to select items in a report.
Pointer: The pointer is the default selected item in SSDT-BI. This is the simple mouse pointer that allows you to select items in a report.
![]() Textbox: This item allows you to enter simple text into a report, such as a label, or specify expressions to be populated when the report is executed (for example, the current date or page number).
Textbox: This item allows you to enter simple text into a report, such as a label, or specify expressions to be populated when the report is executed (for example, the current date or page number).
![]() Line: The line item adds a simple line to a report for visual effect. It can be used to separate sections or information.
Line: The line item adds a simple line to a report for visual effect. It can be used to separate sections or information.
![]() Table: The table item is similar to an Excel spreadsheet. In an SSDT-BI table, you can group data together, identify header columns and rows, and more. Tables are some of the most popular items used in reporting.
Table: The table item is similar to an Excel spreadsheet. In an SSDT-BI table, you can group data together, identify header columns and rows, and more. Tables are some of the most popular items used in reporting.
![]() Matrix: A matrix is a special type of table, similar to a pivot table in Microsoft Excel. Data in a matrix can be grouped together and can grow both by columns and rows.
Matrix: A matrix is a special type of table, similar to a pivot table in Microsoft Excel. Data in a matrix can be grouped together and can grow both by columns and rows.
![]() Rectangle: The rectangle item allows you to group other report objects together and treat them as a single object within a report.
Rectangle: The rectangle item allows you to group other report objects together and treat them as a single object within a report.
![]() List: A list is a grouping of report items. It allows you to add items from other reports within the list and display them in free form rather than within a grid.
List: A list is a grouping of report items. It allows you to add items from other reports within the list and display them in free form rather than within a grid.
![]() Image: The image item allows you to import images or pictures into a report. This item is commonly used to display a company logo in the header or footer section of a report.
Image: The image item allows you to import images or pictures into a report. This item is commonly used to display a company logo in the header or footer section of a report.
![]() Subreport: This item allows you to embed another report within the current report. The body section of the targeted report is displayed within this item when the report is executed.
Subreport: This item allows you to embed another report within the current report. The body section of the targeted report is displayed within this item when the report is executed.
![]() Chart: This item creates a chart within a report to represent your data. Various types of charts can be selected, such as bar, line, pie, or pyramid charts. Charts are further explained and demonstrated in Chapter 7.
Chart: This item creates a chart within a report to represent your data. Various types of charts can be selected, such as bar, line, pie, or pyramid charts. Charts are further explained and demonstrated in Chapter 7.
![]() Gauge: The gauge item can display a value, an expression, or a field in either a radial or linear type of gauge. Gauges are similar to charts; however, they are intended to display summary data.
Gauge: The gauge item can display a value, an expression, or a field in either a radial or linear type of gauge. Gauges are similar to charts; however, they are intended to display summary data.
![]() Map: This item allows you to display data against a map. There are two types of map charts:
Map: This item allows you to display data against a map. There are two types of map charts:
![]() A marker map allows you to pinpoint a location.
A marker map allows you to pinpoint a location.
![]() A bubble map shows the number of items for a given area.
A bubble map shows the number of items for a given area.
![]() Data Bar: This item displays a visual indicator of a value. It tends to be used within a table item.
Data Bar: This item displays a visual indicator of a value. It tends to be used within a table item.
![]() Sparkline: Much like a data bar, a sparkline is often used within a table. This is a miniature line chart without any labels.
Sparkline: Much like a data bar, a sparkline is often used within a table. This is a miniature line chart without any labels.
![]() Indicator: An indicator is similar to a gauge; it displays minimal information so that at a quick glance, a user can determine the value that is represented. In most cases, indicators are used in tables.
Indicator: An indicator is similar to a gauge; it displays minimal information so that at a quick glance, a user can determine the value that is represented. In most cases, indicators are used in tables.
Adding a Table to a Report
To display the results of a query (dataset), you need to add a table to your report. Then, within the table, you can add the individual columns you want to display. When the report is executed, the query results populate the table item. Follow these steps to add a table and populate the query columns of the report:
1. From the toolbox, drag the table item to the blank report. Notice that by default the table item is created with three columns, as shown in Figure 6.18. You must add another column to the table to display all four columns from your dataset.

2. To add a fourth column to the table, right-click the last (in this case third) column and select Insert Column -> Right, as shown in Figure 6.19.

3. Now add the dataset to the table. Under the Report Data section, expand the Datasets folder and expand the dataset you created (in this case, PatchDataset). Drag each column from the dataset into the corresponding column in the table. When complete, your table should look like the one shown in Figure 6.20.

4. With the dataset added to the table item, you can properly format the table. To do so, make the following changes to the table:
![]() Modify the labels of the headers in the first row to add appropriate titles that represent the data. Accomplish this by double-clicking the cell and replacing the current text (
Modify the labels of the headers in the first row to add appropriate titles that represent the data. Accomplish this by double-clicking the cell and replacing the current text (Name0, UserName0, Status, and Last_HW_scan).
![]() Set the font style of the header row to bold.
Set the font style of the header row to bold.
![]() Adjust the widths of the table columns so that the data is well displayed. Avoid cutting off information or having the row expand vertically to fit the data output.
Adjust the widths of the table columns so that the data is well displayed. Avoid cutting off information or having the row expand vertically to fit the data output.
![]() Adjust the table size to have it stretch the width of the entire page; however, ensure that doing this does not affect the width of the page. The page width should not exceed 8in.
Adjust the table size to have it stretch the width of the entire page; however, ensure that doing this does not affect the width of the page. The page width should not exceed 8in.
Figure 6.21 shows the table with these changes made.

Previewing a Report
Once you have finished making adjustments to your report, click Preview (highlighted in Figure 6.22) at the top of the report to view the end product. Figure 6.23 shows a preview of the report. Previewing a report executes the query in the dataset and populates the report items with data.


Ensure that everything displays as intended and that the columns are appropriate widths, such that no information is cut off or missing. If additional changes are required after previewing your report, make any necessary adjustments and preview your report again to ensure that those issues are resolved. To return to Design mode after you finish previewing, simply click Design at the top of the report.
Customizing a Report
At this point, you have a report with a dataset and a table item to return the query results. The output is still a very simple report without color, customization, or company branding. You can now customize the report by adding some color to the table, adding interactive sorting on the table columns, and creating header and footer sections with a company logo. These elements, discussed in the following sections, will help you create professional-looking reports.
Adding Background Color to Rows
To add visual appeal and help users identify important rows, such as the header, you can add background colors to the table. Adding a color to the header row helps draw attention to the table without overwhelming the report reader. Follow these steps to add a background color:
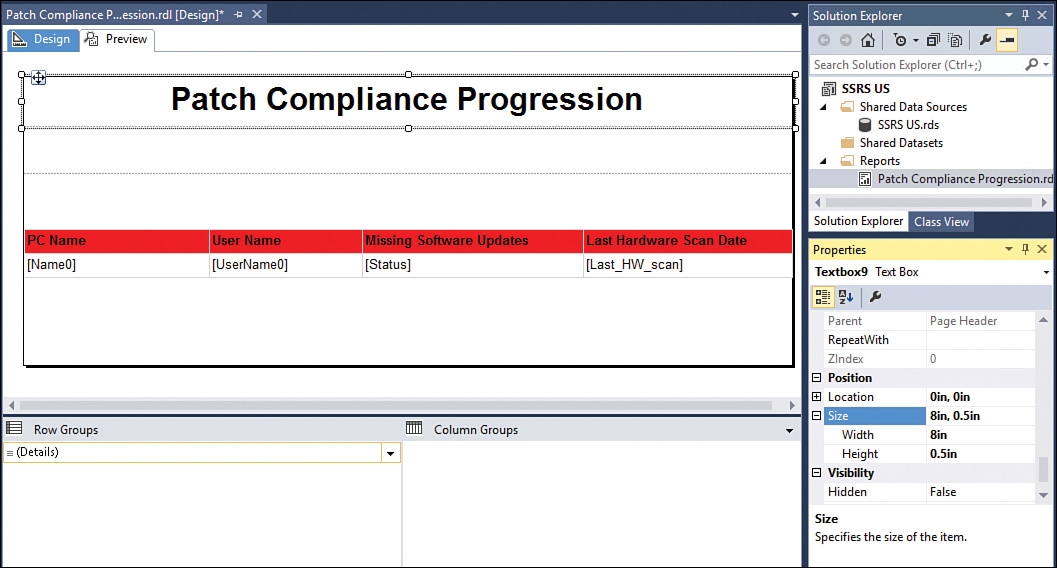
1. Highlight the header row of the table by selecting all cells in the first row. In the Properties section of the Solution Explorer, located in the bottom right of SSDT-BI, find the BackgroundColor property, as shown in Figure 6.24.

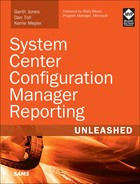
2. Click the dropdown next to the No Color value (see Figure 6.25) and select a color of your choice. The color Red is chosen for this example. The background color of the header row is now changed to the color red, as shown in Figure 6.26.

There are several options available in terms of choosing a color for an item that is outside the basic palette available from the property dropdown (displayed in Figure 6.25):
![]() Select the More Colors option and then select colors from defined palettes, select from color circles, or manually enter the RGB values.
Select the More Colors option and then select colors from defined palettes, select from color circles, or manually enter the RGB values.
![]() Select Expression and enter the color name (Red) or hexadecimal color value (#FF0000).
Select Expression and enter the color name (Red) or hexadecimal color value (#FF0000).
Alternating Data Row Colors
If you view your report in Preview mode (as previously shown in Figure 6.23), you might notice that it can be difficult to follow the data in each individual row. This most often occurs with large tables that contain multiple columns and rows. By default, there is no easy way to identify and follow a single row from beginning to end. While adjusting the background color is a good approach, if you have dozens—or even hundreds—of rows in a report, it would be far too time-consuming to manually alternate the background colors for all the rows. Thankfully, there is a built-in function called RowNumber that returns the current row count of a table. By combining this function with others, you can automatically have a report alternate the colors of the rows. Applying the expression shown in Listing 6.2 as the BackgroundColor value for the dataset row sets all odd-numbered rows to white and all even-numbered rows to silver. To apply this expression, follow these steps:
LISTING 6.2 Alternate Row Color Expression
=iif(RowNumber(Nothing) Mod 2, "White", "Silver")
1. Select the second row of the table. In the Properties section, located in the bottom right of SSDT-BI, find the BackgroundColor property. Click the dropdown next to the No Color value and select Expression.
2. In the Expression dialog, enter the expression from Listing 6.2 (and also shown in Figure 6.27) and click OK.

3. To ensure that the expression is properly set and working as intended, select Preview in the report and confirm that the data rows are alternating colors between white and silver. Notice the output in Figure 6.28. It is now much easier to read and follow the data for each individual row of the table.
Adding Interactive Sorting
A feature most report readers find very helpful is the ability to sort a table by individual columns while viewing the report. For example, you might want to be able to sort the report shown in Figure 6.28 by the Missing Software Updates column. You can add this functionality by enabling the interactive sorting feature. Unfortunately, this feature is not global for the entire table and must be set for each individual column where you want to add the ability to sort the data. Chapter 5 recommended enabling interactive sorting on every table column to provide the best experience for readers. To enable this feature, ensure that your report is in Design mode by selecting Design and then perform the following steps:
1. Right-click the header cell of the Missing Software Updates column and select Text Box Properties, as shown in Figure 6.29.

2. In the Text Box Properties dialog, select Interactive Sorting on the left side and click the Enable interactive sorting on this text box check box. In the Sort by dropdown box, select the appropriate column from the dataset. The [Status] column is selected for this example (see Figure 6.30), as this value corresponds with the Missing Software Updates data column. Click OK to apply these settings and close the dialog.

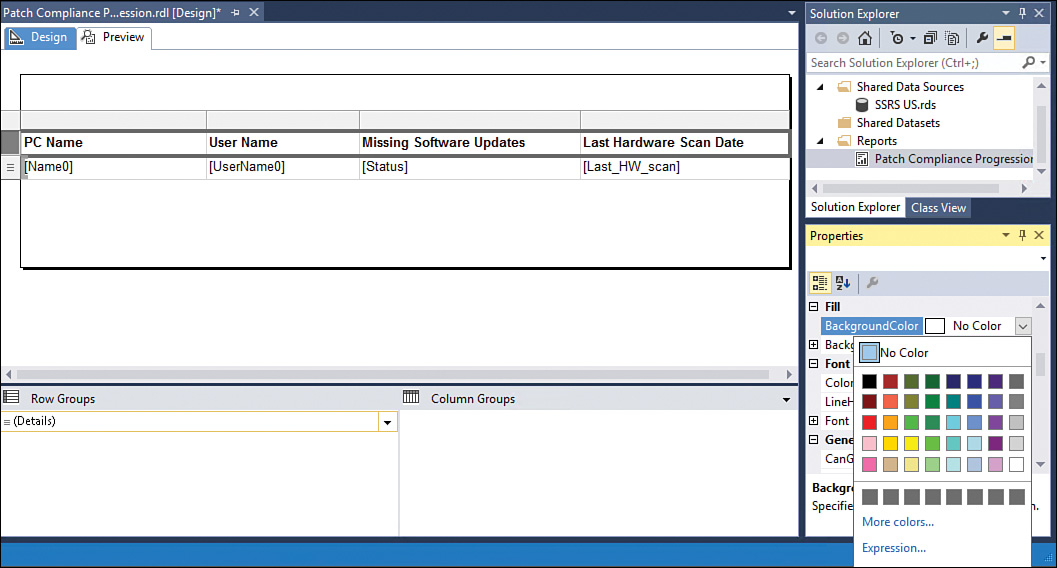
3. Select Preview to view the changes to the report and ensure that the interactive sorting feature is working properly. Notice that the sorting arrows now appear next to the Missing Software Updates column header shown in Figure 6.31. Click the sorting arrows and notice that you can now sort the data by the Missing Software Updates column, in alphabetical and descending order.

4. Repeat steps 1–3 to enable the interactive sorting feature on all columns of the table. When you are finished, preview the report to ensure that the sorting arrows appear for all columns, as shown in Figure 6.32.

Setting the Table Header Row to Repeat on All Pages
When using table items, you can set the header row to repeat on every page. This is a convenient feature for reports that contain a large number of rows that will span multiple pages. Repeating header rows allows the viewer to refer to the column names without having to go back and reference the first page of the report. Perform the following steps to set this behavior on the report:
1. Ensure that your report is in Design mode. Select the header row of the table and right-click the gray border cell to the left of the first column header cell. Click Tablix Properties, as shown in Figure 6.33.

2. In the Row Headers section, check the Repeat header rows on each page check box (shown in Figure 6.34). Click OK to apply the settings.

3. Preview the report. If there are multiple pages, view each page to confirm that the table header is shown on every page that contains rows from the table item.
Adding a Page Header to a Report
Page headers are displayed on each page of your report. You can use the header area to add details about your report. Items such as the report name help readers identify which report they are viewing, particularly when you add links to other reports. Follow these steps to add a header section to the report:
1. Ensure that your report is in Design mode. From the SSDT-BI toolbar, select the Report menu and click Add Page Header (as shown in Figure 6.35). The header section now appears in the Design mode of your report, as shown in Figure 6.36. The header and body sections are separated by a thin dotted line.


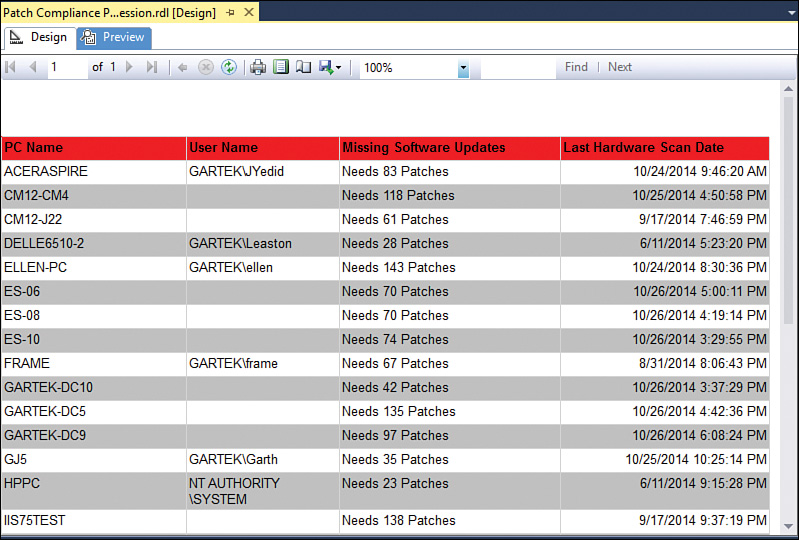
2. Begin populating the page header with a report title. From the toolbox, drag the text box item into the header section of the report. Double-click the text box item and type Patch Compliance Progression. Place the text box in the top-left corner of the page. Using the Properties section in the bottom-right corner of the screen, find and change the Size value to 8in, 0.5in. Change the font of the text box to Bold, set the font size to 24pt, and set the alignment to Center.
Modifying text formatting is simple in SSDT-BI and is performed in the same way as with other Microsoft Office products. The report should now look similar to the one displayed in Figure 6.37.
3. Modify the height of the page header by dragging the dotted line that separates the header and body sections upward until it is just under the report title text box. Drag the table item just below the separating line to minimize the wasted space in the report. These changes allow the most data to be displayed while reducing the number of pages generated.
4. Preview the report by clicking Preview to ensure that it displays and functions as expected, as shown in Figure 6.38.

Adding a Page Footer to a Report
Like the header, the page footer is repeated on every page of the report. This is a good area for including details such as the date the report was executed, the company logo, and the page number. The steps to add a page footer are almost identical to the steps for the page header:
1. Ensure that the report is in Design mode. From the SSDT-BI toolbar, select the Report menu and click Add Page Footer (as shown in Figure 6.39). The footer section now appears in the Design mode of your report, as shown in Figure 6.40. As with the header and body sections, the footer and body sections are now separated by a thin dotted line.


2. Add the date to the page footer of the report. To do this, from the toolbox, drag the text box item into the footer section of the report. Place the text box on the far left side of the page, double-click it, and enter the expression shown in Listing 6.3.
LISTING 6.3 Expression to Display the Date
="Printed on " & Today
3. Add the page number to the page footer of the report. To do this, from the toolbox, drag a second Text Box item into the footer section. Place this second text box item on the far-right side of the page, double-click it, and enter the expression shown in Listing 6.4. Set the font alignment to Right.
LISTING 6.4 Expression to Add the Page Number
=String.Format("Page {0} of {1}", Globals!PageNumber,Globals!TotalPages)
4. Reduce the height of the page footer by dragging the bottom of the report page upward. Because both the page header and footer sections are fixed sizes and will not grow, you are allowing for the maximum height to be used by the page body and reducing the number of pages generated.
5. Preview the report by clicking Preview to ensure that it displays and functions as expected. Figure 6.41 shows an example of a preview with the page footer.

Adding an Image to a Report
When creating reports, it is common to add company branding such as a company logo. This is a good way to add a unique, customized feel to your reports. You can place an image item anywhere in a report; however, for a more professional feel, the authors recommend adding an image with a company logo to either the page footer or header. This section demonstrates how to add a company logo to the page footer area of the report. Perform the following steps:
1. Ensure that your report is in Design mode. From the toolbox, drag the image item into the page footer of the report.
2. In the Image Properties page, as shown in Figure 6.42, enter a name for the image under the Name field and click Import. Browse to the appropriate location and select the image you want to add to the report and then click Open. Click OK to add the image to the report.

3. After adding an image, you often need to adjust the size and location of the image item. You can either stretch the image item directly by clicking and dragging the item’s edges or you can adjust the Size Width and Height values in the Properties section in the bottom right of the page.
4. When the image is the appropriate size, center it both horizontally and vertically in the page footer. To easily center an item, click the item to select it and then click the Center Horizontally and Center Vertically icons on the toolbar, as shown in Figure 6.43.

5. Preview the report to ensure that the image is displayed properly and will be the desired size when the report is executed.
Demonstrating Basic Report Creation
The purpose of this demonstration is to give you practice creating a project, creating basic reports, and customizing these items. You will create a new project and two separate reports in this demonstration. Each report will contain all the features discussed to this point. Follow the criteria required for each report and refer to previous sections of this chapter as required to complete the reports.
Creating a New Project
Create a new report server project in SSDT-BI. This project will be used for all further demonstrations in this book. Create the project using the following criteria:
![]() Create the project using the Report Server Project template.
Create the project using the Report Server Project template.
![]() Select a name of your choice for the project.
Select a name of your choice for the project.
![]() Set the project location to a folder on your local hard drive.
Set the project location to a folder on your local hard drive.
![]() Create a shared data source and connect it to your ConfigMgr database.
Create a shared data source and connect it to your ConfigMgr database.
Be sure to test the shared data source connection and ensure that it is successful before continuing to the next section, as this will be used for the remaining demonstrations in this book.
Creating a Patch Compliance Progression Report
Inside the project you created in the previous section, create a new report named Patch Compliance Progression and then add the following features:
![]() Create a dataset using the query shown in Listing 6.1, earlier in this chapter.
Create a dataset using the query shown in Listing 6.1, earlier in this chapter.
![]() Set the page width to 8 inches.
Set the page width to 8 inches.
![]() Include a page header with the report name centered on the page.
Include a page header with the report name centered on the page.
![]() Add a table item in the body of the report and ensure that it has the following features:
Add a table item in the body of the report and ensure that it has the following features:
![]() Give it four columns with the following header labels:
Give it four columns with the following header labels:
PC Name
User Name
Missing Software Updates
Last Hardware Scan Date
![]() Make the header row bold with a red background color.
Make the header row bold with a red background color.
![]() Have the data rows alternate background colors between white and silver.
Have the data rows alternate background colors between white and silver.
![]() Enable interactive sorting on every column.
Enable interactive sorting on every column.
![]() Add a page footer that contains the following items:
Add a page footer that contains the following items:
![]() The date of report execution on the left side of the page
The date of report execution on the left side of the page
![]() A logo in the center of the page
A logo in the center of the page
![]() The page number on the right side of the page
The page number on the right side of the page
![]() Create a shared data source and connect it to your ConfigMgr database.
Create a shared data source and connect it to your ConfigMgr database.
Be sure to preview your report once it is complete to confirm that all settings and features are functioning as intended and display properly on the page. You will use this report again in the next chapter to add advanced features and functionality.
Creating a Computer Hardware Information Report
Once again, inside the project you created in this demonstration, create a new report named Computer Hardware Information. Use SQL Server Management Studio to create a new query to get the required data before creating the report in SSDT-BI. Do the following for this report:
![]() Using SQL Server Management Studio, create a query to get the computer name, user name, make, model, and last hardware scan date for all systems in your environment.
Using SQL Server Management Studio, create a query to get the computer name, user name, make, model, and last hardware scan date for all systems in your environment.
![]() Hint: Turn to Chapter 3, “Understanding Configuration Manager Data,” to find the correct SQL views for getting this information. Note that
Hint: Turn to Chapter 3, “Understanding Configuration Manager Data,” to find the correct SQL views for getting this information. Note that WHERE statements are not required to get this data.
![]() Create a dataset using the query you created in SQL Server Management Studio.
Create a dataset using the query you created in SQL Server Management Studio.
![]() Set the page width to 8 inches.
Set the page width to 8 inches.
![]() Add a page header that contains the report name centered on the page.
Add a page header that contains the report name centered on the page.
![]() Add a table item in the body of the report and ensure that it has the following features:
Add a table item in the body of the report and ensure that it has the following features:
![]() Give it five columns with the following header labels:
Give it five columns with the following header labels:
PC Name
User Name
Make
Model
Last Hardware Scan Date
![]() Make the header row font bold with a background color of your choice.
Make the header row font bold with a background color of your choice.
![]() Have the data rows alternate background colors between white and silver.
Have the data rows alternate background colors between white and silver.
![]() Enable interactive sorting on every column.
Enable interactive sorting on every column.
![]() Add a page footer that contains the following items:
Add a page footer that contains the following items:
![]() Date of execution on the left side of the page
Date of execution on the left side of the page
![]() A logo in the center of the page
A logo in the center of the page
![]() The page number on the right side of the page
The page number on the right side of the page
![]() Create a shared data source and connect it to your ConfigMgr database.
Create a shared data source and connect it to your ConfigMgr database.
Be sure to preview your report once it is complete to confirm that all settings and features are functioning as intended and display properly on the page. You will build on this report in the demonstrations in Chapter 7.
Summary
This chapter has shown hands-on illustrations building on some of the basic design concepts discussed in Chapter 5. In this chapter you have learned about the multiple versions of tools available for creating new SSRS reports for ConfigMgr. This information should help you determine which tool is best for creating reports that will be compatible with the version of SSRS implemented in your environment.
Using the latest version of SSDT-BI for Visual Studio 2013, the chapter has demonstrated basic features, including how to create a new project and shared data sources and how to create new reports within a project. The chapter has covered available report items and demonstrated creating a dataset for a table item. It has discussed core features of reports, such as the page header, footer, size, and some basic items.
The remaining chapters of this book expand on the report basics explained in this chapter. Chapter 7 discusses advanced features such as report prompts and actions and how to create templates. It also introduces more advanced report items, such as charts. Chapter 7 continues to build on the reports created in this chapter.