Sampling
In This Chapter
![]()
- The reason for measuring a sample rather than the population
- The various methods for collecting a random sample
- Defining sampling errors and sampling bias
- Consequences for poor sampling techniques
This first chapter dealing with the long-awaited topic of inferential statistics focuses on the subject of sampling. Way back in Chapter 1, we defined a population as representing all possible outcomes or measurements of interest, and a sample as a subset of a population. Here we’ll talk about why we use samples in statistics and what can go wrong if they are not used properly.
Virtually all statistical results are based on the measurements of a sample drawn from a population. Major decisions are often made based on information from samples. For instance, the Nielson ratings gather information from a small sample of homes and are used to infer the television-viewing patterns of the entire country. The future of your favorite TV show rests in the hands of these select few! So choosing the proper sample is a critical step to ensure accurate statistical conclusions.
Most statistical studies are based on a sample of the population at large. The relationship between a population and sample is shown in Figure 12.1 (and also described in Chapter 1).
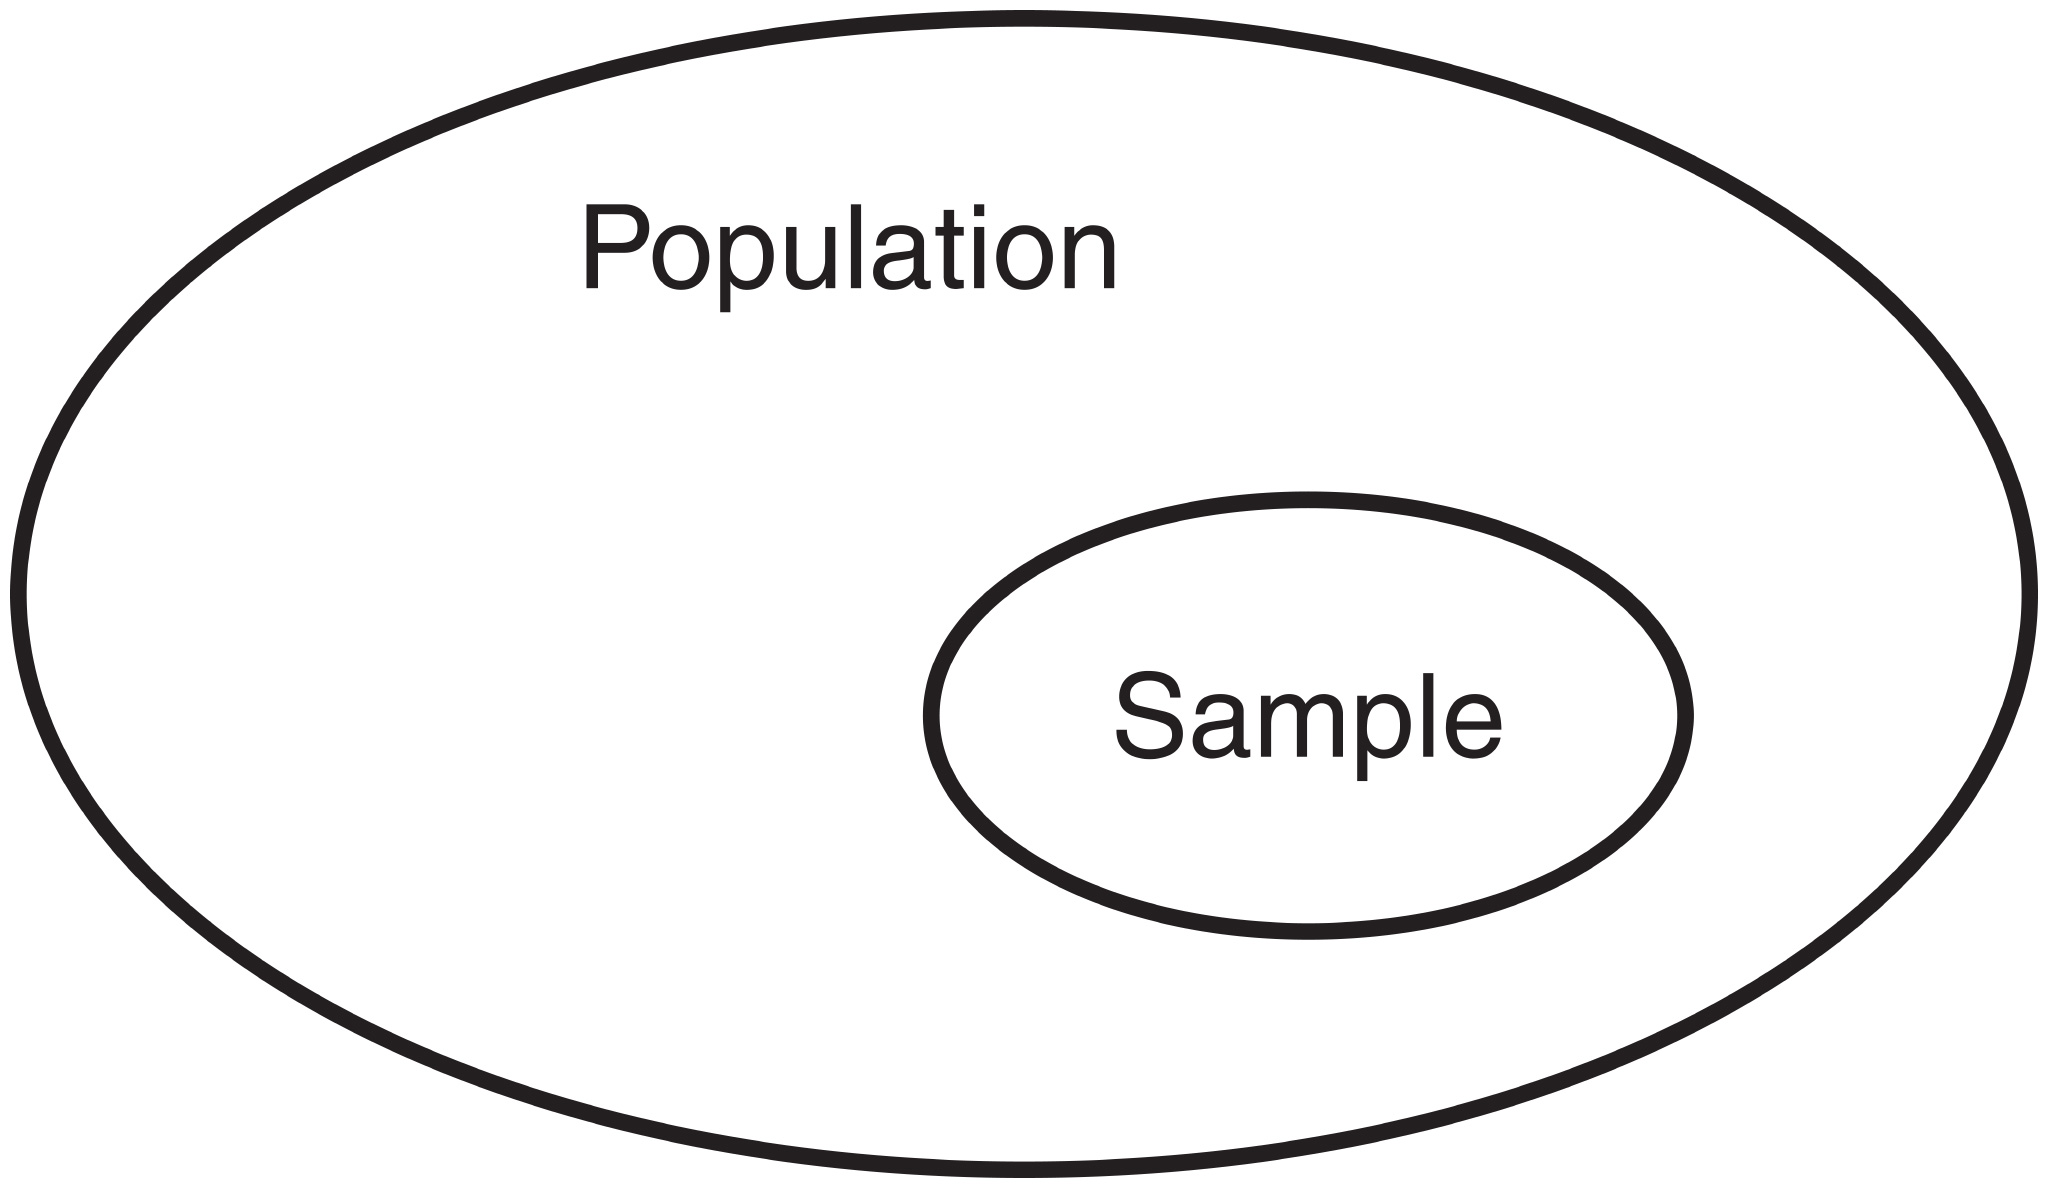
Figure 12.1
The relationship between a population and sample.
Why not just measure the entire population rather than rely on only a sample? That’s a very good question! Depending on the study, measuring an entire population could be very expensive or just plain impossible. If I want to measure the life span of a certain breed of pesky mosquitoes (extremely short if I have any say in the matter), I could not possibly observe every single mosquito in the population. Rather, I would need to rely on a sample of the mosquito population, measure their life spans, and make a statement about the life span of the entire population. That’s the whole concept of inferential statistics in one paragraph! Unfortunately, doing what we just wrote is a whole lot harder than just writing it. Doing it is what the rest of this book is all about!
Even if we could feasibly measure the entire population, to do so would often be a wasteful decision. If a sample is collected properly and the analysis performed correctly, we can make a very accurate assessment of the entire population. There is very little added benefit to continue beyond the sample and measure everything in sight. Measuring the population often is a waste of both time and money, resources that seem to be very scarce these days.
One example where such a decision was recently made occurred at Goldey-Beacom College where we teach. Bob was the Chair of the Academic Honor Code Committee and was involved in a project whose goal was to gather information regarding the attitude of our student body on the topic of academic integrity. It would have been possible to ask every student at our college to respond to the survey, but it was really unnecessary with the availability of inferential statistics. We eventually made the intelligent decision and sampled only a portion of the students to infer the attitudes of the population.
BOB’S BASICS
Often it is just not feasible to measure an entire population. Even when it is feasible, measuring an entire population can be a waste of time and money and provides little added benefit beyond measuring a sample.
Random Sampling
The term random sampling refers to a sampling procedure where every member in the population has a chance of being selected. The objective of the sampling procedure is to ensure that the final sample to be measured is representative of the population from which it was taken. If this is not the case, then we have a biased sample, which can lead to misleading results. If you recall, we discussed an example of a biased sample back in Chapter 1 with the golf course survey. The selection of a proper sample is critical to the accuracy of the statistical analysis.
DEFINITION
Random sampling refers to a sampling procedure where every member in the population has a chance of being selected. A biased sample is a sample that does not represent the intended population and can lead to distorted findings.
As we will see in the following sections, there are four different ways to gather a random sample: simple random, systematic, cluster, and stratified.
Simple Random Sampling
A simple random sample is a sample in which every member of the population has an equal chance of being chosen. Unfortunately, this is easier said than done. To illustrate, let’s use the academic integrity example mentioned previously.
DEFINITION
A simple random sample is a sample in which every member of the population has an equal chance of being chosen.
There are a few options for choosing a simple random sample for the academic integrity survey example. I could randomly choose students using a random number table, which is aptly named. (After all, it is simply a table of numbers that are completely random.) An excerpt of such a table is shown here:

Suppose we had 1,000 students in the population from which we were drawing a sample size of 100. (We’ll discuss sample size in Chapter 14.) I would list these students with assigned numbers from 0 to 999. Looking at the first three digits in each cell, the random number table would tell me to select student 572, followed by student 427, and so forth until I had selected 100 students. Using this technique, my sample of 100 students would be chosen with complete randomness.
Another method to choose a simple random sample is to use the Sampling function in Excel, part of the Analysis ToolPak. Using the academic integrity survey example, let’s say I want to choose 20 students at random for the sample using the ID numbers out of 200 students. I put the GBC student ID numbers in Column A. I’ll follow these steps:
1. Go to the Data tab, then click on Data Analysis.
2. From the Data Analysis box, select Sampling, and click OK.
3. In the Input Range box, select the data in column A (cells A1 to A201 in this example). Check the Labels box because we have a label in cell A1.
4. Under Sampling Method, choose Random and type “20” in the Number of Samples box.
5. In the Output Range box, choose the cell where you want Excel to put your randomly chosen sample (cell D2 in this example), and click OK.
Figure 12.2 shows the Excel Sampling function described above.

Figure 12.2
Excel’s Sampling function.
The result of the 20 random sample students is displayed in cells D2 to D21, as shown in Figure 12.3.

Figure 12.3
A random sample of 20 student ID Numbers.
So the first chosen student in the sample is the one with ID number 262152, followed by the student with ID number 237355, and so forth. All students had an equal chance of being chosen. Note that Excel uses sampling with replacement, meaning that after the first student ID number is chosen, it’s put back into the population before the second student ID number is chosen. Therefore, Excel can choose the same ID number more than once. If you don’t want the same student to be chosen more than once, then replace the duplicated student in your sample with another one at random.
Systematic Sampling
One way to avoid a personal bias when selecting people at random is to use systematic sampling. This technique results in selecting every kth member of the population to be in your sample. The value of k will depend on the size of the sample and the size of the population. Using our academic integrity survey, with a population of 1,000 students and a sample of 100, k = 10. From a listing of the entire population, I would choose every tenth student to be included in the sample. In general, if N = the size of the population and n = the size of the sample, the value of k would be approximately ![]() .
.
DEFINITION
In systematic sampling, every kth member of the population is chosen for the sample, with the value of k being approximately ![]() .
.
You can also use Excel for systematic sampling. Just follow the same steps as with the simple random sample before, except you want Periodic this time when you choose the sampling method. In the Period box, type your k value, which is 10 in this example (shown in Figure 12.4). To find k, we used the equation ![]() , where N = 200 and n = 20.
, where N = 200 and n = 20.

Figure 12.4
Systematic sampling in Excel.
The chosen systematic sample is placed in cells D2 to D21, as shown in Figure 12.5. This sample includes the 10th student on the list, followed by the 20th student on the list, and so forth.

Figure 12.5
A systematic sample of 20 Students.
The benefit of systematic sampling is that it’s easier to conduct than a simple random sample, often resulting in less time and money. The downside is the danger of selecting a biased sample if there is a pattern in the population that is consistent with the value of k. For instance, let’s say I’m conducting a survey on campus asking students how many hours they are studying during the week, and I select every fourth week to collect my data. Because we are on an 8-week semester schedule at Goldey-Beacom College, every fourth week could end up being mid-terms and finals week, which would result in a higher number of study hours than normal (or at least I would hope so!).
Cluster Sampling
If we can divide the population into groups, or clusters, then we can select a simple random sample from these clusters to form the final sample. Using the academic integrity survey example, the clusters could be defined as classes. We would randomly choose different classes to participate in the survey. In each class chosen, every student would be selected to be part of the sample.
DEFINITION
A cluster sample is a simple random sample of groups, or clusters, of the population. Each member of the chosen clusters would be part of the final sample.
For cluster sampling to be effective, it is assumed that each cluster selected for the sample is representative of the population at large. In effect, each cluster is a miniaturized version of the overall population. If used properly, cluster sampling can be a very cost-effective way of collecting a random sample from the population.
Stratified Sampling
In stratified sampling, we divide the population into mutually exclusive groups, or strata, that have something in common, and we randomly sample from each of these groups. There are many different ways to establish strata from the population. Using the academic integrity survey, we could define our strata as undergraduate and graduate students. If 20 percent of our college population is graduate students, then I could use stratified sampling to ensure that 20 percent of my final sample is also composed of graduate students. Other examples of criteria that we can use to divide the population into strata are age, income, or occupation. Stratified sampling is helpful when it is important that the final sample has certain characteristics of the overall population.
DEFINITION
A stratified sample is obtained by dividing the population into mutually exclusive groups, or strata, with a common characteristic and then randomly sampling from each of these groups.
One difference between stratified and cluster sampling is in the choice of the groups. With stratified sampling, the strata have something in common, such as having graduate or undergraduate status in our example. However, in cluster sampling, the strata are sub-sets of the population and don’t necessarily have to have something in common.
Sampling Error and Sampling Bias
Up to this point, we have stressed the benefits of drawing a sample from a population rather than measuring every member of the population. However, in statistics, as in life, there’s no such thing as a free lunch. By relying on a sample, we expose ourselves to errors that can lead to inaccurate conclusions about the population.
Sampling Error
The type of error that a statistician is most concerned about is called sampling error, which occurs when the sample measurement is different from the population measurement. Because the population is rarely measured in its entirety, the sampling error cannot be directly calculated. However, with inferential statistics, we’ll be able to assign probabilities to certain amounts of sampling error later in Chapter 15.
DEFINITION
Sampling error results from the difference between the population parameter (data which describes something about the population) and the sample statistic (data which describes the sample). Because samples don’t perfectly represent the population, we get sampling errors.
Sampling errors occur because we might have the unfortunate luck of selecting a sample that is not a perfect match to the entire population. Sampling errors are expected and usually are a small price to pay to avoid measuring an entire population. One way to reduce the sampling error of a statistical study is to increase the size of the sample. In general, the larger the sample size, the smaller the sampling error. If you increase the sample size until it reaches the size of the population, then the sampling error will be reduced to zero. But in doing so, you forfeit the benefits of sampling.
Sampling bias occurs when samples are designed to choose some of the population only with certain characteristics instead of parts of the population without those characteristics. For example, let’s say I want to show that the current administration is doing a good job handling the economy by showing that the average income in the United States is high. In creating my sample, I choose more people from the states with high income and less people from the states with low income. This way, the average for my sample will show a high average income in the United States. In this case, my sample is biased. It shows incorrectly that average income in the United States is higher than it actually is.
To demonstrate sampling bias in another instance, I might want to show that the unemployment rate in the United States is low. In designing my sample, I choose more people from the states with low unemployment rates and less people from the states with high unemployment rates. This way my sample will show a low unemployment rate in the United States. Again, this sample is biased and incorrectly represents the population.
To avoid sampling bias, samples should be chosen to represent the entire population from which they are drawn and every member in the population should have the same chance of being selected. In other words, be careful that your sample does not just include parts of the population with certain characteristics over parts without those characteristics.
Examples of Poor Sampling Techniques
The technique of sampling has been widely used, both properly and improperly, in the area of politics. One of the most famous mishaps with sampling occurred during the 1936 presidential race when the Literary Digest predicted Alf Landon to win the election over Franklin D. Roosevelt. Even if history is not your best subject, you can realize somebody had egg on his face after this election day. Literary Digest drew their sample from phonebooks and automobile registrations. The problem was that people with phones and cars in 1936 tended to be wealthier Republicans and were not representative of the entire voting population.
Another sampling blunder occurred in the 1948 presidential race when the Gallup poll predicted Thomas Dewey to be the winner over Harry Truman. The failure of the Gallup poll stemmed from the fact that there were a large number of undecided voters in the sample. It was wrongly assumed that these voters were representative of the decided voters who happened to favor Dewey. Truman easily won the election with 303 electoral votes compared to Dewey’s 189.
As you can see, choosing the proper sample is a critical step when using inferential statistics. Even a large sample size cannot hide the errors of choosing a sample that is not representative of the population at large. History has shown that large sample sizes are not needed to ensure accuracy. For example, the Gallup poll predicted that Richard Nixon would receive 43 percent of the votes for the 1968 presidential election and in fact he won 42.9 percent. This Gallup poll was based on a sample size of only 2,000; whereas the disastrous 1936 Literary Digest poll sampled 2,000,000 people (Source: personal.psu.edu/faculty/g/e/gec7/Sampling.html).
WRONG NUMBER
Have you ever participated in an online survey on a sports or news website that allowed you to view the results? These surveys can be fun and interesting, but you need to take the results with a grain of salt. That’s because the respondents are self-selected, which means the sample is not randomly chosen. The results of these surveys are most likely biased because the respondents would not be representative of the population at large. For example, people without internet access would not be part of the sample and might respond differently than people with access to the internet.
Practice Problems
1. You are to gather a systematic sample from a local phone book with 75,000 names. If every kth name in the phone book is to be selected, what value of k would you choose to gather a sample size of 500?
2. Consider a population that is defined as every employee in a particular company. How could you use cluster sampling to gather a sample to participate in a survey involving employee satisfaction?
3. Consider a population that is defined as every employee in a particular company. How could you use stratified sampling to gather a sample to participate in a survey involving employee satisfaction?
The Least You Need to Know
- A simple random sample is a sample in which every member of the population has an equal chance of being chosen.
- In systematic sampling, every kth member of the population is chosen for the sample, with the value of k being approximately
 .
. - A cluster sample is a simple random sample of groups, or clusters, of the population. Each member of the chosen clusters would be part of the final sample.
- Obtain a stratified sample by dividing the population into mutually exclusive groups, or strata, and randomly sampling from each of these groups.
- Sampling error occurs when the sample measurement is different from the population measurement. It is the result of selecting a sample that is not a perfect match of the entire population.