
11.3. Microsoft Fiddler
Since the core of Ajax relies on requests going to servers (and responses being received from them), it makes sense that debugging Ajax applications relies heavily on understanding what is being sent to and received from the server. FireBug for Firefox inspects the requests and responses sent through XHR objects, but this is only a very small percentage compared to all of the requests and responses used during a typical user session. And, as discussed in the previous section, many requests may be sent without using XHR at all. The way to solve these problems is to use an HTTP proxy.
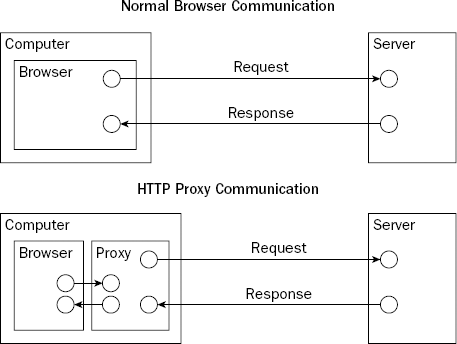
An HTTP proxy is a small program running on the client computer that intercepts all HTTP requests and responses. In normal HTTP communication, the browser initiates and sends a request over the Internet to a server. The server then sends a response back to the browser, which then acts upon the data it received. When an HTTP proxy is used, all requests are first sent through the proxy; it's the proxy's job to send that request to the server. The response is sent back to the proxy as well, and the proxy then forwards it to the browser (see Figure 11-3).
However, the true value of the HTTP proxy isn't the simple interception of requests and responses but rather the ability to log the details of this communication. By being able to see the entirety of each request or response, including headers, debugging Ajax communication is made much simpler. This is where Microsoft Fiddler comes in.
NOTE
Even though this section focuses on using Fiddler for debugging Ajax applications, it's worth pointing out that it has many uses. Since Fiddler intercepts all HTTP traffic coming to and leaving from the client, it's possible to monitor traffic caused by desktop applications.
Figure 11.3. Figure 11-3
11.3.1. Installation and Setup
One of the most useful and easiest to use HTTP proxies available is Microsoft Fiddler. This free tool (available from www.fiddlertool.com) installs itself as an HTTP proxy for WinInet, which is the Internet communication library used by many desktop applications, including Internet Explorer. Once installed, Fiddler automatically begins intercepting HTTP traffic to and from your computer.
To intercept HTTP traffic from Internet Explorer or Opera, no further setup is required. Since both use WinInet, Fiddler automatically sets itself up to intercept requests and responses for them. To intercept HTTP traffic for Firefox, you'll need to modify some settings in the browser:
Under the Tools menu, select Options.
Click on the General tab if it's not already selected.
Click on the Connection Settings button.
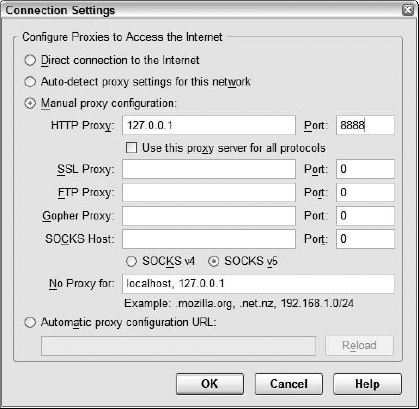
In the Connection Settings window, select Manual proxy configuration.
For HTTP Proxy, enter 127.0.0.1. For Port, enter 8888 (see Figure 11-4).
Click OK on the Connection Settings window, and then Click OK on the Options window.
After this point, all HTTP traffic for Firefox goes through Fiddler along with any other traffic coming from other browsers on your machine.
Figure 11.4. Figure 11-4
11.3.2. The Interface
The Fiddler window is fairly unrefined and simple. There are two main regions: the left side and the right side. The left side of the window contains a list of HTTP requests sent from the machine. Each request takes a single line and is accompanied by an icon that indicates the type of data returned from that request. The line includes the response status, the protocol used (usually HTTP), the host name, the URL, the caching type, the length of the response, and the content type (see Figure 11-5).
There is a context menu for each request; right-clicking on a single request or a group of selected requests brings up several options: a Copy menu allows copying specific parts of a request to the clipboard, and a Save menu allows saving request data to text files.
Figure 11.5. Figure 11-5

On the right side of the window are three tabs. The first tab (pictured in Figure 11-5) is Performance Statistics. This tab displays information relating to data transmission rates, including the number of bytes sent and received as well as the types of data received. It also gives estimated roundtrip times from various locations in the world using different connection methods (modem, DSL, etc.).
The second tab on the right is the Session Inspector. This tab provides specific information about each request and accompanying response. It is separated into two sections: the top contains information about the request and the bottom contains information about the response (see Figure 11-6).
Figure 11.6. Figure 11-6

In the request section, you can choose from any number of data views:
Headers: Displays the HTTP request headers that were sent to the server from the client. This data is represented in a hierarchical view and typically contains information about the web browser along with basic request information.
TextView: Displays the body of the request (for POST requests only).
Forms: Displays information that appears on the query string and in the body of the request, provided that the body is formatted with a content type of "application/x-www-form-urlencoded."
Hex: Displays the hexadecimal representation of the request.
Auth: Displays information from Proxy-Authorization and Authorization headers.
Raw: Displays the entire request as simple text.
XML: Displays the body as a hierarchical XML tree if the body of the request is an XML document.
The response section of the Session Inspector tab has similar options for viewing information about the response:
Transformer: Displays encoding information about the response.
Headers: Displays a hierarchical tree of response headers.
TextView: Displays the plain text of the response body.
ImageView: Displays an image if the response retrieved one.
Hex: Displays the hexadecimal representation of the response.
Auth: Displays information from Proxy-Authenticate and WWW-Authenticate headers.
Caching: Displays caching information about the response.
Privacy: Displays privacy (P3P) information about the response
Raw: Displays the raw text of the response.
XML: Displays the response body as an XML hierarchy if the response is an XML document.
The third tab is the Request Builder, which allows you to manually construct an HTTP request (including all headers and the request body) and inspect the response. This can be very helpful when testing the server-side portion of an Ajax solution. It's also possible to clone a request that has already been made by dragging the request from the left side of the window onto the Request Builder tab. This prefills the Request Builder fields with information from that request.
11.3.3. HTTP Breakpoints
One of the most interesting and powerful options in Fiddler is the ability to set breakpoints for HTTP requests and responses. Under the Rules menu, select Automatic Breakpoints, and you'll see options for Before Requests, After Responses, Disabled, and Ignore Images. By selecting Before Requests, Fiddler intercepts outgoing requests (it will ignore any image requests if Ignore Images is checked) and holds them in the window (see Figure 11-7).
When a request breakpoint is set, a special icon is shown on the request in the list of requests. Selecting the request fills the Session Inspector tab with all of the information about the request. It's then possible to edit all of the request information before it's sent on to the server. After that, there are two options displayed in the window: Break on Response or Run to Completion. Clicking Break on Response sends the request and then sets a breakpoint for the response before it is returned to the browser (the same as selecting After Responses on the Automatic Breakpoints submenu); clicking Run to Completion sends the request and doesn't interfere with the response.
A response breakpoint is very similar to a request breakpoint: it holds the response and allows you to edit the details before the browser receives the data. Once again, using the Session Inspector, you can edit the headers and response body. After editing the information, the only option is Run to Completion, which sends the modified response to the browser.
Figure 11.7. Figure 11-7

11.3.4. Ajax Debugging with Fiddler
With all of these powerful features, Fiddler is an ideal environment for Ajax debugging. Here are some things you can use Fiddler for:
Is the outgoing data correct? As with FireBug, ensure that the data being sent to the server is in the correct format and contains the correct data. Errors here indicate a problem with the JavaScript constructing the request.
Is the incoming data correct? Also as with FireBug, check that the incoming data is in the correct format and contains appropriate data. A problem here indicates an error on the server.
Confirm your assumptions. If you think there's an error in a request or response, set a breakpoint and try running the request/response again. This is especially helpful if you don't own the server-side code that may be the problem.
Since Fiddler monitors all HTTP traffic, these techniques can be using not just for Ajax communication initiated through XHR but also through hidden frames and any other Ajax technique discussed in Chapter 2.