
11.2. FireBug
Mozilla's Firefox has long inspired creative add-ons due to its open and fairly straightforward add-on capabilities. In 2006, Firefox contributor Joe Hewitt introduced FireBug as a new tool to help developers create and debug web sites and web applications. Built into FireBug are tools that allow DOM inspection of the page that is currently loaded, style information about particular elements, and the part most interesting to Ajax developers, monitoring of all traffic from the XHR object.
11.2.1. Installation and Setup
FireBug is available for free from www.getfirebug.com. FireBug is downloaded as an XPI, meaning that Firefox knows how to install it. Once you have clicked on the download link, you'll be prompted to allow the package to be installed. Clicking OK on this dialog installs FireBug (though you'll need to restart the browser to use it).
FireBug augments the Firefox window in two ways.
First, it adds a small panel on the right of the status bar to display error information for the page (green if there are no errors, red if there are errors).
Second, a main panel displaying information about the currently loaded page is displayed at the bottom of the window. This panel can be visible or hidden by default and can be quickly toggled by clicking on the status panel.
11.2.2. The Interface
The basic FireBug 1.0 interface has three tabs in the main panel.
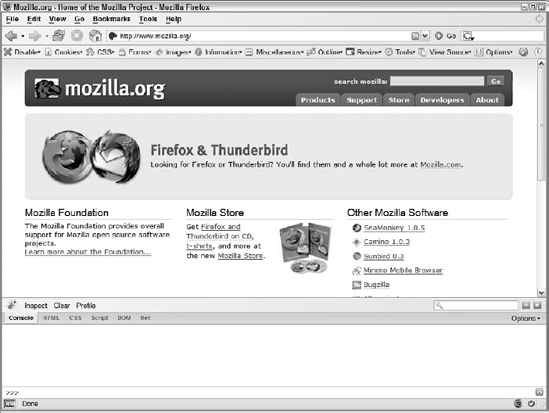
The first tab is called Console, and it contains a basic command line JavaScript interface. It is on this tab that JavaScript error messages are logged, but it's also possible to interact with the page by typing in JavaScript commands (see Figure 11-1).
Figure 11.1. Figure 11-1
The second tab is called HTML, and it contains a basic DOM inspector. From this tab, you can view the entire page as a hierarchy of DOM nodes, including style, event, and property information.
The third tab is called CSS, and it contains a CSS inspector, allowing you to view all of the loaded style sheets and modify the styles dynamically.
The fourth tab is called Script, and it contains a basic JavaScript debugger. You can select from the currently loaded script files and set breakpoints. While not as powerful as Venkman, this FireBug's debugger is suitable for basic debugging tasks.
The fifth tab is called DOM, which is a bit of a misnomer since it displays a hierarchical list of all objects that exist in the window scope. You can then drill down on each object to get more information about its properties.
The last tab is called Net and contains a graph indicating the resources that were loaded by the page at specific points in time. This can be useful to see the order in which resources are being loaded as well as how long each request takes.
FireBug tries to be a one-stop shop for web debugging by providing all of these tools. However, it has one feature that other Firefox extensions don't: XHR logging.
11.2.3. XHR Logging
Though there are many ways of establishing Ajax communication, the most common is still the XHR object. It follows, then, that many problems with such communication are most likely related to XHR usage. FireBug aims to assist in debugging these types of problems by logging all requests made via XHR.
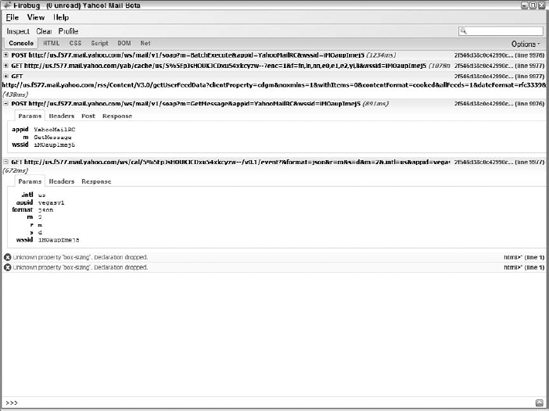
Every time an XHR object is used to make an HTTP request, that information is logged onto the Console tab as a line item. The line contains the method of request (typically GET or POST) as well as the URL used for the request followed by the amount of time (in milliseconds) it took for the response to be fully received. This line can be expanded (by clicking on the triangle next to the request) to display more tabs (see Figure 11-2).
If a GET request was sent, there are three tabs: Params, Headers, and Response.
The Params tab enumerates the name-value pairs of query string arguments. It displays the arguments unencoded so you can easily see what data the server is receiving.
The Headers tab contains the HTTP response headers sent along with the data as well as the headers sent with the request. This tab can contain helpful information such as cookie data, content type, and the timestamp of the response.
The Response tab contains the raw text sent back from the server to the client. This is the exact, unformatted server response, so it may be necessary to copy this text and paste it into an editor to view it in a more human-readable manner.
If a POST request was sent, there are four tabs. Added to the Params, Headers, and Response tabs that are also present for GET requests, a Post tab displays the data sent to the server. Since data for POST requests are sent as the request body, the URL alone doesn't provide enough information about what the server received.
Figure 11.2. Figure 11-2
11.2.4. Ajax Debugging with FireBug
Here's a short list of things you want to be on the lookout for when debugging your Ajax application using FireBug:
Is the outgoing data correct? For GET requests, always double-check to ensure that the query string is properly encoded and that all of the expected data is included. For POST requests, ensure that the data being posted is in the correct format (plain text, JSON, XML, etc.) and contains the information that is necessary. An error in any of these indicates there is a problem with the JavaScript that is creating and sending the request.
Is the incoming data correct? Both GET and POST requests can receive information from the server in any number of formats. Make sure that the format is correct and the data is what you are expecting. Double-check the data that is being sent to the server to ensure that it is correct. If you are sending the correct data, then this type of error indicates a problem with the server-side code.
Are the headers correct? Always make sure that the correct HTTP headers are being sent back to the client. For instance, if the server is returning XML data, make sure that the Content-Type header is set to "text/xml" so that the responseXML object can be used.
Remember, FireBug is simply outputting data relating to the Ajax requests going back and forth, but it has no control over the data being sent or received. Further, you can't set breakpoints in the requests or responses; all you get is the information after the response has been received.
11.2.5. FireBug Limitations
As discussed earlier in the book, Ajax communication is not limited to the use of XHR. While FireBug does a great job dissecting requests made using the XHR object, it doesn't address any of the other Ajax communication techniques. So, if you are using hidden frames or any of the other techniques discussed in Chapter 2, FireBug won't be of any help.
Another limitation is that FireBug doesn't log information until a response is received from the server. This means that you may have outstanding requests in transit that have not yet received a response and therefore won't have been logged to the console. A good understanding of when your application makes these requests is key to debugging using FireBug.