
10.3. Google Maps API
When Google Maps first debuted, it was the victim of numerous hackers. People were enthralled with this next-generation Ajax application that did things no one had ever seen done before. Developers from around the world wanted to know how it worked and how they could use it to their advantage. Though not damaging in any way, these early Google Maps hackers opened the eyes of the folks in Mountain View, California, and soon the Google Maps API was released to the public.
10.3.1. How Does It Work?
The Google Maps API is one of the most interesting uses of Ajax in that it doesn't necessarily need to use XHR or iframes to accomplish its functionality. Instead, the API uses the dynamic nature of images to fetch new information from the server on demand. Although it doesn't use the Ajax image technique discussed in Chapter 2, the same basic idea is at work: images can have their sources changed at any time. The Google Maps API uses this functionality to create the illusion of panning over one large image when, in reality, it loads only small pieces of the overall image to give the perception of a much larger one.
The initial view of the map is split into several images that are placed next to each other, giving the appearance of one large image. When a map is first loaded, the API determines how many of these images are necessary to completely fill the map container. The images are arranged in a grid that overlaps the ends of the map container. If the map is zoomed, each of the tiled images is set to a different URL, loading a new image into the <img/> element. This gives the illusion of an asynchronous zoom when, in reality, it's just a new take on the old image-swapping technique that has been around since the late 1990s.
When the map is panned or dragged by the user, it appears as if the map is neverending image thanks to some interesting JavaScript. The images are, indeed, moved as the user drags the mouse, but once the images disappear out of the map's viewable area, they are removed and placed at the other end of the map. For instance, images that disappear off the right side of the map are placed just out of view on the left, and images that disappear off the bottom of the map are placed just out of view on the top. It's this constant repositioning of image tiles that gives the illusion that the user is panning over a single large image. Joel Webber, one of the first developers to dissect how Google Maps works, likened the technique to building a railroad track by taking a piece from the end and placing it at the front: images are neither created nor destroyed, just moved around.
Behind the scenes, there's also some XML and XSLT performing extra functions on the map, but the majority of the work is handled by images.
10.3.2. Getting Started
To begin, you need to have a Google account (such as to access Gmail). If you don't have a Google account yet, go to www.google.com/accounts for information on how to sign up. The next step is to go to www.google.com/apis/maps/signup.html to sign up for an API key. To do so, you must provide a URL indicating the location at which the API will be used. This location is a specific directory on your server; so www.mydomain.com/maps1 and www.mydomain.com/maps2 would each require separate keys.
The Google Maps API does have some important limitations you should be aware of:
The API is for noncommercial use only. To obtain a commercial license, you'll need to contact Google directly.
The page using the Google Maps API has no page view limits; however, if you anticipate more than 500,000 page views per day, you'll need to contact Google about getting a commercial license.
You are prohibited from obscuring attributions or ads that appear within the map viewport.
You must keep your site up to date with the most current version of the API. Google generally gives users a month to upgrade to a newly released version.
There is only one JavaScript file necessary for you to begin using the Google Maps API. Unlike other APIs, you can't download the files locally. Instead, you'll need to access the file located on the Google Maps server. This file must include the version and your key in this format:
http://maps.google.com/maps?file=api&v={version}&key={your key}For instance, if the most recent version is version 2, the following code should be included:
<script type="text/javascript"
           src="http://maps.google.com/maps?file=api&v=2&key={your key}"></script>
Once the file is included, you can begin writing your application.
10.3.3. Google Maps Basics
The main object in the Google Maps API is called GMap2. The constructor accepts a single argument, which is the element that should contain the map. It is recommended that this container element be a <div/> for best compatibility and extensibility. This <div/> element can be styled as normal, minimally specifying the width and height. The GMap2 object is smart enough to work within the styles provided for the container <div/>, so the page's overall layout will never be compromised due to the inclusion of a map. To create a map using a <div/> element with an ID of "divMap", use the following:
var oMap = new GMap2(document.getElementById("divMap"));Once the map object is created, you must initialize the view to a specific area. This is done by calling the setCenter() method of the map, which accepts two arguments: a point given in latitude/longitude and a zoom level. The first argument must be a GLatLng object (creating by passing in a latitude and a longitude in decimal format); the second argument is a zoom level where 0 is completely zoomed out and any number greater than 0 reveals more detail in the map. For example, the following code centers a map on the United States so that the entire country is in view:
var oMap = new GMap2(document.getElementById("divMap"));
oMap.setCenter(new GLatLng(32, −92), 3);
There are some browsers that may not support the Google Maps API, so it's best to check ahead of time before creating a new GMap2 object, by using the GBrowserIsCompatible() function:
if (GBrowserIsCompatible()) {
var oMap = new GMap2(document.getElementById("divMap"));
oMap.setCenter(new GLatLng(32, −92), 3);
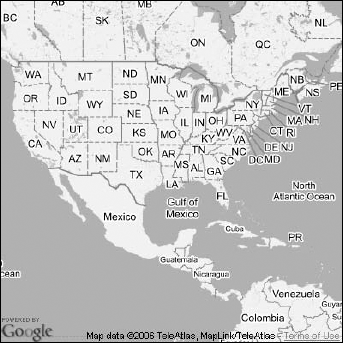
}These four lines of code are all that it takes to get a simple map instantiated on a page (see Figure 10-1).
The map display with this code is very basic and fairly limited. While the map of the United States is plainly visible, there is little user interaction. It's possible to move the viewport of the map by dragging the image, but other than that, there's no zooming or view switching. The easiest way to enable this functionality is to include one or more controls.
Figure 10.1. Figure 10-1
10.3.4. Controls
The official Google Maps interface at http://maps.google.com has a number of different ways the user can manipulate the map. Each of these manipulations is handled by a different control. The Google Maps API provides a number of default controls that can be used to implement the full Google Maps interface or just the parts necessary for your purposes:
GLargeMapControl: The typical pan/zoom control displayed on http://maps.google.com.
GSmallMapControl: A smaller version of the previous control, with only plus/minus and directional controls (but no zoom slider).
GSmallZoomControl: The zoom slider control without any directional controls.
GScaleControl: A scale indicating units in miles and kilometers.
GOverviewMapControl: A zoomed-out view of the map with the current viewport area highlighted.
One or more of these controls can be added to the map via the addControl() method. Each of the controls can be created without any parameters and passed into the method:
oMap.addControl(new GSmallMapControl());
Though this is most often done just after creating a GMap2 object, controls can be added at any time. Additionally, controls can be removed using the removeControl() method if you have a reference to the control:
var oControl = new GSmallMapControl();
oMap.addControl(oControl);

//do some other stuff

oMap.removeControl(oControl);
The first three controls, GLargeMapControl, GSmallMapControl, and GSmallZoomControl should not be used together, since they all occupy the same location on the map (upper-left corner). The GMapTypeControl can safely be used with any of the others, since it occupies the upper-right corner.
If you want your map to have controls right from the onset, you should add them immediately after creating the GMap2 object but before you call setCenter(), such as:
if (GBrowserIsCompatible()) {
    var oMap = new GMap2(document.getElementById("divMap"));
    oMap.addControl(new GSmallMapControl());
    oMap.addControl(new GMapTypeControl());
    oMap.setCenter(new GLatLng(32, −92), 3);
}
Adding these controls yields the map in Figure 10-2.
Figure 10.2. Figure 10-2

10.3.5. Moving the Map
It's possible to dynamically control the view of the map once it's been loaded by using several methods of the GMap2 object. Although the user can access various controls on the map to zoom and move the map view, it may be necessary to control the map separately. All of the navigation that can be performed using the controls can also be accomplished by directly calling the JavaScript methods for the specific behavior.
The setCenter() method was used earlier to initialize the map display, but it can also be used at any time to recenter the map on a specific point. This recentering is immediate and has no animation associated with it. For a smoother transition to a new point on the map, there are several methods available:
panBy(distance): Specifies the distance (as a GSize) that the map should be moved by.
panDirection(x, y): Specifies the direction that the map should be panned to. The x argument should be −1 to move left, 0 to not move, or 1 to move right; the y argument should be −1 to move up, 0 to not move, or 1 to move down.
panTo(center): Specifies a GLatLng object that should be the new center of the map. The map that animates moving to that position (same as setCenter(), except with animation).
These methods can be used as any time to move the map to a new position, for example:
oMap.panBy(new GSize(20,20));      //Pans the maps by 20 pixels in each direction
oMap.panDirection(1, 0);           //Pans the maps to the right
oMap.panTo(new GLatLng(50, −80));  //Pans map to the specified location
10.3.6. Info Windows
Info windows provide additional information about a point on the map. On the Google Maps web site, info windows are used to provide address information about a point on the map, although they can be used for many more purposes. Visually, info windows look like dialogue bubbles from a comic strip: a round, white bubble anchored by a white triangle pointing to a specific location on the map (see Figure 10-3).
Figure 10.3. Figure 10-3

10.3.6.1. Basic Info Windows
An info window can be opened at any time by using the openInfoWindow() method of the GMap2 object. This method accepts three arguments: a GLatLng object specifying where the info window should be anchored, a DOM node providing the contents of the info window, and an optional configuration object.
To open a very simple info window at the center of the map, the following code can be used:
oMap.openInfoWindow(oMap.getCenter(),
                    document.createTextNode("Center of the map!"));
The getCenter() method of the GMap2 object returns a GLatLng object for the center of the map, ensuring that the info window points to the exact center. Even though this info window displays only text, it's still necessary to pass in a DOM node for the second argument, so a text node is created with the message to display.
There is a second method, openInfoWindowHtml(), that allows an HTML string to be passed in as the body of the info window instead of a DOM node. This method accepts the same three arguments (a point to anchor to, the contents of the window, and an optional configuration object) and is called like this:
oMap.openInfoWindowHtml(oMap.getCenter(), "<em>Center of the map!</em>");
This example opens an info window with stylized text (italics, assuming that there are no styles overriding the default display of <em/>). In this way, it's possible to create rich text on the fly and display it in an info window without the need to create DOM objects.
10.3.6.2. Configuration Options
The third argument to both of the previously mentioned methods is a configuration object for the info window. This object can contain one more of the following properties:
maxWidth: The maximum allowable width of the info window in pixels
onCloseFn: A function to call once the info window has been closed
onOpenFn: A function to call once the info window has been opened
This configuration object can be included as an object literal, such as:
oMap.openInfoWindowHtml(oMap.getCenter(), "<em>Center of the map!</em>",
                        { onCloseFn: function() { alert("Closed") } });
When you run this code, an alert is displayed after the user clicks the close button on the info window. Generally speaking, the onCloseFn option is the most useful of the available options, since it provides a hook to an otherwise untraceable event. maxWidth can otherwise be set using CSS and onOpenFn can easily be mimicked by calling a function right after the call to openInfoWindow() or openInfoWindowHtml(), since both are synchronous operations.
10.3.6.3. Tabbed Info Windows
A new addition to version 2 of the Google Maps API is the tabbed info window. Tabbed info windows can be used to present more information about a particular point on the map without taking up extra horizontal and vertical space (see Figure 10-4).
Figure 10.4. Figure 10-4

As with nontabbed info windows, the tabbed version can be created with two methods: openInfoWindowTabs() and openInfoWindowTabsHtml(). Both methods accept three arguments: a GLatLng object indicating where on the map to point to, an array of GInfoWindowTab objects representing the tabs, and an optional configuration object. The difference between the two methods has to do with the data available within each GInfoWindowTab object. When you use openInfoWindowTabs(), each GInfoWindowTab object must be created using a string for the tab title and a DOM node for the tab contents; openInfoWindowTabsHtml() expects each GInfoWindowTab to have been created using a string for the tab title and a string for the contents (which can contain HTML). The following code creates an info window with two tabs:
var aTabs = [
    new GInfoWindowTab("First tab", document.createTextNode("First tab text")),
    new GInfoWindowTab("Second tab", document.createTextNode("Second tab text"))
];
oMap.openInfoWindowTabs(oMap.getCenter(), aTabs);
The first part of this code creates an array containing two GInfoWindowTab objects whose contents are text nodes. This array is then passed in as the second argument of openInfoWindowTabs() to display the info window. To display formatted HTML text instead of plain text, use openInfoWindowTabs() and assign the tab contents as a string:
var aTabs = [
    new GInfoWindowTab("First tab", "<em>First</em> tab text"),
    new GInfoWindowTab("Second tab", "<em>Second</em> tab text")
];
oMap.openInfoWindowTabsHtml(oMap.getCenter(), aTabs);
This code produces the result seen previously in Figure 10-4. Note that only three lines have changed: the two lines defining the GInfoWindowTab objects and the method call.
The configuration object can contain the same options as those used with non-tabbed info windows, as well as an additional property called selectedTab. This value is an integer indicating the number of the tab that should be selected when the info window is initially displayed; the default value is 0, which selects the first tab. To select the second tab by default, the following code passes in a configuration object with selectedTab set to 1:
var aTabs = [
    new GInfoWindowTab("First tab", "<em>First</em> tab text"),
    new GInfoWindowTab("Second tab", "<em>Second</em> tab text")
];
oMap.openInfoWindowTabsHtml(oMap.getCenter(), aTabs, { selectedTab: 1 });
10.3.6.4. Map Blowups
A map blowup is a special type of info window that shows a zoomed-in view of a particular point on the map. The contents of this info window are a smaller version of the main map, complete with buttons for changing the map type and a zoom control (see Figure 10-5).
Figure 10.5. Figure 10-5
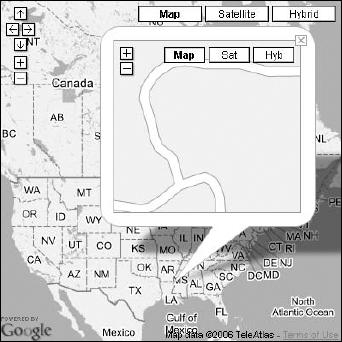
The showMapBlowup() method is used to open a map blowup info window. This method accepts two arguments: a GLatLng object indicating the point to both anchor on and blow up and an optional configuration object. For example, to show a blowup of the center of the map, use the following code:
oMap.showMapBlowup(oMap.getCenter());
When the second argument is specified, the configuration object has two additional properties to interact with map blowups. The first is zoomLevel, which indicates the zoom factor of the map shown in the info window. The second is mapType, which indicates what type of map should be displayed (one of G_NORMAL_MAP, G_SATELLITE_MAP, G_HYBRID_MAP or any custom map type). To display a blowup of the center of the map at a zoom level of 5 showing a satellite map, the following code can be used:
oMap.showMapBlowup(oMap.getCenter(), {zoomLevel: 5, mapType: G_SATELLITE_MAP});Aside from these two properties, the same three basic configuration options are available (maxWidth, onOpenFn, and onCloseFn).
10.3.6.5. Manipulating Info Windows
Once an info window is opened, a reference to the GInfoWindow object can be retrieved by calling the getInfoWindow() method. The GInfoWindow object can be helpful when it's necessary to interact with the info window outside of user action. For instance, an info window may need to be hidden after a certain amount of time. This can be accomplished by using a timeout and calling the hide() method, like this:
setTimeout(function () {
    var oInfoWindow = oMap.getInfoWindow();
    oInfoWindow.hide();
}, 5000);
It's also possible to redisplay an info window after it's been hidden using the show() method:
setTimeout(function () {
    var oInfoWindow = oMap.getInfoWindow();
    oInfoWindow.hide();

    setTimeout(function () {
        oInfoWindow.show();
    }, 5000);

}, 5000);
Since the contents of the info window aren't overwritten until either openInfoWindow() or openInfoWindowHtml() is called, the original contents are redisplayed when show() is called. Each time hide() or show() is called, an internal flag is set indicating the info window's state. This flag is accessed using the isHidden() method:
setTimeout(function () {
    var oInfoWindow = oMap.getInfoWindow();
    oInfoWindow.hide();
    alert("Hidden? " + oInfoWindow.isHidden());

    setTimeout(function () {
        oInfoWindow.show();
        alert("Hidden? " + oInfoWindow.isHidden());
    }, 5000);

}, 5000);
This code outputs the returned value of isHidden() after the call to hide() and after the call to show(), indicating the status of the internal flag.
The info window also remembers which point it was set up to be anchored to; this value can be retrieved using the getPoint() method, which returns the GLatLng object that was originally used to create the info window. Similarly, it's possible to determine how far away the tip of the info window arrow is to that point by using the getPixelOffset() method, which returns a GSize object indicating how far away the info window is:
var oInfoWindow = oMap.getInfoWindow();
var oPoint = oInfoWindow.getPoint();
var oOffset = oInfoWindow.getPixelOffset();

alert("Info window points to (" + oPoint.lat() + "," + oPoint.lng()
      + ") and the arrow tip is " + oOffset.height + " y pixels and "
      + oOffset.width + " x pixels from that point.");
Tabbed info windows have several other methods designed to interact with the tabs. The selectTab() method can be called at any time to change the selected tab in the info window. As with the selectedTab property of the configuration object, pass in the index of the tab that should be selected (where 0 is for the first tab, 1 is for the second, etc.):
setTimeout(function () {
    var oInfoWindow = oMap.getInfoWindow();
    oInfoWindow.selectTab(1);
}, 5000);
The index of the currently selected tab can be determined by using getSelectedTab():
setTimeout(function () {
    var oInfoWindow = oMap.getInfoWindow();
    alert("Selected tab: " + oInfoWindow.getSelectedTab());
    oInfoWindow.selectTab(1);
    alert("Selected tab: " + oInfoWindow.getSelectedTab());
}, 5000);
In this example, the index of the selected tab is output before and after the call to selectTab() in order to show that the tab has changed.
There are also a couple of other methods that can be used to retrieve other information about the tabbed info window:
getContentContainers(): Returns an array of DOM nodes corresponding to the contents of each tab.
getTabs(): Returns the array of GInfoWindowTab objects that was originally passed in to create the tabbed info window.
10.3.7. Events
Most objects in the Google Maps API support custom events. To access these events, there is a GEvent object with a couple of methods. The first, addListener(), is used to assign a function as an event handler for a particular event. This method accepts three arguments: the object to observe, the name of the event, and a function to call when the event occurs. For example, to listen to the load event of a GMap2 object, the following code can be used:
GEvent.addListener(oMap, "load", function () {
    alert("Map is loaded.");
});
This code displays an alert when the map has finished loading and is ready to be interacted with.
The other method of GEvent is called bind(), and its purpose is to add an event handler that is a method of an object. It takes four arguments: the object to observe, the name of the event, the object on which the method exists, and the method to call. Consider the following example:
var oCustom = new Object();
oCustom.message = "Complete";
oCustom.handleMapLoad = function () {
    alert(this.message);
};

GEvent.bind(oMap, "load", oCustom, oCustom.handleMapLoad);
This example creates a custom object called oCustom that contains a method to call when the map has finished loaded (called handleMapLoad). The GEvent.bind() method specifies oCustom and oCustom.handleMapLoad as the third and fourth arguments. This ensures that the handleMapLoad() method is called when the map is fully loaded.
The GMap2 object supports the following events:
addmaptype: Fires when a map type is added to the map; supplies a maptype argument to the event handler.
addoverlay: Fires when an overlay is added; the overlay is passed in as an argument to the event handler.
click: Fires when the map is clicked; supplies a point (GPoint object) as an argument to the event handler. If the click occurred on an overlay (discussed later), then the overlay is also passed in as an argument.
clearoverlays: Fires when the clearOverlays() method is called.
drag: Fires repeatedly while the user is dragging the map.
dragend: Fires when the user stops dragging the map.
dragstart: Fires when the user starts to drag the map.
infowindowclose: Fires when an info window closes.
infowindowopen: Fires when an info window opens.
load: Fires when the map is completely loaded.
maptypechanged: Fires when the map type changes (for example, from Map to Satellite).
mousemove: Fires when the cursor moves across the map; a GLatLng object indicating the last position of the mouse inside the map is passed in as an argument to the event handler.
mouseout: Fires when the cursor moves from the map to the outside of the map; a GLatLng object indicating the last position inside of the map is passed in as an argument to the event handler.
mouseover: Fires when the cursor moves onto the map from outside of the map; a GLatLng object indicating the mouse position on the map is passed in as an argument to the event handler.
move: Fires repeatedly as the map is moving.
moveend: Fires when the map stops moving.
movestart: Fires when the map begins to move.
removemaptype: Fires when a map type is removed from the map; supplies a maptype argument to the event handler.
removeoverlay: Fires when an overlay is removed; the overlay is passed in as an argument to the event handler.
zoomend: Fires when the map has stopped zooming; old zoom level and new zoom level are provided as arguments to the event handler.
These events can be used to monitor the user's interaction with the map at any particular time. Keep in mind that most objects on the map also support their own events.
10.3.8. Map Overlays
A map overlay is any graphical marker placed onto a map to indicate some geographic location. When using the Google Maps site, areas of interest are often indicated by an icon or some other marker placed directly on the map; these are examples of overlays.
There are three methods on the GMap2 object relating directly to overlays. The first is addOverlay(), which adds the specified overlay object to the map control. To add an overlay stored in a variable called oOverlay, the following code can be used:
oMap.addOverlay(oOverlay);
Of course, anything that can be added can also be removed, so the second method is removeOverlay(), which removes a specified overlay from the map. In order to remove a specific overlay, you need a reference to it (not unlike the way event handlers are removed). Once you have a reference, the method can be called like this:
oMap.removeOverlay(oOverlay);
It may not be practical to keep track of all the overlays used on a map, so it's also possible to remove all of the overlays using the third method, clearOverlays(). This method is called without any arguments:
oMap.clearOverlays();
This method removes all overlays added since the map was created. The Google Maps API provides several types of overlays that can be used with just a little configuration.
10.3.8.1. Markers
The simplest of the provided overlays are markers. Markers are the most commonly used indicator on the Google Maps web site: a red pushpin-like image that is based at a point of interest. A marker can be created by instantiating a GMarker object. The constructor of the GMarker accepts two arguments: a GLatLng object indicating where the marker should be set, and a configuration object containing additional information for the marker (this second argument is optional). Creating a simple marker can be done like this:
var oMarker = new GMarker(new GLatLng(32, −92));
This code creates a marker that can be added to the map at any time. The optional second argument specifies additional information for the marker and can be specified as an object literal with one or more of the following properties:
title: Text that should be displayed when the cursor is moved over the marker.
icon: An icon that should be used for the overlay instead of the default icon.
clickable: If false, disables click events for the marker; the default value is true.
draggable: When set to true, allows the marker to be dragged and repositioned by the user; the default value is false.
dragCrossMove: Set to true to force dragged markers to appear under the cursor instead of floating above; the default value is false. This setting only applies if draggable is true.
bouncy: Determines if a dragged marker should bounce when it's dropped; the default value is false.
bounceGravity: A number indicating the acceleration of the bounce when a marker is dropped. Only used when bouncy is set to true.
To create a marker whose tooltip text is "My marker", the code is as follows:
var oMarker = new GMarker(new GLatLng(32, −92), { title: "My marker" });This essentially sets the title attribute of the element used to represent the marker; it uses the default behavior to enable this functionality. It's also possible to change the icon displayed for the marker by using the icon option in the configuration object. This property's value must be a GIcon object.
10.3.8.1.1. Specifying an Icon
The GIcon object is used to specify icons that can be used in Google Maps. Though there are a number of properties, only three are required.
The first property is image, which specifies the URL of the image to display:
var oIcon = new GIcon();
oIcon.image = "flag.gif";
Next, the iconSize property must be provided. This value must be a GSize() object indicating the width and height of the image specified in the image property. The GSize() object constructor accepts two arguments, the width and height of the image in pixels. So, if the image is 26 pixels wide by 33 pixels high, the size is specified like this:
var oIcon = new GIcon();
oIcon.image = "flag.gif";
oIcon.iconSize = new GSize(26, 33);
The final required property is iconAnchor, which indicates what point on the image should be centered on the GLatLng location. This value is a GPoint object, which specifies an x and y coordinate of the image. To have the lower-left corner of the image appear at the coordinate on the map, the following code can be used:
var oIcon = new GIcon();
oIcon.image = "flag.gif";
oIcon.iconSize = new GSize(26, 33);
oIcon.iconAnchor = new GPoint(0, 33);
This code specifies the anchor to be at the point (0, 33) on the image, which is the lower-left corner. After adding this property, the GIcon object can be specified as part of a marker:
var oIcon = new GIcon();
oIcon.image = "flag.gif";
oIcon.iconSize = new GSize(26, 33);
oIcon.iconAnchor = new GPoint(0, 33);

var oMarker =  new GMarker(new GLatLng(32, −92), {title:"My marker", icon: oIcon});
oMap.addOverlay(oMarker);
There are other properties on a GIcon object that can be set, depending on your needs:
shadow: The URL for an image to use as the shadow of the marker. According to Google's documentation, this shadow should be at 45 degrees to stylistically agree with default shadows provided by the API.
shadowSize: A GSize object indicating the size of the shadow image.
infoWindowAnchor: A GPoint object indicating where info windows should be anchored within the icon. When you are opening an info window from a marker with an icon, this property must be specified. Info windows are discussed later in this chapter.
printImage: The URL of an image to use for the print version of the map. This image must be the same size as the one specified by image.
mozPrintImage: The URL of an image to use for the print version of the map in Mozilla-based browsers such as Firefox. This image must be the same size of the one specified by image.
printShadow: The URL of a shadow image to use for printed maps. This image must be the same size of the one specified by shadow.
transparent: The URL of a 24-bit PNG image with 1 percent opacity that has the same size and shape as the image specified by image. This is used by Internet Explorer to specify the clickable area of the marker.
10.3.8.1.2. Manipulating Markers
There are several methods available on marker objects that allow the manipulation of position and functionality as well as providing information about the marker. For instance, the GIcon object used for the marker can be returned via the getIcon() method, and the GLatLng object used to anchor the marker can be retrieved using getPoint():
var oIcon = oMarker.getIcon();
var oAnchor = oMarker.getPoint();
If the marker needs to be moved once it has been placed on the map, this can be done using the setPoint() method. This method accepts a GLatLng object that the marker should be moved to. For example:
oMarker.setPoint(new GLatLng(33, −91));
A call to setPoint() moves the marker immediately. There is no animation; the marker simply disappears from the first point and reappears at the second.
There are also several methods relating to draggable markers. The draggable() method returns true or false to indicate if the marker is draggable by the user. If it is, you can enable or disable dragging using enableDragging() and disableDragging(), respectively. When using these methods, the draggingEnabled() method returns true or false to indicate if the marker is enabled for dragging:
function toggleDraggable(oMarker) {
    if (oMarker.draggable()) {
        if (oMarker.draggingEnabled()) {
            oMarker.disableDragging();
        } else {
            oMarker.enableDragging();
        }
    }
}
This function toggles the draggability of a marker and illustrates the use of these methods. If the marker is capable of being dragged, then draggable() returns true, even if dragging is disabled. Then, draggingEnabled() indicates if the marker can currently be dragged. If it can, the dragging is disabled using disableDragging(); otherwise, it's enabled using enableDragging(). Note that for enableDragging() and disableDragging() to work, the marker must have been created using the draggable option.
10.3.8.1.3. Marker Info Windows
If an info window should be pointing to a specific marker on the map, the marker can open an info window itself by using its own versions of openInfoWindow(), openInfoWindowHtml(), openInfoWindowTabs(), openInfoWindowTabsHtml(), and showMapBlowup(). The difference is that these methods don't need to be passed a GLatLng object to indicate where the info window should be anchored; the marker itself is used as the anchor.
Each of these methods accepts one less argument than its GMap2 counterpart, meaning that openInfo Window() and openInfoWindowHtml() accept two arguments: the content (either a DOM node or HTML string, respectively) and an optional configuration object (only the maxWidth property is valid when using these methods). The openInfoWindowTabs() and openInfoWindowTabsHtml() methods also only accept two arguments: an array of GInfoWindowTab objects and an optional configuration object (only the maxWidth and selectedTab properties are valid when using this method). The showMapBlowup() method accepts only an optional configuration object (only zoomLevel and mapType are valid properties when using this method). Some basic examples:
oMarker.openInfoWindow(document.createTextNode("Marker info window"));

oMarker.openInfoWindowHtml("<em>Marker info window</em>", { maxWidth: 500 });

oMarker.showMapBlowup({ zoomLevel: 5, mapType: G_HYBRID_MAP });

oMarker.openInfoWindowTabsHtml([new GInfoWindowTab("Tab 1", "Tab 1 Content")]);

oMarker.openInfoWindowTabs(
    [new GInfoWindowTab("Tab 1", document.createTextNode("Tab 1 Content")),
     new GInfoWindowTab("Tab 2", document.createTextNode("Tab 2 Content"))],
    { selectedTab: 1});
10.3.8.1.4. Marker Events
As mentioned previously, most of the objects in the Google Maps API support events. Markers support a number of events that can be handled by custom event handlers:
click: Fires when the marker is clicked. This event bubbles to the containing GMap2 object.
dblclick: Fires when the marker is double-clicked. This event bubbles to the containing GMap2 object.
dragstart: Fires when the marker starts being dragged (only if the marker has draggable set to true).
drag: Fires when the marker is being dragged (only if the marker has draggable set to true).
dragend: Fires when the marker stops being dragged (only if the marker has draggable set to true).
infowindowopen: Fires when an info window is opened from the marker.
infowindowclose: Fires when the info window opened from the marker is closed.
mousedown: Fires when a mouse button is pressed down over the marker.
mouseup: Fires when a mouse button is released over the marker.
mouseout: Fires when the mouse is moved from over the marker to outside of the marker.
mouseover: Fires when the mouse is first moved over the marker.
remove: Fires when the marker is removed through removeOverlay() or clearOverlays().
To open an example when a marker is clicked, the following code can be used:
GEvent.addListener(oMarker, "click", function () {
    oMarker.openInfoWindowHtml("This is my marker.");
});
When the user clicks on this marker, an info window is displayed pointing right to the marker (an infowindowopen event is also fired). The map will scroll appropriately so that the entire info window can be displayed to the user. When this info window is closed, the infowindowclose event is fired, which can also be listened to:
GEvent.addListener(oMarker, "infowindowclose", function () {
    alert("Info window was closed.");
});
Note that the onOpenFn and onCloseFn properties of the configuration object cannot be used with info windows created from markers, so the infowindowopen and infowindowclose events must be used instead.
10.3.8.1.5. Using a Marker Manager
If a map contains a large number of markers, it's not always optimal to display every marker all the time. For instance, it would not make sense to show the weather for each individual city when the map of the entire United States is visible; it's just too much information to show at that level. To aid in this type of case, the Google Maps API provides the GMarkerManager object.
Generally speaking, a GMarkerManager object is used to determine which markers to display under what circumstances. Instead of adding markers to the GMap2 object, markers are added to a GMarkerManager object, which informs the GMap2 object when markers need to be displayed. To accomplish this, the GMarkerManager watches the zoom level and center of the map, checking for markers that need to be visible within the viewport.
To create a GMarkerManager, pass in a reference to the GMap2 object it should be working with. There is also a second optional argument, which is an object with one or more of the following properties:
borderPadding: The number of pixels outside of the viewable area that the manager should observe. This is a buffer area around the outside of the map within which markers are displayed so that there is no delay in their appearance when the map is panned.
maxZoom: The maximum zoom level (where 0 is the smallest value) monitored by the manager. If not specified, the manager monitors all zoom levels.
trackMarkers: Determines if the manager should keep track of markers that are moved either by users or by using the setPoint() method. The default value is false.
For example, the following code creates a marker manager that monitors 20 pixels outside of the viewport in each direction and all zoom levels up to 10:
var oManager = new GMarkerManager(oMap, { borderPadding: 20, maxZoom: 10 });Once the object is instantiated, markers can be added by using addMarker(), which accepts three arguments: the marker, a minimum zoom level that must be met before the marker is displayed, and an optional maximum zoom level beyond which the marker won't be displayed. If the last two arguments are omitted, it's assumed that the marker should be displayed at all zoom levels; if only the last argument is omitted, it's assumed that the marker should be shown for all zoom levels past the minimum. For example:
oManager.addMarker(new GMarker(new GLatLng(32, −92)), 3);
oManager.addMarker(new GMarker(new GLatLng(33, −91)), 5, 10);
This code specifies two markers on the map. The first marker is displayed only at zoom levels of 3 or greater, while the second is displayed only between zoom levels of 5 and 10. Typically, a range is specified for markers that represent regions. For instance, the weather going on in the northern part of a state should be shown only until the zoom level is such that individual cities can have their own weather markers (which would be more specific than the weather for the region).
There is also an addMarkers() method, which allows the addition of multiple markers using the same zoom level requirements. The addMarkers() method also accepts three arguments: the first is an array of markers as opposed to a single marker; the other arguments are the same as in addMarker() (the minimum zoom level and an optional maximum zoom level). For example:
oManager.addMarkers([
    new GMarker(new GLatLng(31, −93)),
    new GMarker(new GLatLng(33, −93))
], 7, 13);
Here, two markers are added that are displayed when the zoom level is between 7 and 13. If there are a number of markers that should be displayed using the same criteria, it is more efficient to use addMarkers() rather than individual calls to addMarker().
The final step after adding markers to the manager is to call the refresh() method. This method sets up the initial display of the map and sets up the necessary hooks to monitor the viewport. After calling refresh(), the manager handles all other viewport updates automatically. Make sure that this method is called after adding all of the markers:
oManager.addMarker(new GMarker(new GLatLng(32, −92)), 3);
oManager.addMarker(new GMarker(new GLatLng(33, −91)), 5, 10);
oManager.addMarkers([
    new GMarker(new GLatLng(31, −93)),
    new GMarker(new GLatLng(33, −93))
], 7, 13);
oManager.refresh();
Marker managers are best used for maps that show regional information with possible drilldowns into more local information. As previously discussed, a weather map is a good candidate for using a marker manager.
10.3.8.2. Polylines
A polyline is a line that overlays the map, connecting two or more geographic points. On the Google Maps site, polylines are frequently used to show the route between two locations. Polylines, however, need not be created strictly along roadways; in fact, polylines can be placed anywhere on the map.
Polylines are implemented differently depending on the capabilities of the browser being used, so before using them, it's necessary to ensure that all of the necessary information is present in the page. In Internet Explorer, Vector Markup Language (VML) is used to draw polylines, and this requires inclusion of the Microsoft VML namespace and the definition of a VML CSS rule:
<!DOCTYPE html PUBLIC "-//W3C//DTD XHTML 1.0 Transitional//EN"
    "http://www.w3.org/TR/xhtml1/DTD/xhtml1-transitional.dtd">
<html xmlns="http://www.w3.org/1999/xhtml" xmlns:v="urn:schemas-microsoft-com:vml">
  <head>
      <style type="text/css">
v:* {
behavior:url(#default#VML);
}
</style>
</head>
<body>
<!-- page body -->
</body>
</html>Including these sections of code ensures that polylines will work appropriately in Internet Explorer; this code is safely ignored in other browsers.
Polylines can be added to the map by creating GPolyline objects and adding them to the map via the addOverlay() method. The GPolyline constructor accepts four arguments: an array of GLatLng objects indicating two or more vertices for the polyline, an optional string indicating the color of the line, an optional number indicating the weight of the line (how many pixels wide it is), and an optional floating point number (decimal between 0 and 1) indicating the opacity of the line. Here's a simple example:
var oPolyline = new GPolyline([
    new GLatLng(40.758224, −73.917404),
    new GLatLng(34.101509, −118.32691)
], "#f00", 10);

oMap.addOverlay(oPolyline);
The first point in this example corresponds to the corner of 42nd Street and Broadway in New York while the second is the corner of Hollywood and Vine in Los Angeles. The line created is red ("#f00" is the hexadecimal shorthand code for red) and 10 pixels wide. Effectively, this code creates a diagonal line across the United States (see Figure 10-6).
Figure 10.6. Figure 10-6

The more points provided for the polyline, the more turns the line takes. When there are more than two points, the order in which they are presented is important, since the line is drawn from the first point to the second, from the second to the third, and so on.
Once a polyline is created, you can get information about it via two methods: getVertexCount() and getVertex(). The getVertexCount() method returns the number of vertices in the polyline (the number of points provided). The getVertex() method accepts a single argument, which is the index of the vertex to retrieve (0 for the first vertex, 1 for the second, etc.), and returns a GLatLng object with the vertex information. For example:
alert("Number of vertices: " + oPolyline.getVertexCount());
alert("First vertex: " + oPolyline.getVertex(0));
This simple example outputs the number of vertices and the first vertex in the polyline. Essentially, these two methods are used to retrieve the information that was first passed in when the polyline was created.
As with markers, polylines can be removed from the map at any time using the removeOverlay() or clearOverlays() methods.
10.3.9. Additional Information
The Google Maps API is actually quite extensive, and it is beyond the scope of this book to point out all the details. However, you should be aware that the API contains many more objects and features than are discussed in this book; the information presented here is intended to be a jumping-off point only. Google maintains documentation for the API online at http://www.google.com/apis/maps/documentation/. The documentation includes a complete class reference for all of the API's objects as well as detailed examples for various features. Additionally, the Wrox book Google Maps Mashups (Wiley 2007) contains extensive examples and information on building mashups using the Google Maps API.