
Pollution Characteristics of Industrial Construction and Demolition Waste
Abstract
Different types of industrial construction and demolition wastes in various places were collected. The mercury content varies much overall, whereas the wastes from the chemical industry contain most due to the mercury-containing raw materials used. Waste from the light industry poses a high risk of Cd. Residential wastes and recycled aggregates exhibit a low ecological risk. The mobility fractions of heavy metals can be very high; most anthropogenic polluted metals bind loosely with minerals in construction waste. The metals easiest to be leached are Zn and Cu, whereas Cd is the hardest. A high Cd content exists in pesticide manufacturing factory, mainly coming from phosphorus rocks. These wastes are also severely contaminated by organophosphorus, intermediates, and pyrethroid pesticide. Pesticides spread all over the plant both in enclosed workshops and in residues, in which bricks and coatings contain the most. Centralized collection for disposal of wastes can only eliminate part of the contaminated waste. Risk assessment indicates that highly noncarcinogenic risks exist, especially in dermal contact and oral ingestion. Industrial construction and demolition waste generated in a fire/explosion accident may be hazardous and cause spread of pollution with explosion shock waves.
Keywords
4.1. Mercury and Its Distribution in Construction and Demolition Waste
4.1.1. Distribution Characteristics of Mercury
Table 4.1
Brief Description of the Samples Involved in This Section
| Type | Name | Environment |
| Chemical industry | Chemical industry | Wall, coatings in workshops |
| Electroplating factory | Workshops | |
| Paint factory | Wall, floor in workshops | |
| Glaze Technology Co., Ltd. | Wall, floor in workshops | |
| Incineration plant for hazardous waste | Wall, floor in workshops | |
| Metallurgical industry | Zinc smelting plant | Electrolysis, cleaning workshops |
| Abandoned steel mill | Boiler workshops | |
| Steel plant | Walls in workshops | |
| Steel plant | Boiler workshops | |
| Light industry | Rubber factory | Workshops |
| Light industry base | Walls in workshops | |
| Pesticide industry | Pesticide manufacturing plant | Warehouses, workshops |
| Fire/explosion | Fire and explosion scene | Floor waste |
| Residential aggregates | University canteen | Bricks, wall |
| Temporary dump sites | Bricks, wall | |
| Recycled aggregates | Building materials company | Concrete, clay |
| Earthquake C&D waste | Coarse and fine aggregate |


4.1.2. Single Factor Evaluation of Mercury Pollution
Table 4.2
Statistical Characteristics of Mercury Contents of C&D Wastes From Different Sources
| Industry | Sampling Number | Maximum (μg/kg) | Minimum (μg/kg) | Mean (μg/kg) | Standard Deviation | Contamination Index |
| CI | 10 | 1542.83 | 16.88 | 669.27 | 525.77 | 2.23 |
| MI | 38 | 620.52 | 6.84 | 61.37 | 110.91 | 0.20 |
| LI | 6 | 506.44 | 6.46 | 112.16 | 194.51 | 0.37 |
| RS | 5 | 156.73 | 24.59 | 75.97 | 50.95 | 0.25 |
| RC | 4 | 179.11 | 23.52 | 78.90 | 70.57 | 0.26 |
| Total | 63 | 1542.83 | 6.46 | 164.97 | 316.09 | 0.55 |

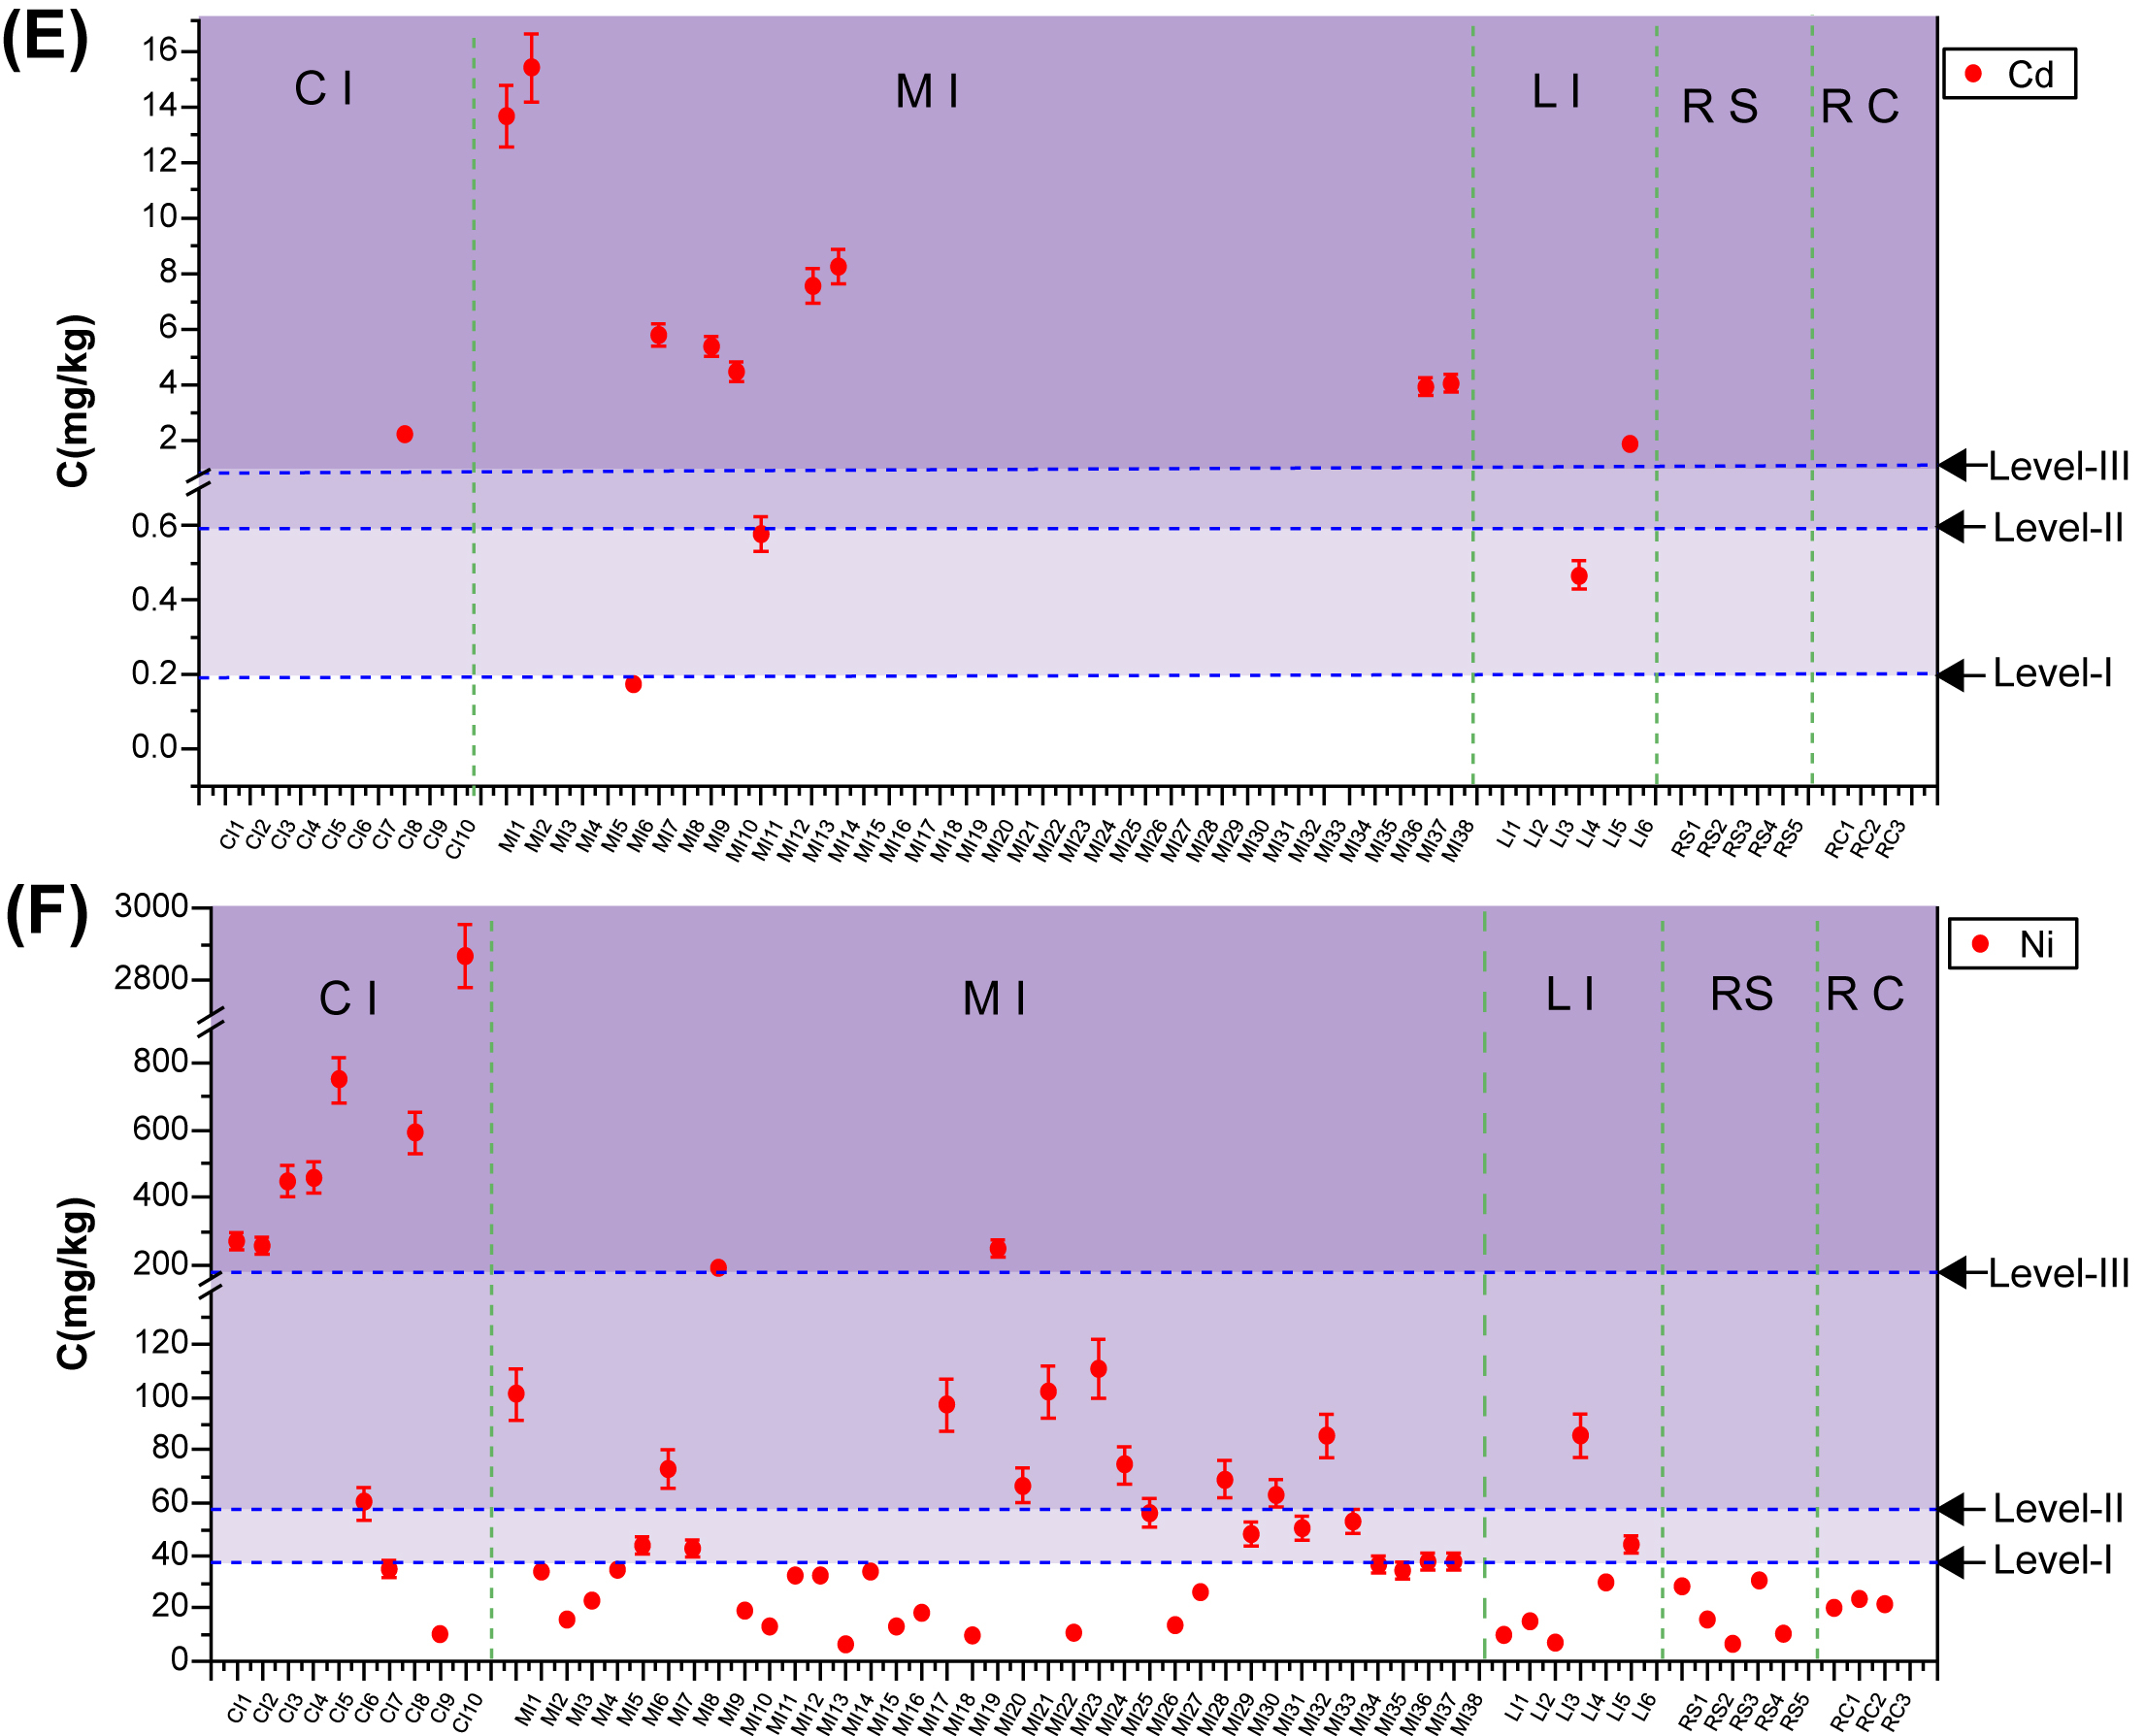
4.2. Characterization of Cu/Zn/Pb/Cr/Cd/Ni in Industrial C&D Waste
4.2.1. Total Concentrations of Heavy Metals in C&D Waste
Table 4.3
Total Heavy Metal Concentrations in C&D Waste Samples From Five Sources
| Heavy Metal (mg/kg) | ||||||
| Sample | Cu | Zn | Pb | Cr | Cd | Ni |
| CI | 6310 ± 18,700a | 911 ± 969 | 82 ± 129 | 943 ± 912 | 2.24 ± 0.22 | 573 ± 843 |
| (296%)b | (106%) | (159%) | (97%) | (10%) | (147%) | |
| MI | 204 ± 602 | 3340 ± 5710 | 201 ± 318 | 232 ± 222 | 6.3 ± 4.8 | 54.2 ± 49.4 |
| (296%) | (171%) | (158%) | (95%) | (76%) | (91%) | |
| LI | 50.7 ± 35.2 | 128 ± 53 | 20.5 ± 9.2 | 95.5 ± 67.5 | 1.18 ± 1.01 | 31.9 ± 29.7 |
| (69%) | (41%) | (45%) | (71%) | (86%) | (93%) | |
| RS | 35.9 ± 9.3 | 704 ± 289 | 23.7 ± 8.3 | 95.0 ± 91.3 | NDc | 18.0 ± 11.0 |
| (26%) | (41%) | (35%) | (96%) | (61%) | ||
| RC | 24.6 ± 2.9 | 906 ± 538 | 23.3 ± 3.8 | 70.7 ± 12.8 | ND | 21.3 ± 1.8 |
| (12%) | (59%) | (16%) | (18%) | (8.6%) | ||
| Average | 1130 ± 7490 | 2280 ± 4520 | 141 ± 265 | 311 ± 406 | 5.28 ± 4.67 | 131 ± 380 |
| Max | 59,400 | 49,300 | 1260 | 7510 | 15.4 | 2870 |
| Min | 4.43 | 17.7 | ND | 10.1 | ND | 5.29 |
| De/And | 63/63 | 63/63 | 59/63 | 63/63 | 14/63 | 63/63 |
| TVHMe | 35 | 100 | 35 | 90 | 0.2 | 40 |
| TVHMf | 100 | 250 | 300 | 200 | 0.6 | 60 |
| TVHMg | 400 | 500 | 500 | 300 | 1 | 200 |


4.2.2. X-Ray Fluorescence Analysis of Heavy Metals in C&D Waste
Table 4.4
Main Mineral Constituent of C&D Waste Samples According to the Xrf Analysis Presented as % W/W Content of Mineral Oxides
| Sample | SiO2 | Al2O3 | Fe2O3 | MgO | CaO | K2O | Na2O |
| CI-7 | 60.491 | 18.865 | 7.638 | 1.398 | 1.122 | 2.521 | 1.321 |
| CI-8 | 30.162 | 4.563 | 1.528 | 0.712 | 14.039 | 0.701 | 0.074 |
| CI-9 | 48.307 | 6.521 | 1.745 | 0.456 | 15.091 | 1.047 | 0.601 |
| CI-10 | 49.552 | 7.137 | 1.678 | 0.389 | 11.107 | 2.191 | 0.858 |
| MI-1 | 2.985 | 1.865 | 0.981 | 0.219 | 1.878 | 1.993 | 76.451 |
| MI-2 | 2.359 | 1.227 | 2.385 | 0.133 | 1.184 | 2.142 | 73.901 |

4.2.3. X-Ray Diffraction Analysis of Heavy Metals in C&D Waste

4.2.4. Chemical Speciation of Heavy Metals in C&D Waste
![]()
Table 4.5
Content Distributions of Each Fraction of Heavy Metals in Construction and Demolition Waste Samples (mg/kg)
| Sample | Element | F1 | F2 | F3 | F4 | ∑F | Totala | Recovery (%)b | RAC (%)c |
| CI-7 | As | NDd | ND | ND | 29.66 ± 2.21 | 29.66 ± 2.48 | 30.80 ± 2.75 | 96.29 | ND |
| Fe | 550.76 ± 35. 56 | 619.08 ± 45.24 | 137.23 ± 12.27 | 17,448.72 ± 1310.83 | 18,755.77 ± 1648.63 | 17,945.38 ± 1361.5 | 104.52 | 2.94 | |
| Mn | 16.43 ± 1.15 | 4.50 ± 0.29 | ND | 875.40 ± 72.28 | 896.33 ± 72.64 | 878.69 ± 71.96 | 102.01 | 1.83 | |
| CI-8 | As | ND | 76.83 ± 6.36 | 30.17 ± 2.37 | 29.41 ± 2.74 | 136.42 ± 11.34 | 132.50 ± 12.23 | 102.96 | ND |
| Fe | 364.15 ± 28.14 | 5993.08 ± 464.29 | 707.79 ± 67.39 | 3883.30 ± 261.97 | 10,948.31 ± 998.92 | 12,278.84 ± 1196.4 | 89.16 | 3.33 | |
| Mn | 51.48 ± 4.06 | 30.65 ± 2.91 | 2.73 ± 0.19 | 89.49 ± 7.29 | 174.35 ± 14.59 | 167.46 ± 14.64 | 104.11 | 29.53 | |
| CI-9 | As | ND | ND | ND | 18.81 ± 1.65 | 18.81 ± 1.65 | 18.84 ± 1.56 | 99.86 | ND |
| Fe | 451.19 ± 32.16 | 4881.86 ± 354.29 | 864.36 ± 76.10 | 5370.45 ± 478.93 | 11,567.86 ± 1030.29 | 10,847.08 ± 988.33 | 106.64 | 3.90 | |
| Mn | 15.88 ± 1.06 | 91.18 ± 8.38 | 15.99 ± 1.43 | 166.28 ± 14.21 | 289.34 ± 23.68 | 292.23 ± 22.79 | 99.01 | 5.49 | |
| CI-10 | As | ND | ND | ND | 17.46 ± 1.42 | 17.46 ± 1.42 | 17.21 ± 1.38 | 101.50 | ND |
| Fe | 1654.47 ± 117.25 | 4951.48 ± 378.35 | 421.76 ± 31.38 | 4767.28 ± 387.41 | 11,794.99 ± 931.29 | 11,098.99 ± 878.94 | 106.27 | 14.03 | |
| Mn | 136.50 ± 10.03 | 101.40 ± 9.32 | 0.74 ± 0.05 | 163.22 ± 14.01 | 401.85 ± 34.72 | 423.93 ± 41.34 | 94.79 | 33.97 | |
| MI-1 | As | 4.61 ± 0.26 | 29.30 ± 2.39 | 53.07 ± 4.93 | 63.38 ± 5.32 | 150.36 ± 13.97 | 155.09 ± 12.19 | 96.95 | 3.06 |
| Fe | 31.57 ± 2.37 | 584.19 ± 32.91 | 595.30 ± 46.09 | 3696.13 ± 268.36 | 4907.18 ± 489.78 | 5288.42 ± 469.35 | 92.79 | 0.64 | |
| Mn | 46.58 ± 3.96 | 76.57 ± 5.97 | 38.70 ± 2.72 | 46.65 ± 3.96 | 208.50 ± 18.93 | 214.04 ± 19.17 | 97.41 | 22.34 | |
| MI-2 | As | 33.33 ± 2.12 | 34.99 ± 2.87 | 0.58 ± 0.07 | 138.75 ± 12.27 | 207.65 ± 16.26 | 232.31 ± 21.82 | 89.39 | 16.05 |
| Fe | 65.97 ± 4.09 | 727.70 ± 36.47 | 395.31 ± 29.26 | 9696.55 ± 876.21 | 10,885.53 ± 983.02 | 11,962.41 ± 864.38 | 91.00 | 0.61 | |
| Mn | ND | 62.50 ± 4.27 | 13.75 ± 1.25 | 81.04 ± 6.09 | 157.28 ± 12.33 | 166.17 ± 15.19 | 94.65 | ND |


4.2.5. Risk Assessment Code of Heavy Metals in Most Polluted Waste
Table 4.6
Speciation Analysis of Heavy Metals in Construction and Demolition Waste
| Sample | Speciation | Zn (mg/kg) | Cu (mg/kg) | Cr (mg/kg) | Ni (mg/kg) | Pb (mg/kg) |
| 1. Zn workshop from an electroplating factory | Acid extractable fraction | 1568.57 | 14.15 | – | – | – |
| Reducible fraction | 289.79 | – | – | – | – | |
| Oxidizable fraction | 313.10 | 3.99 | – | – | – | |
| Residual fraction | 13.79 | 5.24 | 12.44 | 3.75 | 3.63 | |
| Total | 2185.26 | 23.38 | 12.44 | 3.75 | 3.63 | |
| 2. Cu workshop from an electroplating factory | Acid extractable fraction | 3014.30 | 31,720.20 | – | 255.17 | – |
| Reducible fraction | 799.28 | 15,473.30 | 6.11 | 180.49 | – | |
| Oxidizable fraction | 112.68 | 356.12 | 4.29 | 129.67 | – | |
| Residual fraction | 2.84 | 3.52 | 8.46 | 8.54 | 0.69 | |
| Total | 3929.10 | 47,553.14 | 18.87 | 573.87 | 0.69 | |
| 3. Cr workshop from an electroplating factory | Acid extractable fraction | 133.42 | 155.57 | 5424.78 | – | – |
| Reducible fraction | 151.38 | 164.02 | 1064.09 | – | 46.28 | |
| Oxidizable fraction | 1.33 | – | 565.11 | – | – | |
| Residual fraction | 3.20 | 1.90 | 40.93 | 1.023 | 1.74 | |
| Total | 289.33 | 321.49 | 7094.91 | 1.023 | 48.02 | |
| 4. Ni workshop from an electroplating factory | Acid extractable fraction | 192.72 | 983.35 | 70.08 | 648.16 | – |
| Reducible fraction | 93.61 | 1047.95 | 38.63 | 1818.15 | 52.65 | |
| Oxidizable fraction | 31.64 | 1019.50 | 28.30 | 164.01 | – | |
| Residual fraction | 2.74 | 7.74 | 21.01 | 3.85 | 1.07 | |
| Total | 320.71 | 3058.54 | 158.02 | 2634.17 | 53.72 | |
| 5. Electrolysis section in a zinc factory | Acid extractable fraction | 17,133.68 | 290.02 | – | – | 21.24 |
| Reducible fraction | 20,194.2 | 1063.25 | 1.67 | 6.57 | 156.98 | |
| Oxidizable fraction | 17,588.25 | 1200.81 | 44.41 | 44.71 | 218.20 | |
| Residual fraction | 79.35 | 6.45 | 4.04 | 2.25 | 4.54 | |
| Total | 54,995.48 | 2560.53 | 50.12 | 53.53 | 400.96 | |
| Table Continued | ||||||

| Sample | Speciation | Zn (mg/kg) | Cu (mg/kg) | Cr (mg/kg) | Ni (mg/kg) | Pb (mg/kg) |
| 6. Cleaning section in a zinc factory | Acid extractable fraction | 13,353.54 | 28.34 | – | – | 53.98 |
| Reducible fraction | 17,563.98 | 317.78 | – | – | 451.95 | |
| Oxidizable fraction | 1842.60 | 97.62 | 12.57 | – | 244.23 | |
| Residual fraction | 53.89 | 5.11 | 1.93 | 0.61 | 13.79 | |
| Total | 32,814.01 | 448.85 | 14.50 | 0.61 | 763.95 | |
| 7. Laboratory simulation | Acid extractable fraction | 103.03 | 514.07 | 242.69 | – | 501.58 |
| Reducible fraction | 12.53 | 55.53 | 162.26 | – | 131.96 | |
| Oxidizable fraction | 13.62 | – | 343.45 | – | – | |
| Residual fraction | 4.85 | 2.53 | 27.06 | 1.77 | 0.78 | |
| Total | 134.03 | 572.13 | 775.46 | 1.77 | 634.32 |


4.3. Leaching Toxicity of C&D Waste From Different Sources
4.4. Characteristics of Organic Pollutants in Multicontaminated Industrial C&D Waste
Table 4.7
Leaching Toxicity of Heavy Metals in C&D Waste From Different Industries
| Heavy metal (mg/L) | |||||||
| Sample | Cu | Zn | Pb | Cr | Cd | Ni | As |
| CI | 0.48 ± 1.31a (273%)b | 0.82 ± 1.81 (221%) | NDc | 45.54 ± 142.16 (312%) | ND | 0.18 ± 0.57 (317%) | 0.01 ± 0.03 (300%) |
| MI | 0.16 ± 0.30 (188%) | 3.15 ± 6.34 (201%) | 0.34 ± 1.56 (459%) | 0.01 ± 0.04 (400%) | 0.02 ± 0.11 (550%) | 0.07 ± 0.18 (257%) | 0.11 ± 0.53 (482%) |
| LI | ND | ND | ND | ND | ND | ND | ND |
| RS | ND | ND | ND | 0.07 ± 0.15 (214%) | ND | ND | 0.01 ± 0.03 (300%) |
| RC | ND | ND | ND | ND | ND | ND | ND |
| Average | 0.17 ± 0.57 | 1.97 ± 5.06 | 0.2 ± 1.19 | 7.36 ± 57.15 | 0.01 ± 0.09 | 0.08 ± 0.28 | 0.07 ± 0.41 |
| Max | 4.19 | 27.84 | 9.18 | 450.10 | 0.67 | 1.80 | 3.09 |
| Min | ND | ND | ND | ND | ND | ND | ND |
| De/And | 22/62 | 23/62 | 6/62 | 9/62 | 2/62 | 13/62 | 5/62 |
| Standards for drinking water qualitye | 1.0 | 1.0 | 0.01 | 0.05 | 0.005 | 0.02 | 0.05 |
| Environmental quality standards for surface water (Level-III)f | 1.0 | 1.0 | 0.05 | 0.05 | 0.005 | – | 0.05 |
| Integrated wastewater discharge standardg | 2.0 | 5.0 | 1.0 | 1.5 | 0.1 | 1.0 | 0.5 |
| Standard for pollution control on the security landfill site for hazardous wastesh | 75 | 75 | 5 | 12 | 0.5 | 15 | 2.5 |
| Identification standards for hazardous wastesi | 100 | 100 | 5 | 15 | 1 | 5 | 5 |


4.4.1. PAH Existence and Its Distribution
Table 4.8
Distribution of Polycyclic Aromatic Hydrocarbons (PAHs) in Industrial Construction and Demolition Waste, mg/kg
| PAHs | Waste 1 | Waste 2 | Waste 3 | Waste 4 | Waste 5 | Waste 6 |
| Naphthalene | 0.08 | 0.07 | – | 0.71 | 0.01 | 0 |
| Acenaphthylene | 0.04 | 0.13 | 0.02 | – | 0.03 | 0.14 |
| Acenaphthene | – | – | – | – | – | 0.04 |
| Fluorene | 0.08 | 0.18 | 0.13 | – | 0.05 | 0.53 |
| Philippines | 0.82 | 2.38 | 1.26 | 13.29 | 0.91 | 5.25 |
| Anthracene | 0.08 | 0.25 | – | 12.76 | 0.10 | 0.74 |
| Fluoranthene | 0.68 | 3.08 | 0.74 | 3.55 | 0.70 | 10.26 |
| Pyrene | – | 1.91 | – | – | – | 7.57 |
| Benzo(a)anthracene | 0.36 | 0.863 | 0.36 | 0.34 | 0.43 | 3.72 |
| Chrysene | 3.25 | 1.67 | 0.32 | 0.14 | 0.41 | 5.43 |
| Benzo(j)fluoranthene | 1.34 | 1.43 | 1.20 | – | 1.17 | 2.35 |
| Benzo(e)pyrene | 2.09 | 0.59 | 0.54 | 0.56 | 0.62 | 4.74 |
| Benzo(b)fluoranthene | 0.68 | 0.52 | 0.52 | 0.98 | 0.58 | 4.70 |

4.4.2. Existence of Volatile Organic Compounds in Industrial Waste From Pesticide Manufacturing Plants
4.4.3. A Comprehensive Study on Characterization of Organophosphorus Pesticides-Contaminated Waste
Table 4.9
Existence of Volatile Organic Compounds (VOCs) in Industrial Construction and Demolition Waste
| VOCs | Unit | Detection Limit | Waste 1 | Waste 2 | Waste 3 | Waste 4 |
| Total Petroleum Hydrocarbon | ||||||
| C6-C9 | mg/kg | 0.5 | – | – | 85.2 | – |
| C10-C14 | 10 | 16 | – | 44 | 15 | |
| C15-C28 | 20 | 276 | 53 | 477 | 451 | |
| C29-C36 | 20 | 130 | 55 | 451 | 513 | |
| Substitutes | ||||||
| Toluene-d8 | mg/kg | – | 97 | 98 | 98 | 96 |
| 4-Bromo-fluorobenzene | – | 96 | 99 | 88 | 98 | |
| Dichlorofluoromethane | – | 116 | 113 | 111 | 118 | |
| p-Terphenyld14 | – | 120 | 92 | 100 | 73 | |
| Monocyclic Aromatic Hydrocarbons | ||||||
| Benzene | mg/kg | 0.05 | – | – | 0.39 | – |
| Toluene | 0.05 | – | – | 0.07 | – | |
| p-Xylene | 0.05 | 0.13 | – | |||
| o-Xylene | 0.05 | 0.08 | – | |||
| Chlorinated Aliphatic Hydrocarbons | ||||||
| 1,1-Dichloroethane | mg/kg | 0.05 | – | – | 0.34 | – |
| 1,2-Dichloroethane | 0.05 | – | 0.13 | 64.2 | 0.08 | |
| 1,1,2-Trichloroethane | 0.05 | – | – | 0.39 | – | |
| Halogenated Aromatic Hydrocarbons | ||||||
| Chlorobenzene | mg/kg | 0.05 | – | – | 3.06 | – |
| Dichlorotoluene | 0.05 | – | – | 0.23 | – | |


Table 4.10
Sources and Brief Properties of Construction and Demolition Waste
| Item | Material | Location | Property | Odor |
| WS-1 | Coatings | Workshop | Flat block | Extreme |
| WS-2 | Coatings | Workshop | Flat block (larger) | Extreme |
| WS-3 | Concrete, coatings | Workshop | Flat block | Mild |
| WS-4 | Concrete | Workshop | Flat block | Mild |
| BK-1 | Brick | Centralized stack field | Block | Strong |
| BK-2 | Brick | Centralized stack field | Block | Strong |
| BK-3 | Brick | Random stack field | Large block (wrapped by clay) | Strong |
| BK-4 | Brick | Workshop, stack | Large block | Extreme |
| BK-5 | Brick | Workshop, stack | Large block | Mild |
| BK-6 | Brick | Workshop, stack | Large block | Strong |
| BK-7 | Brick, detritus | Random stack field | Block | Mild |
| BK-8 | Brick, detritus | Near pool | Block | Strong |
| WD-1 | Wood | Warehouse | Large block | Mild |
| DS-1 | Detritus | Random stack field | Small block, loose | None |
| DS-2 | Concrete, brick, detritus | Workshop | Block | Strong |
| DS-3 | Detritus, concrete | Random stack field | Small block | Mild |
| DS-4 | Detritus | Neutralization department | Block, brittle | None |
| DS-5 | Concrete, brick | Absorption tank | Moist, solid | None |
| DS-6 | Detritus | Workshop, stack | Block | Strong |
| GT-1 | Detritus, stone | Tank | Moist, hard block | Strong |

4.4.4. Existence of Organophosphorus Pesticides in C&D Waste From Exterior Plant
Table 4.11
Mean (±Standard Deviation) Concentration of Pesticide Pollutants (mg/kg) in Construction and Demolition Waste From the Pesticide Manufacturing Plant
| Samples | Organophosphorus Pesticide | Pyrethroid | |||||||||
| O,O,O-Triethyl Phosphorothioate | O,O'-Diethyl Dithiophosphate | Phorate | Parathion | Terbufos | Ethion | Chlorpyrifos | Sulfotep | Cholrmephos | Phorate Sulfone | Cypermethrin | |
| WS-1 | 32.4 ± 1.6 | 163.2 ± 28.7 | 1221 ± 92 | 46.5 ± 33.4 | 5.7 ± 0.5 | 7.3 ± 0.4 | Undetected (UD) | 0.7 ± 1.3 | UD | 20.3 ± 1.0 | UD |
| WS-2 | 574.1 ± 35.9 | 2578 ± 156 | 1886 ± 139 | 966.4 ± 86.9 | 349.2 ± 17.8 | 13.9 ± 1.4 | UD | UD | UD | 17.2 ± 0.3 | UD |
| WS-3 | 424.3 ± 53.5 | 5705 ± 150 | 73,057 ± 23,819 | 35,098 ± 2403 | UD | 120.9 ± 4.2 | UD | 383.3 ± 42.5 | UD | UD | 139.3 ± 35.4 |
| WS-4 | 7.2 ± 0.7 | 47.1 ± 4.4 | 386.5 ± 44.9 | 21.8 ± 1.9 | 4.6 ± 0.1 | UD | UD | UD | UD | UD | UD |
| BK-1 | 215.0 ± 10.4 | 3053 ± 187 | 69,734 ± 1718 | 153.1 ± 36.7 | 37.9 ± 0.8 | 88.0 ± 1.5 | 1431 ± 111 | 154.2 ± 9.2 | UD | 71.6 ± 4.7 | 169.8 ± 64.9 |
| BK-2 | 489.5 ± 47.0 | 4515 ± 435 | 82,327 ± 10,457 | UD | UD | 197.2 ± 81.7 | 1919 ± 486 | 178.6 ± 20.8 | UD | 171.3 ± 19.2 | 385.0 ± 142.2 |
| BK-3 | 2764 ± 713 | 11,699 ± 2548 | 20,207 ± 4368 | 8544 ± 2442 | 1933 ± 359 | UD | UD | 374.4 ± 56.3 | UD | UD | UD |
| BK-4 | 0.6 ± 0.6 | 4126 ± 2287 | 790.4 ± 371.1 | 67,807 ± 39,114 | 448.4 ± 251.2 | UD | UD | 265.6 ± 153.3 | UD | UD | UD |
| BK-5 | 10.0 ± 1.5 | 200.3 ± 17.0 | 112.9 ± 5.8 | 105.6 ± 21.7 | 8.7 ± 0.3 | UD | UD | 4.3 ± 0.4 | UD | UD | UD |
| BK-6 | 26.8 ± 18.6 | 380.7 ± 164.6 | 1102 ± 729 | 233.0 ± 47.6 | 42.9 ± 18.2 | UD | UD | 8.4 ± 3.2 | UD | UD | UD |
| BK-7 | 377.3 ± 36.9 | 18,749 ± 3315 | 2582 ± 422 | 12,003 ± 4413 | UD | 20.5 ± 0.4 | UD | 173.5 ± 27.9 | UD | UD | UD |
| BK-8 | 8.9 ± 7.2 | 668.1 ± 344.4 | 261.9 ± 28.6 | 3849 ± 2163 | 6.1 ± 4.7 | UD | UD | 25.5 ± 26.7 | UD | UD | UD |
| WD-1 | 64.7 ± 9.9 | 237.7 ± 27.2 | 352.5 ± 169.8 | 106.7 ± 50.8 | 23.5 ± 2.8 | UD | UD | UD | UD | UD | UD |
| DS-1 | 162.3 ± 9.2 | 438.5 ± 41.7 | 734.6 ± 30.5 | 462.5 ± 78.6 | 60.9 ± 5.9 | 7.8 ± 1.0 | UD | 10.3 ± 0.8 | UD | 16.5 ± 0.2 | 29.5 ± 14.7 |
| DS-2 | 16.3 ± 6.2 | 153.7 ± 14.3 | 890.0 ± 70.7 | 50.3 ± 1.7 | 15.2 ± 0.1 | UD | UD | UD | UD | 54.7 ± 1.1 | 2865 ± 251 |
| DS-3 | UD | 166.4 ± 7.9 | 152.1 ± 13.3 | 64.5 ± 9.0 | 18.1 ± 8.1 | UD | UD | UD | UD | UD | UD |
| DS-4 | 176.5 ± 29.6 | 379.8 ± 49.4 | 380.5 ± 49.2 | 69.7 ± 25.1 | 16.9 ± 1.4 | UD | UD | UD | UD | UD | UD |
| DS-5 | 0.8 ± 1.4 | 116.9 ± 4.7 | 514.4 ± 56.2 | 118.1 ± 7.2 | 22.5 ± 0.8 | UD | UD | 3.4 ± 3.0 | UD | UD | UD |
| DS-6 | 82.3 ± 8.4 | 886.9 ± 51.4 | 4473 ± 211 | 158.7 ± 14.4 | 17.9 ± 0.8 | 25.0 ± 2.4 | UD | 3.6 ± 3.1 | UD | UD | UD |
| GT-1 | 336.7 ± 78.6 | 10,834 ± 3084 | 76,196 ± 15,701 | 575.3 ± 581.1 | 387.5 ± 9.8 | 584.6 ± 32.1 | UD | 108.4 ± 39.2 | 579.4 ± 134.2 | 1875 ± 1133 | UD |
| Average | 288.5 | 3254 | 16,868 | 6521 | 170.0 | 53.3 | 167.5 | 80.8 | 29.0 | 111.3 | 179.4 |
| Maximum | 2764 | 18,749 | 82,327 | 67,807 | 1933 | 585.2 | 1919 | 383.9 | 692.1 | 3163 | 3155 |
| Minimum | UD | 47.1 | 112.9 | UD | UD | UD | UD | UD | UD | UD | UD |


4.4.5. Distribution and Possible Sources of Organic Pollutants Based on Practical and Statistical Analysis
Table 4.12
Existence of Organic Pesticides in Construction and Demolition (C&D) Waste From the Exterior Plant (mg/kg)
| Organic Pollutants | C&D Waste 1 | C&D Waste 2 | C&D Waste 3 | C&D Waste 4 |
| Parathion | <0.01 | <0.01 | <0.01 | <0.01 |
| Terbufos | <0.01 | 4.17 | 2.39 | <0.01 |
| Phorate | 82.3 | <0.01 | <0.01 | 54.8 |
| Phorate sulfone | <0.01 | <0.01 | <0.01 | <0.01 |
| Phorate sulfoxide | <0.005 | <0.005 | <0.005 | <0.005 |
| Cyanthoate | <0.01 | <0.01 | 0.04 | 0.25 |
| Sulfotep | <0.01 | 0.54 | 0.75 | <0.01 |
| Ethion | <0.01 | <0.01 | <0.01 | <0.01 |
| Fenthion | <0.005 | <0.005 | <0.005 | <0.005 |
| Synergistic phosphorus | 9.17 | 17.22 | 10.59 | 34.17 |
| Dichlorvos | 1074 | 839 | 947 | 1059 |
| Triethyl phosphorothioate | <0.01 | <0.01 | <0.01 | <0.01 |


Table 4.13
Concentration of Phorate in Gaseous and Water Samples
| Samples | Gas Sample (μg/m3) | Water Sample (mg/L) | ||||||
| GS-1 | GS-2 | GS-3 | GS-4 | GS-5 | GS-6 | WT-1 | WT-2 | |
| Phorate | UD | 1.07 | 0.25 | UD | 0.41 | 3.65 | UD | 2.57 ± 0.74 |

Table 4.14
Pearson Correlations (r) and the Associated p Values for Organic Pollutants
| O,O,O-Triethyl Phosphorothioate | O,O'-Diethyl Dithiophosphate | Phorate | Parathion | Terbufos | Ethion | Chlorpyrifos | Sulfotep | Cholrmephos | Phorate Sulfone | |
| O,O′-Diethyl dithiophosphate | 0.535 | |||||||||
| 0.015 | ||||||||||
| Phorate | 0.106 | 0.326 | ||||||||
| 0.658 | 0.161 | |||||||||
| Parathion | −0.096 | 0.064 | −0.078 | |||||||
| 0.686 | 0.789 | 0.745 | ||||||||
| Terbufos | 0.928 | 0.447 | −0.031 | 0.155 | ||||||
| 0.000 | 0.048 | 0.896 | 0.513 | |||||||
| Ethion | 0.048 | 0.399 | 0.793 | −0.089 | 0.049 | |||||
| 0.840 | 0.081 | 0.000 | 0.709 | 0.839 | ||||||
| Chlorpyrifos | 0.046 | 0.043 | 0.457 | −0.083 | −0.119 | 0.243 | ||||
| 0.846 | 0.858 | 0.043 | 0.729 | 0.618 | 0.302 | |||||
| Sulfotep | 0.627 | 0.642 | 0.472 | 0.370 | 0.566 | 0.218 | 0.220 | |||
| 0.003 | 0.002 | 0.036 | 0.108 | 0.009 | 0.355 | 0.351 | ||||
| Cholrmephos | 0.019 | 0.354 | 0.536 | −0.057 | 0.117 | 0.925 | −0.076 | 0.043 | ||
| 0.938 | 0.125 | 0.015 | 0.812 | 0.623 | 0.000 | 0.751 | 0.856 | |||
| Phorate sulfone | 0.021 | 0.354 | 0.585 | −0.068 | 0.103 | 0.950 | 0.014 | 0.056 | 0.995 | |
| 0.930 | 0.126 | 0.007 | 0.776 | 0.664 | 0.000 | 0.953 | 0.816 | 0.000 | ||
| Cypermethrin | −0.094 | −0.134 | 0.000 | −0.070 | −0.105 | −0.051 | 0.060 | −0.100 | −0.066 | −0.032 |
| 0.693 | 0.574 | 0.999 | 0.770 | 0.660 | 0.832 | 0.801 | 0.676 | 0.782 | 0.892 |

4.4.6. Factors Affecting Concentration of Pollutants Among C&D Waste

4.4.7. Hierarchical Cluster Analysis

4.4.8. Principal Component Analysis
4.5. Environmental Risk of Industrial C&D Waste in Organophosphorus Pesticide Manufacturing Plant
Table 4.15
The Variance Contribution Rate for Principal Component Analysis
| Component | Sums of Squared Loadings | ||
| Total | % of Variance | Cumulative % | |
| 1 | 3.978 | 36.167 | 36.167 |
| 2 | 2.657 | 24.154 | 60.320 |
| 3 | 1.554 | 14.126 | 74.446 |
| 4 | 1.179 | 10.714 | 85.161 |
| 5 | 0.950 | 8.632 | 93.793 |
| 6 | 0.476 | 4.324 | 98.117 |
| 7 | 0.187 | 1.699 | 99.816 |
| 8 | 0.014 | 0.126 | 99.942 |
| 9 | 0.005 | 0.045 | 99.988 |
| 10 | 0.001 | 0.012 | 99.999 |
| 11 | 7.246E-005 | 0.001 | 100.000 |

Table 4.16
Factor Loading Matrix for Principal Component Analysis
| Component | ||||
| 1 | 2 | 3 | 4 | |
| O,O,O-Triethyl phosphorothioate | −0.026 | 0.990 | 0.080 | 0.009 |
| O,O-Diethyl dithiophosphate | 0.368 | 0.583 | 0.119 | 0.389 |
| Phorate | 0.511 | 0.138 | 0.800 | 0.155 |
| Parathion | −0.122 | 0.023 | 0.010 | 0.943 |
| Terbufos | 0.034 | 0.942 | −0.122 | 0.105 |
| Ethion | 0.948 | 0.041 | 0.296 | 0.057 |
| Chlorpyrifos | −0.019 | −0.020 | 0.937 | −0.153 |
| Sulfotep | 0.033 | 0.591 | 0.413 | 0.667 |
| Chlormefos | 0.991 | 0.051 | −0.062 | 0.009 |
| Phorate sulfone | 0.991 | 0.047 | 0.024 | −0.018 |
| Cypermethrin | −0.095 | −0.075 | 0.181 | −0.307 |


4.5.1. Analysis of Contaminated Industrial C&D Waste and Its Evaluation
4.5.2. Exposure Pathways and Variables for Industrial C&D Waste
4.5.2.1. Exposure Pathways Analysis
4.5.2.2. Exposure Quantification
![]()
Table 4.17
Reference Value for Evaluation
| Pollutant | Standards for the Aquatic Environment (μg/L) | Guidance Value of the Highest Concentration of Pollutants in Soil (mg/kg) | Source of Standards |
| Phorate | 2 | 0.075 | Alberta Tier 1 soil and groundwater remediation guidelines |
| Parathion | 0.013 | 7.2 | |
| Terbufos | 1 | 0.08 | |
| Chlorpyrifos | 0.002 | 49 | |
| Dichlorvos | – | 0.1 | Allowable soil concentrations in the former Soviet Union |

Table 4.18
Calculated Excess of Pollutants
| Pollutant | Excess in Aquatic System (%) | Excess in Construction and Demolition Waste (%) |
| Phorate | 50 | 100 |
| Parathion | / | 95 |
| Terbufos | / | 85 |
| Chlorpyrifos | / | 10 |
| Dichlorvos | / | 16.7 |

![]()
Table 4.19
Exposure Pathways for Industrial and Commercial Sites

![]()
Table 4.20
Features of the Pollutants in Concern
| Pollutants | Chemical Abstracts Service | Soil Adsorption Coefficient Log(Koc) | Air Diffusion Coefficient (cm2/s) | Water Diffusion Coefficient (cm2/s) | Solubility in Water 20–25°C (mg/L) | Henry's Constant |
| Phorate | 298-02-2 | 3.74 | 0.08 | 8.0 × 10⁻⁶ | 44.00 | 5.0 × 10⁻⁴ |
| Parathion | 56-38-2 | 3.75 | 0.017 | 5.8 × 10⁻⁶ | 11.75 | 2.37 × 10⁻⁵ |
| Terbufos | 13071-79-9 | 4.14 | 0.042 | 5.1 × 10⁻⁶ | 6.84 | 0.06827 |
| Chlorpyrifos | 2921-88-2 | 3.70 | 0.048 | 5.1 × 10⁻⁶ | 0.9 | 1.70 × 10⁻⁴ |
| Dichlorvos | 62-73-7 | 1.70 | 0.023 | 7.8 × 10⁻⁶ | 16,000 | 3.98 × 10⁻⁵ |

![]()
![]()
4.5.3. Toxicity Values of Existing Pollutants
4.5.4. Risk Evaluation of Industrial C&D Waste in Pesticide Manufacturing Plant
![]()
Table 4.21
| Variable | Introduction | Industrial Land (Adult) |
| BW | Body weight (kg) | 60 |
| EF | Exposure frequency (d/a) | 261 |
| ED | Exposure duration (a) | 30 |
| IR | Inhalation rate of waste (mg/d) | 100 |
| SA | Skin surface area available for contact (cm2) | 2800 |
| AT | Averaging time (noncarcinogens/carcinogens) | 9165/25,550 |
| AF | Waste to skin adherence factor (mg/cm2) | 0.2 |
| ABS | Absorption factor | Varies with pollutants |
| TSP | Total suspended particulate content in air (mg/m3) | 0.3 |
| INH | Inhaled amount of air by an adult | 15 |
| PIAF | Retention ratio of inhalable waste particles in body | 0.75 |
| ET (out) | Proportion of the daily exposure time outdoor | 1/3 |
| ET (ind) | Proportion of the daily exposure time indoor | 1/3 |
| IRw | Ingestion rate of underground water (L/d) | 1 |
| IRf | Ingestion rate of food (kg/d) | 1.2 |
Table 4.22
Ingestion Amount Through Mouth
| Pollutant | Concentration (mg/kg) | Daily Ingestion Amount (mg/d) | Exposure Time (d) | Averaging Body Weight (kg) | Averaging Time (a) | Ingestion Amount Through The Mouth (mg/kg·d) |
| Phorate | 16,868 | 100 | 7830 | 60 | 9165 | 2.4 × 10⁻⁴ |
| Parathion | 6521 | 100 | 9.0 × 10⁻³ | |||
| Terbufos | 170 | 100 | 2.4 × 10⁻⁴ | |||
| Chlorpyrifos | 167.5 | 100 | 2.4 × 10⁻⁴ | |||
| Dichlorvos | 163.3 | 100 | 25,550 | 8.3 × 10⁻⁵ |

Table 4.23
Ingestion Amount Through Breathing
| Pollutant | Outdoor Ingestion (mg/kg·d) | Indoor Ingestion (mg/kg·d) | ||
| Vapor | Particle | Vapor | Particle | |
| Phorate | 1.2 × 10⁻⁴ | 1.0 × 10⁻⁴ | 2.5 × 10⁻⁴ | 1.6 × 10⁻⁴ |
| Parathion | – | 6.2 × 10⁻⁵ | – | 4.0 × 10⁻⁵ |
| Terbufos | – | 1.6 × 10⁻⁶ | – | 1.1 × 10⁻⁶ |
| Chlorpyrifos | – | 1.6 × 10⁻⁶ | – | 1.0 × 10⁻⁶ |
| Dichlorvos | – | 3.6 × 10⁻⁷ | – | 5.6 × 10⁻⁷ |

Table 4.24
Ingestion Amount Through Skin Contact
| Pollutant | Concentration (mg/kg) | Contact Area (cm2) | Skin Contact Coefficient | Exposure Time (d) | Averaging Body Weight (kg) | Averaging Time (a) | Ingestion Amount Through the Skin (mg/kg·d) |
| Phorate | 16,868 | 2800 | 0.1 | 7830 | 60 | 9165 | 1.3 × 10⁻² |
| Parathion | 6521 | 5.2 × 10⁻³ | |||||
| Terbufos | 170 | 1.4 × 10⁻⁴ | |||||
| Chlorpyrifos | 167.5 | 1.4 × 10⁻⁴ | |||||
| Dichlorvos | 163.3 | 25,550 | 4.7 × 10⁻⁵ |


![]()
Table 4.27
Noncarcinogenic Value of Oral Ingested Pollutants in C&D Waste
| Pollutant | Exposure Amount (mg/kg·d) | Oral Ingested Amount (mg/kg·d) | Noncarcinogenic Value of Single Pollutant |
| Phorate | 2.4 × 10⁻² | 0.0005 | 48.00 |
| Parathion | 9.0 × 10⁻³ | 0.006 | 1.50 |
| Terbufos | 2.4 × 10⁻⁴ | 0.000125 | 1.92 |
| Chlorpyrifos | 2.4 × 10⁻⁴ | 0.003 | 0.08 |
| Noncarcinogenic value of all pollutants | 51.5 | ||

Table 4.28
Noncarcinogenic Value of Dermal Ingested Pollutants in Construction and Demolition Waste
| Pollutant | Exposure Amount (mg/kg·d) | Dermal Ingested Amount (mg/kg·d) | Noncarcinogenic Value of Single Pollutant |
| Phorate | 1.3 × 10⁻² | 0.0005 | 26.00 |
| Parathion | 5.2 × 10⁻³ | 0.006 | 0.87 |
| Terbufos | 1.4 × 10⁻⁴ | 0.000125 | 1.12 |
| Chlorpyrifos | 1.4 × 10⁻⁴ | 0.003 | 0.05 |
| Noncarcinogenic value of all pollutants | 28.0 | ||

Table 4.29
Noncarcinogenic Value of Inhaled Pollutants Outdoor in Construction and Demolition Waste
| Pollutant | Exposure Amount (mg/kg·d) | Inhaled Amount (mg/m3) | Noncarcinogenic Value of Single Pollutant |
| Phorate | 2.2 × 10⁻⁴ | – | – |
| Parathion | 6.2 × 10⁻⁵ | 0.0005 | 0.124 |
| Terbufos | 1.6 × 10⁻⁶ | – | – |
| Chlorpyrifos | 1.6 × 10⁻⁶ | – | – |
| Noncarcinogenic value of all pollutants | 0.1 | ||

Table 4.30
Noncarcinogenic Value of Inhaled Pollutants Indoor in Construction and Demolition Waste
| Pollutant | Exposure Amount (mg/kg·d) | Inhaled Amount (mg/m3) | Noncarcinogenic Value of Single Pollutant |
| Phorate | 1.6 × 10⁻⁴ | – | – |
| Parathion | 4.0 × 10⁻⁵ | 0.0005 | 0.08 |
| Terbufos | 1.1 × 10⁻⁶ | – | – |
| Chlorpyrifos | 1.0 × 10⁻⁶ | – | – |
| Noncarcinogenic value of all pollutants | 0.1 | ||

Table 4.31
Noncarcinogenic and Carcinogenic Values and Risks of All Pollutants
| Toxicity Effect | Carcinogenic Risk | ||||
| Exposure Pathway | Maximum | Total | Whether it Exceeds the Risk Limits or Not | Total | Whether it Exceeds the Risk Limits or Not |
| Inhaled indoor | 0.1 | 0.1 | No | – | No |
| Inhaled outdoor | 0.1 | 0.1 | No | – | No |
| Dermal ingestion | 26 | 28 | Yes | 1.4 × 10⁻⁵ | No |
| Ingestion through meals | 36 | 36 | Yes | – | No |
| Oral ingestion | 48 | 52 | Yes | 2.4 × 10⁻⁵ | No |

![]()
4.6. Cyanide-Contaminated C&D Waste Generated in a Fire/Explosion Accident


Table 4.32
Pollution of the Cyanide-Contaminated Construction and Demolition (C&D) Waste Generated in an Explosion
| C&D Waste | Concentration (Cyanide) (mg/kg) |
| 1-1 | 160 |
| 1-2 | 12.1 |
| 1-3 | 105 |
| 1-4 | 110 |
| 2-1 | 1.53 × 10³ |
| 2-2 | 5.76 × 10³ |
| 3-1 | 3.49 × 10³ |
| 3-2 | 6.10 × 10³ |
| 4-1 | 2.08 × 10³ |
| 4-2 | 5.38 × 10³ |
| 5 | 2.41 × 10³ |
| 6 | 981 |
| 7 | 39.8 |
| 8 | 38.4 |
| 9 | 59.0 |
| 10 | 46.7 |
| 11-1 | 43.7 |
| 11-2 | 33.5 |
| 12 | 195 |
| 13 | 33.3 |
| 14 | 2.62 × 10³ |