
Developing scientific business applications using open source search and visualisation technologies
Abstract:
In addition to increased scientific informatics demands from high-throughput and more complex scientific applications, solutions are being developed in pharmaceutical companies that focus on business needs. In AstraZeneca, our New Opportunities unit focuses on disease indications of unmet patient need, outside of existing therapy areas. Over the past few years, systems have been developed using commercial and open source technologies, where many of these systems leverage a foundation layer – a publication index, based on SOLR. Systems such as automatic Key opinion leaders (KOL) identification, drug repositioning and an atlas-of-science can analyse and combine disparate data with other sources to aid decision making in our business.
14.1 A changing attitude
Over the course of the past decade, there has been an evolution in the landscape of IT systems in pharmaceutical companies. Our scientists would have state-of-the-art solutions at work, whereas at home, only for the technically gifted. Nowadays with information technology becoming integrated into everyone’s daily lives, with sites like Google, Facebook, LinkedIn, Twitter and Ebay, and tools like iPad, Sky +, TiVo and Kindle, the situation has started to reverse. With intuitive, tailored systems in our personal lives, everyone expects a lot more in our working life.
In addition to increased expectations, there is significantly more demand for scientific informatics within the pharmaceutical environment. With the rise of genomics, developments in metabolomics and proteomics, the explosion of externally generated scientific knowledge, high-throughput functional and phenotypic screening and the advent of next-generation sequencing technologies, informatics is at the heart of most, if not all, projects. This increased burden, coupled with a continual squeezing of resources and budgets, has meant that open source and often free alternatives are starting to be considered alongside the mainstream commercial platforms.
14.2 The need to make sense of large amounts of data
In AstraZeneca, our New Opportunities Innovative Medicines (iMED) group focuses on disease indications of unmet patient need, outside of the existing therapy areas (oncology, infection, respiratory, inflammation, cardiovascular, gastrointestinal, pain). As a small, virtual team, this is achieved through in-licensing late stage opportunities, out-licensing assets with world experts in different disease areas and evaluating new hypotheses with our drugs with external contract research organisations (CRO), key opinion leaders (KOL) and specialist disease companies.
Working in novel disease indications, without the years of knowledge that is normally intrinsically captured, our informatics systems need to be able to aggregate, standardise, analyse and visualise the huge wealth of information. This is normally hidden in unstructured texts and requires teasing out, either as structured text analytic queries or by generating themes and trends.
Our approach initiated in 2008, was to provide a foundation layer that would aggregate common unstructured, external scientific content into a single, unified search index. The initial programme focused on external scientific abstracts, leveraging publications, patents, conference reports, posters, PhD theses, UK/US grants and external clinical trials. Our original licence agreements were re-negotiated to ensure the ability to text-mine and analyse these sources. With new agreements in place, each individual data type was parsed into a unified format (described below), loaded into a search index and then different business applications built over the content, typically using a variety of different visualisation approaches for simple, end-user interaction.
14.3 Open source search technologies
Working with small volumes of data is relatively simple and a wide variety of search solutions can handle this requirement. When dealing with an index of millions of scientific abstracts, there can be issues with time; both in terms of indexing content and also speed of retrieval. Many search platforms were investigated, but SOLR stood out as it provided robust results in milliseconds.
SOLR [1] was developed as part of the Apache Lucene project. It provides a search platform that is fast, easy to implement and potentially enterprise capable. It has been adopted by a widening number of mainstream organisations including AT&T, AOL, Apple, IBM, Ticketmaster, Ebay, NASA and Netflix. The best-known example of SOLR in action is the purchase of goods on Amazon, where on selection of an item, the user is provided with a series of alternatives that other people who had bought that item had also purchased. This is SOLR’s optimised faceted search in action.
The searching capabilities that AstraZeneca have used at present include:
![]() powerful full-text searching – including searching for exact text, text with slight spelling errors and logical functions (e.g. AND, OR and NOT);
powerful full-text searching – including searching for exact text, text with slight spelling errors and logical functions (e.g. AND, OR and NOT);
![]() key word searching, that can be linked with text searching (e.g. search for documents that contain the word ‘cancer’ and are written by a given author);
key word searching, that can be linked with text searching (e.g. search for documents that contain the word ‘cancer’ and are written by a given author);
![]() faceted searches – quickly provide a list of all the ‘facets’ associated with a search (e.g. provide a list of the authors for the documents returned in a given search, and the number of documents that they have authored – without having to run through all the documents individually).
faceted searches – quickly provide a list of all the ‘facets’ associated with a search (e.g. provide a list of the authors for the documents returned in a given search, and the number of documents that they have authored – without having to run through all the documents individually).
SOLR also has a number of other features that allow future integration into our enterprise IT, including:
![]() database integration. This is especially useful when the documents indexed need to be annotated after they have been indexed. If an update to the original document needs to be indexed again (e.g. an update is supplied for a document from the external suppliers), then all annotations on the document would be lost without it being stored and re-applied from the database;
database integration. This is especially useful when the documents indexed need to be annotated after they have been indexed. If an update to the original document needs to be indexed again (e.g. an update is supplied for a document from the external suppliers), then all annotations on the document would be lost without it being stored and re-applied from the database;
![]() rich document (e.g. Word, PDF) handling. This is provided by integrating SOLR with the Apache Tika system [2], and is useful when indexing a diverse set of documents in a file system. The text extracted can also then be passed through other systems for further processing using a single text-based pipeline;
rich document (e.g. Word, PDF) handling. This is provided by integrating SOLR with the Apache Tika system [2], and is useful when indexing a diverse set of documents in a file system. The text extracted can also then be passed through other systems for further processing using a single text-based pipeline;
![]() geospatial search. Basic geospatial search has been appended to our index, but there are possibilities of marking documents with the author’s location (e.g. country, postcode, longitude, latitude). This means that clustering of work can be investigated. In addition, it may be possible to utilise this capability to look for elements that are similar to each other.
geospatial search. Basic geospatial search has been appended to our index, but there are possibilities of marking documents with the author’s location (e.g. country, postcode, longitude, latitude). This means that clustering of work can be investigated. In addition, it may be possible to utilise this capability to look for elements that are similar to each other.
SOLR is highly scalable, providing distributed search and index replication and at the time of writing our index currently provides sub-second searching on over 50 million documents. It is written in Java (utilising the Lucene Java search library) and runs as a server within a servlet container such as JeTTY or Tomcat. It has REST-like HTTP/XML and JSON APIs that has made it easy for us to integrate it with a number of applications. In addition, it has been extended by experimenting with Java plug-ins to allow us to implement specialist searches, should this be required.
The SOLR index has been found to be reliable, scalable, and quick to install and configure. Performance-wise, it has proved to be comparable to similar commercial systems (better in some cases). In addition, the faceting functionality provided has proved invaluable. The API has proved easy to integrate into a number of applications, ranging from bespoke applications to excel spreadsheets. However, the main disadvantages found have been the lack of tools to configure, manage and monitor the running system, and the lack of support.
14.4 Creating the foundation layer
The AstraZeneca SOLR publication management system was first developed to provide a data source to the KOL Miner system (more information given later). This was to be a system that automatically would identify KOLs, especially important for groups that work effectively by knowing which external partners to work with.
The first version of KOL Miner utilised Lucene indexing technology, but this proved to be too restrictive in that it did not provide an enterprise-class index and rapid search. In addition, it proved to be more scalable, especially as the faceting feature of SOLR enabled the structured querying of a large number of documents without having to load individual document details.
A document pipeline process was developed to process the documents as available. This is summarised in the Figure 14.1.
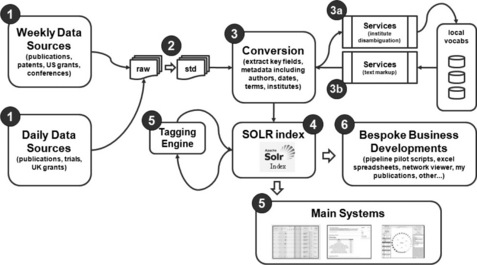
Figure 14.1 Schematic overview of the system from accessing document sources (1), standardising them into a single format (2), converting these and performing any disambiguation clean-up steps (3), indexing (4), re-tagging as appropriate (5) and finally development into business-driven systems (6)
Each process was quite specific and kept componentised for efficiency as steps could be replaced easily as better solutions were identified.
14.4.1 Raw documents
Data feeds are collected from a number of different sources on a regular basis (either daily or weekly). By default, all these feeds come in the form of XML files. However, they are collected using a number of different technologies, including:
![]() FTP files from a secure remote server. This was normally only necessary when the data feeds had been made available on a subscription basis;
FTP files from a secure remote server. This was normally only necessary when the data feeds had been made available on a subscription basis;
![]() accessing publically available web pages to identify new XML files to be downloaded via a generic Python script. A further enhancement to this system enabled users to log into the web site where the feeds were only available on a subscription basis;
accessing publically available web pages to identify new XML files to be downloaded via a generic Python script. A further enhancement to this system enabled users to log into the web site where the feeds were only available on a subscription basis;
![]() in some cases, data files were sent by suppliers directly to the company, either on CDs/DVDs, or via email, but these were normally replaced by an automated service as described above.
in some cases, data files were sent by suppliers directly to the company, either on CDs/DVDs, or via email, but these were normally replaced by an automated service as described above.
Although the standard document feeds ended up being XML files, other smaller SOLR indices have also been created from other file types, as described in step 2.
14.4.2 Normalise documents
The initial step in preparing the document data is to convert the documents into a standard XML format, known internally as ‘Unified XML’. Once this process has completed, all other processing can be performed using a single, standard pipeline. Initially, the conversion was performed using PERL scripts, but this has mostly been replaced by Python scripts utilising the ‘xml.etree.ElementTree’ library [3] to simplify the development. However, other one-off mechanisms have been used to convert non-XML files to the unified form, including standard Bash shell scripting and the Apache Tika text extraction utilities to extract text and meta-data out of different documents (such as PDF and Word documents).
Where possible, meta-data is extracted from the documents so that it can be easily searched in the indices. This includes:
![]() author data – including whether an author is the ‘first author’ (probably the person who did most of the work) or the ‘last author’ (probably the department head or senior research fellow). This also utilises our author disambiguation scripts, which try to clean these into a standardised format. There is no ideal solution and different geographies provide different challenges for this problem. A combination of institute, date and scientific tags can help in this challenge;
author data – including whether an author is the ‘first author’ (probably the person who did most of the work) or the ‘last author’ (probably the department head or senior research fellow). This also utilises our author disambiguation scripts, which try to clean these into a standardised format. There is no ideal solution and different geographies provide different challenges for this problem. A combination of institute, date and scientific tags can help in this challenge;
![]() any tags or key words that have already been attributed to the document. For instance, information delivered by the MedLine fed included ‘MeSH’ terms, which can be used to identify key concepts that the document is addressing.
any tags or key words that have already been attributed to the document. For instance, information delivered by the MedLine fed included ‘MeSH’ terms, which can be used to identify key concepts that the document is addressing.
14.4.3 Process documents
Once in a standardised form, the documents are converted into an XML form that can be loaded into the SOLR index. In addition to this, the documents are further processed to extract more information that may be of interest. For example:
Institute disambiguation
The authors of the documents are normally associated with a particular institute (e.g. university, hospital, company). However, the same institute is often presented in many ways. For example, an author from the Department of Cell Biology, Institute of Anatomy, University of Aarhus, Denmark may publish under a number of different institute names, including:
![]() Department of Cell Biology, Institute of Anatomy, University of Aarhus;
Department of Cell Biology, Institute of Anatomy, University of Aarhus;
![]() Department of Cell Biology, University of Aarhus;
Department of Cell Biology, University of Aarhus;
Each of these institutes are linked to the ‘University of Aarhus’ – meaning that a single search will find all documents from this university, despite the multiple original institute terms. Significant investment was made initially to bring together a comprehensive set of ‘stem’ terms for each pharmaceutical company, top biotechnology companies and top 500 world universities. These were used to bring together a significant set of synonyms across multiple sources. All of this information was used to identify consistent synonyms for each company or academic institute.
In addition, some institutes are hard to disambiguate due to multiple institutes with the same or similar information. For instance, ‘Birmingham University’ could either be ‘Birmingham University, England’ or ‘Birmingham University, Alabama’. Other clues need to be used to identify which institute is actually being referenced.
A Java program to perform this disambiguation was developed around a number of institute names and locations. These locations are held in another SOLR index, which provides fast lookup to allow rapid disambiguation. This service is also made available via a web interface to allow other programs to use it. It includes a number of steps, each designed to ‘hone’ the search further if no individual match is found in the previous steps:
![]() check the address to see if it contains any ‘stem’ words that uniquely identify key organisations (e.g. ‘AstraZeneca’, ‘Pfizer’). If so, match against that organisation;
check the address to see if it contains any ‘stem’ words that uniquely identify key organisations (e.g. ‘AstraZeneca’, ‘Pfizer’). If so, match against that organisation;
![]() split the provided address into parts (split on a comma) and identify the parts that reference any country, state and city information from the address (by matching against data in the index);
split the provided address into parts (split on a comma) and identify the parts that reference any country, state and city information from the address (by matching against data in the index);
![]() at the same time check to see if any of the address parts contain an ‘institute-like term’ (e.g. ‘University’), in which case only that part is used in the next steps of the search (otherwise all non-location address parts are used);
at the same time check to see if any of the address parts contain an ‘institute-like term’ (e.g. ‘University’), in which case only that part is used in the next steps of the search (otherwise all non-location address parts are used);
![]() look for an exact match for the institute name with the information held in the SOLR index. This can also be honed by state/country, if that information is available. In addition, common spellings of key institute-type names (e.g. ‘Universitet’) are automatically normalised by the SOLR searching process;
look for an exact match for the institute name with the information held in the SOLR index. This can also be honed by state/country, if that information is available. In addition, common spellings of key institute-type names (e.g. ‘Universitet’) are automatically normalised by the SOLR searching process;
![]() if still no match is found, a ‘bag-of-words’ search is performed to check to see if all the words in the institute name match the words of an institute appearing in any order within the institute synonym.
if still no match is found, a ‘bag-of-words’ search is performed to check to see if all the words in the institute name match the words of an institute appearing in any order within the institute synonym.
If no match is found or multiple matches still exist, the application returns the address part that had an institute-like term in it as the institute (as well as any location information extracted from the full address). In future, more advances could be incorporated to handle mergers and acquisitions.
Text tagging
The main body of text from the documents is automatically scanned for key scientific entities of interest to AstraZeneca (e.g. genes, diseases and biomedical observations). This uses a text markup system called Peregrine, which was developed by the BioSemantics group at Erasmus University Medical Centre [4]. This tool is used to identify and normalise the terms so that they can all be referenced as one. For instance, a gene may be known by various terms, including:
![]() name – e.g. ‘Vascular Endothelial Growth Factor A’;
name – e.g. ‘Vascular Endothelial Growth Factor A’;
![]() official symbol – e.g. ‘VEGFA’;
official symbol – e.g. ‘VEGFA’;
![]() EntrezGene ID – ‘EntrezGene:7422’;
EntrezGene ID – ‘EntrezGene:7422’;
![]() other – e.g. ‘VEGF-A’, ‘vascular permeability factor’, ‘vegf wt allele’.
other – e.g. ‘VEGF-A’, ‘vascular permeability factor’, ‘vegf wt allele’.
Each of these synonyms will be mapped to the same entity. In addition, attempts are made to make sure that a synonym does not accidentally match another word. For instance, the ‘Catalase’ gene is also known as ‘CAT’, but this also matches many other things (including cat the animal, cat the company that makes diggers, cat cabling, and cat – Cambridge Antibody Technology – company acquired by AstraZeneca in 2006).
14.4.4 Creating SOLR index
This normally takes place in an overnight process. Although, technically, the SOLR system can cope with dynamic updates, it was found that this process is best performed while the index is offline. In future, it is envisaged that a dedicated SOLR server will be used to index new data, and the indexes swapped over at night, to improve up-time, and the number of documents that can be processed per day.
14.4.5 Enhanced meta-data
In addition to in-pipeline annotations, further data enhancement processes have been developed to allow extra annotations to be performed on the data, using the power of the SOLR index. For instance, a set of SOLR queries were developed to identify if any of the documents mentioned any standard chemical reactions (e.g. ‘Baeyer-Villiger Oxidation’, ‘Schotten-Baumann Reaction’), and the relevant documents tagged with that information. This tagging process takes approximately five minutes for about 100 different reactions. Unfortunately, as this updating is performed on the SOLR index directly, any updates from the original source results in these annotations being over-written – which is why a possible enhancement to the system being considered is to tie the index into a database to hold the extra annotations.
14.4.6 Searching to build applications
Once the data are held within the index, they can be searched simply using either the RESTful HTTP interface, or using standard APIs developed for JAVA and other programming languages.
There are a number of systems that use the data, ranging from systems developed alongside third parties (e.g. KOL Miner), to Pipeline Pilot scripts and Excel spreadsheets that have been developed to interface with the Publications Index for specific purposes for individual scientists. Typically, many of our approaches use visualisation technologies to present the data in a more meaningful way back to the business users.
14.5 Visualisation technologies
Several commercial alternatives for building interactive, information visualisation systems have been evaluated. A thorough comparison against a variety of platforms demonstrated that open source alternatives tended to have at least as rich a set of features for data modelling, visualisation and interaction as well as layout and encoding techniques. More importantly, the frequently active community continued to improve and grow the options, often resulting in many examples that could be relatively quickly deployed and customised for business applications.
There are a variety of open source visualisation technologies including Visualisation Toolkit (VTK), Prefuse, Flare, Simile, Java Universal Network Graph (JUNG), InfoVis, yFiles, HCIL and AXIIS; each with their differences and unique features.
The visualisations that are described today focus predominantly around the utility of Prefuse [5], although our group has build systems using Flex, Flare and Simile, as well as commercial offerings such as Flex.
14.6 Prefuse visualisation toolkit
Prefuse is a Java-based toolkit providing a set of libraries for rich visualisations, including network diagrams, heat maps and trees. It is licensed under the terms of a BSD license and can be used freely for commercial and non-commercial purposes.
The online Prefuse gallery provides a great overview of approaches that can be considered. Figure 14.2 highlights some approaches that have been piloted.
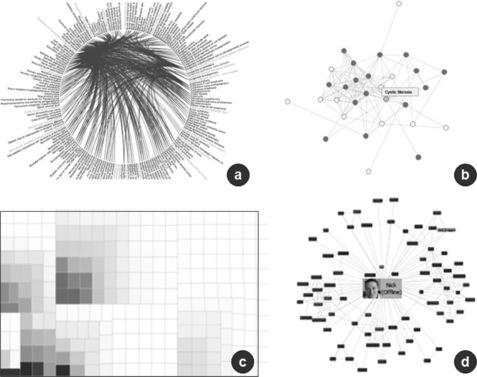
Figure 14.2 Node/edge networks for disease-mechanism linkage (a), radial networks for disease co-morbidities (b), treemaps for identifying trends (c) and photo networks (d) for social network interaction maps
As well as simple customisation, it is possible to combine the variety of components to build quite advanced systems. The rest of this chapter describes some example applications that have been built for our drug projects in AstraZeneca.
14.7 Business applications
Our approach has always been to use the right technology for fit-for-purpose business applications. This means that a single technology is not used for every problem and open source technologies are combined with commercial offerings. Some of the examples described here use such a combination.
14.7.1 KOL Miner – identifying influential key opinion leaders
When working in new disease areas, rapid and up-to-date identification of key experts is critical. Our approach was to leverage this enriched SOLR index to automatically identify the KOLs and academic institutes on-the-fly. As a virtual iMED, we work effectively by partnering with an external company – being able to identify KOLs rapidly is critical and helps us identify new people to work with. In fact, the system was developed in partnership with another company. OpenQ are a world leader in KOL management and together developed a system known internally as KOL Miner that was released externally as OpenIdentify™.
For any given search, over 30 faceted search queries are performed at the same time and aggregated together. Very few technologies are able to provide the extremely efficient and fast faceted search required. In this case, the SOLR index usually takes between 10 and 15 seconds for any search, even large queries retrieving millions of records. For each KOL or institute returned, the top meta-tags are identified, allowing an understanding of a KOLs main area of interest without reading a single article as shown in Figure 14.3.
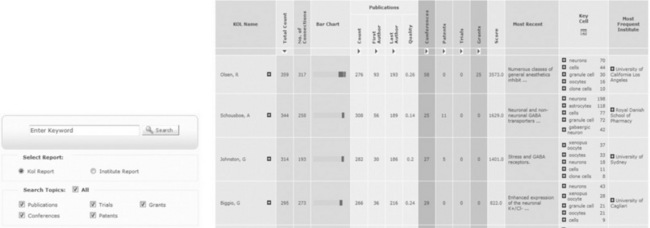
Figure 14.3 KOL Miner in action. Users have a very simple search interface (although advanced search options are available) and the results are visually appealing with different categories highlighted as both data and graphical charts. All results are clickable so users can drill down into the raw evidence at any point or add terms into the search to follow a train of though
As well as providing an interactive tabular view, very simple interaction network maps and vertical timeline plots are also generated. These let our scientists understand KOL spheres of influence and temporal trends, respectively, as seen in Figure 14.4. Using visualisation technology was critical to our success here. In this situation, the solution was developed with a commercial partner but many valuable lessons were learnt. Some visualisation problems are simple to solve using tables and summary figures, but understanding trends over time or interactions between often hundreds of individuals are things that cannot be easily comprehended by the human brain. Visual representation of the same data is therefore intuitive and often simpler for AstraZeneca scientists to interpret. In addition, a simple report was not sufficient. Users wanted the ability to view the high-level results over a given search, but then drill down into the underlying evidence once they had finished experimenting with search. For the first time, this technology provided a mechanism that could rapidly investigate many different areas and identify the key players within a matter of minutes.
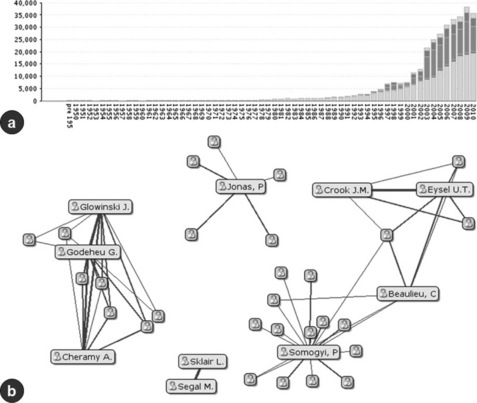
Figure 14.4 Further KOL views. The bar chart (a) represents the number of documents reflecting a given search over time. Different sections of the bars represent the different document sources – publications, conference reports grants, patents and clinical trials. The x-axis represents time and the y-axis represents the number of documents in total. The network visualisation (b) represents the top ten authors for a given search. Here the top ten authors actually interact by their co-authorships, and it is possible to gain an understanding about who is working with who, which groups are isolated and which individuals might have more influence – even if are not the top KOL
14.7.2 Repositioning matrix – finding new indications for our drugs
AstraZeneca has over 500 compounds that have been tested clinically, representing over 170 different target mechanisms. Historically these projects have focused on less than 100 disease indications, yet the standard disease ontologies have thousands to consider (for example, Medical Subject Headings (MeSH) [6] has over 2850 diseases). To consider all of the possibilities would be unrealistic without informatics.
In New Opportunities, the problem was simplified and initially less than 150 additional indications were considered, which had clear unmet patient needs. A system was therefore developed that leverages both the unstructured data within SOLR (> 50 M scientific documents) and the structured content within an aggregated collection of competitive intelligence databases. This brings together an understanding of biological and competitive rationale by searching for sentence level co-occurrence between disease term(s) of interest and the drug’s mechanism term(s) as outlined in Figure 14.5.

Figure 14.5 Drug repurposing matrix. Schematic representing the approach to search scientific literature and combine with competitive intelligence for over 60 000 potential combinations identifying hot spots to investigate further
This information is then stacked on top of each other in an interactive heatmap visualisation. Figure 14.6 illustrates this approach and combines this mining result with additional internal ideas. By providing a single visualisation of over 30 000 serious opportunities, our scientists can prioritise and evaluate new indications for our compounds, or identify disease area themes to consider. Figure 14.7 shows an example of the sentence level extraction that scientists are able to view when they drill down into the results. In this way, compounds were identified that had potential across a range of eye and skin disorders. In 2009, a deal was signed with Alcon, experts in ophthalmology, and in 2011 with Galderma, experts in dermatology.
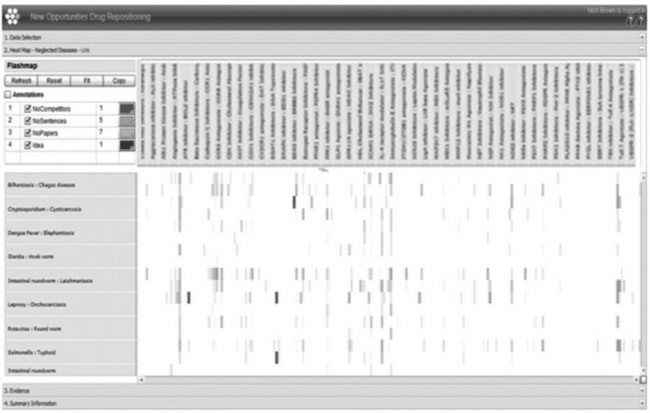
Figure 14.6 Early snapshot of our drug-repositioning system. Disease indications (y-axis) and drug mechanisms (x-axis) are plotted against each other. In the application, different colours reflect the information identified – such as competitive intelligence and scientific rationale at sentence or abstract level
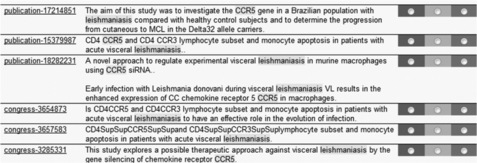
Figure 14.7 Article-level information. Here the disease and mechanism terms are highlighted as well as any synonyms on record
This system was built entirely using Pipeline Pilot [7], although there are alternative workflow tools such as KNIME (see Chapter 6 by Meinl and colleagues) and Taverna that could be considered. In this situation, Pipeline Pilot provides extremely good flexible web services that can be called for each of the different interactions that could be performed. The main visualisation was built using a commercial platform – Adobe Flex. This technology was already in use in AstraZeneca and had been proven to handle over 1 million data points yet still be extremely responsive.
In addition, many more dimensions can be incorporated into this view, including target efficacy, safety liabilities, patent position, internal knowledge and tissue expression. SOLR is flexible enough to handle many different types of data and could be leveraged to accommodate this, whereas the Flex visualisation has already been tested and can handle tens of dimensions with millions of rows of data.
Before this approach, our re-positioning opportunities would be opportunistic and not systematic. This technology enables an impressive summary of a huge volume of complex data and the generation of mechanism-disease landscapes. Without SOLR and Flex, this would be possible, but SOLR enables a rapid up-to-date system to be repeated weekly and Flex provides sufficient speed even when faced with large data numbers or statistical measures.
14.7.3 Arise – biological process maps of how AstraZeneca drugs work
Another approach taken to professionalise our drug repositioning efforts was to develop internal knowledge of understanding around how the company’s drugs work at the cell and tissue level.
Successful repositioning in the past has been through one of two routes: (1) serendipity or (2) biological understanding. Using the classic and well-known repositioning example of sildenafil, it was originally designed for the treatment of angina. Unexpected and serendipitous findings in Phase I clinical trials meant that it was repositioned in 1998 to treat erectile dysfunction and sildenafil sold as Viagra had peak sales of around $2B by 2008. This drug works as a PDE5 inhibitor and protects cyclic guanosine monophosphate (cGMP), leading to smooth muscle relaxation, causing vasodilation that increases the inflow of blood into the spongy, penile tissue [8]. By understanding how this drug works at the biological level of the cells and tissue, it was then repositioned again in 2005 into pulmonary arterial hypertension (PAH). This rare lung disorder affects patients whose arteries that carry blood from the heart to the lungs become narrowed, making it difficult for blood to flow. This was launched as Revatio (sildenafil) as a lower dose, which by relaxing the smooth muscle leads to dilation of the narrowed pulmonary arteries [9].
When new indications are considered for our AstraZeneca compounds, having a detailed understanding about how each of our drugs works is critical. As a large pharmaceutical company, with over 12 000 R&D scientists that contribute to the collective knowledge about our drugs in all of our existing and historical projects, having this in a single repository would be incredibly valuable. Although corporate, global data repositories do hold millions of documents that describe every finding about all of our compounds, this is held in unstructured texts, project minutes, drug filings, product labels and even marketing material. Unfortunately the rich, invaluable and often tacit knowledge about how these drugs work is not stored systematically in a structured format, but in our brains! Luckily, our project scientists are always keen to discuss their compounds and how the biological function can be used in new potential indications.
To capture this knowledge once and for all, a project was initiated to describe how our compounds and drugs work at the biological level. Historically our focus has been at the signalling pathway level, with gene targets, trafficking and receptor interactions. This project tried to understand what the drug did to the cells, the tissues and the pharmacology at the pathophysiological level. Although run as an informatics project to store this information in new ontologies and visualise the results in new biological process pathway maps, the information was gathered by coordinating hundreds of interviews across the company. Similar issues within other major companies are discussed in this book by Harland and colleagues (Chapter 17) and by Alquier (Chapter 16).
The technology used to build these visual network maps was Prefuse, which easily lends itself to network objects and attaching relationships. Rather than a static network diagram, these biological process maps (Figure 14.8 ) have been designed to be built within the application and our annotators scribe the information directly into the system now.
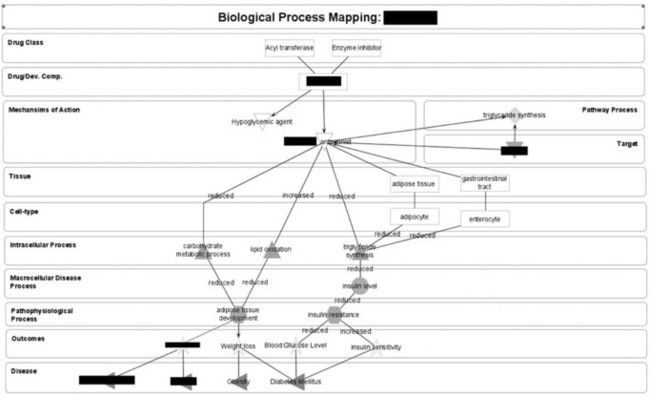
Figure 14.8 An example visual biological process map describing how our drugs work at the level of the cell and tissue. This approach can be used to record not only the scientific rationale for projects and drugs, but also potential indications to consider through the understanding of disease and drug
In addition to capturing the knowledge about a drug, any new ideas scientists have can be captured and overlaid by processes that are connected to other diseases or drugs. This work is usually done by an informatician working with the scientists and building the maps in the system together.
Approaches such as this have not been initiated before because to attempt this approach without robust visualisation technology would be extremely difficult, and it would be virtually impossible to develop the interactivity required in alternative technologies such as mind mapping or presentation software. In truth, the underlying Prefuse technology has now been applied to many different areas across AstraZeneca because it is simple to adopt, easy to customise and intuitive for end-users to use. For example, this has been further developed into a business-led, multifaceted system for computational biology networks with vast sets of these networks together.
14.7.4 Atlas Of Science – searching for the missing links
Atlas Of Science is a software tool written in Java and based on the Prefuse toolkit. It provides a simple and interactive mechanism for searching and dynamically visualising information contained within large sets of documents. The original version of Atlas Of Science was intended for the one master set of publications held in the SOLR Index (described elsewhere in this chapter), but it can also be used to look at any set or subsets of documents from other projects, using either a Lucene index or a SOLR index.
The user enters into a document search either a direct SOLR query (e.g. all documents containing the work ‘cataract’), those matching a list of key words (e.g. those that have previously marked as talking about ‘pancreatic cancer’; documents written by a particular author), or a combination of a number of these criteria. The numbers of documents that match the query are displayed, along with the top key words found in those documents as seen in Figure 14.9.

Figure 14.9 A screenshot of the Atlas Of Science system. Key elements are the ability to search (top left), identify individual facets (bottom left), main interaction window (centre), query terms (top right) and converted XML results (bottom right). This approach allows users to surf over the information rapidly to find new trends and themes
The system allows the user to visualise these key words in a number of ways:
![]() key word lists. The key word list panel shows the key words that have been found across your result set. They can be ordered by total number found or by significance. The significance calculation gives extra weighting to terms that appear more often with the main search query than without;
key word lists. The key word list panel shows the key words that have been found across your result set. They can be ordered by total number found or by significance. The significance calculation gives extra weighting to terms that appear more often with the main search query than without;
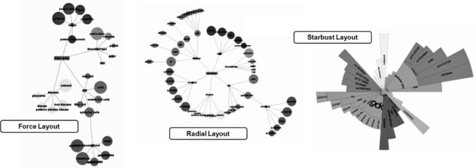
![]() hierarchical visualisations. There are three different hierarchical views, force, radial and starburst as shown in Figure 14.10. These all show a tree that represents the key words in the current result set. Each one uses a different layout algorithm for the tree. The centre of the tree represents the main search that you have typed into the search panel. A sub group is added to the tree for each category of key words, and the top key words shown for each category are shown. The size of each node is weighted to represent the total or significance score relative to the rest of the nodes in its category.
hierarchical visualisations. There are three different hierarchical views, force, radial and starburst as shown in Figure 14.10. These all show a tree that represents the key words in the current result set. Each one uses a different layout algorithm for the tree. The centre of the tree represents the main search that you have typed into the search panel. A sub group is added to the tree for each category of key words, and the top key words shown for each category are shown. The size of each node is weighted to represent the total or significance score relative to the rest of the nodes in its category.
Atlas Of Science is also highly interactive. At any time it is possible to view the documents associated with the data in a search just by right-clicking on the relevant part of the key word list or visualisation.
Alternatively, it is possible refine the search to include a key word by clicking on it, or to do subsearches within the visualisation by ‘spidering out’ searches.
For scientists, this allows them to surf across the enormous complexity of data held in documents and find new facts or trends without reading individual articles. It also means that instead of searching for positive hits in a standard Pubmed search, this approach lets users find verifiable new connections to investigate, something that is incredibly difficult to do when you have a lot of information to sift through.
14.8 Other applications
A number of other applications have been developed to make use of the SOLR Publication Management Index. These include:
![]() 1Alert. This system allows scientists to quickly set up a regular email or RSS feed to show new developments in a given area. For example, the system can provide a weekly email with a list of all the new publications, conference proceedings and clinical trials pertaining to a particular disease or disease area. In addition, more complicated search techniques can be applied across the whole of the index to enable the scientists to be informed of significant events in the publications. 1Alert makes use of the advanced tagging utilised within the SOLR Publication Management Index to improve the document feedback produced for this alerting;
1Alert. This system allows scientists to quickly set up a regular email or RSS feed to show new developments in a given area. For example, the system can provide a weekly email with a list of all the new publications, conference proceedings and clinical trials pertaining to a particular disease or disease area. In addition, more complicated search techniques can be applied across the whole of the index to enable the scientists to be informed of significant events in the publications. 1Alert makes use of the advanced tagging utilised within the SOLR Publication Management Index to improve the document feedback produced for this alerting;
![]() My Publications. In an organisation the size of AstraZeneca, it is difficult to track what experience the employees have, especially when that experience was gained before the employee joined the company. For scientists, one way of tackling this problem is to have a view of what publications these people have authored during their career.
My Publications. In an organisation the size of AstraZeneca, it is difficult to track what experience the employees have, especially when that experience was gained before the employee joined the company. For scientists, one way of tackling this problem is to have a view of what publications these people have authored during their career.
However, even viewing this is difficult as, very often, the author’s name is not unique (e.g. try searching for ‘N. Brown’). One of the first searches most scientists perform when they come across the SOLR Publications Management Index, is for their own publications. A small system was therefore developed known as My Publications that allows users to quickly perform this search and then to tag the documents with their unique AZ identifier. It is then possible for other people within AZ to search for publications that are authored by AZ employees and to discover their areas of expertise based on the areas in which they have published.
This concept is to be extended to include internal documents that allow users to quickly identify other people within the company who have been (or are) working in a particular area in which they are interested. It is hoped that this will encourage a culture of interaction and collaboration that helps stimulate innovation.
14.9 Challenges and future developments
The SOLR Publications Management system has proved to be a robust and reliable system. However, if it is to be made available to the wider AstraZeneca community, the following enhancements need to be developed.
![]() The system should be made more robust. It may be possible to use the new SOLR Cloud development to provide this [10]. This will allow data replication across multiple servers, and failover facilities. In addition, it is desirable to implement separate index and search servers, to improve the amount of data that can be indexed, and the frequency at which the index can be refreshed. This is especially true if internal content is integrated with up to 200 + million documents.
The system should be made more robust. It may be possible to use the new SOLR Cloud development to provide this [10]. This will allow data replication across multiple servers, and failover facilities. In addition, it is desirable to implement separate index and search servers, to improve the amount of data that can be indexed, and the frequency at which the index can be refreshed. This is especially true if internal content is integrated with up to 200 + million documents.
![]() A system management facility should be implemented. Our current systems check to see if the servers are still running, and re-start them if necessary. However, this is still a mainly manual process, and the search for third-party tools to support this (e.g. LucidWorks [11]) is desirable.
A system management facility should be implemented. Our current systems check to see if the servers are still running, and re-start them if necessary. However, this is still a mainly manual process, and the search for third-party tools to support this (e.g. LucidWorks [11]) is desirable.
![]() A search security model should be implemented. At the moment every user can search every document. However, in the future, the intent is to implement a search strategy that restricts the results returned depending on whether the user is allowed to access the documents, This will be required especially if the system is to be used to index internal documents, which may, for instance, include HR or restricted project documents.
A search security model should be implemented. At the moment every user can search every document. However, in the future, the intent is to implement a search strategy that restricts the results returned depending on whether the user is allowed to access the documents, This will be required especially if the system is to be used to index internal documents, which may, for instance, include HR or restricted project documents.
In addition, the following enhancements to the existing systems are being considered.
![]() Allowing users to provide feedback/annotations on individual documents. This would require the SOLR Index to be integrated with a database to hold the annotations, so that subsequent updates to the documents from the original source did not result in the loss of the annotations.
Allowing users to provide feedback/annotations on individual documents. This would require the SOLR Index to be integrated with a database to hold the annotations, so that subsequent updates to the documents from the original source did not result in the loss of the annotations.
![]() The standardising of the pipeline, utilising other tools such as Nutch [12] (to crawl file and web infrastructures) and Tika (to extract text and meta-data from a wide range of document types), to extend the reach of the documents indexed.
The standardising of the pipeline, utilising other tools such as Nutch [12] (to crawl file and web infrastructures) and Tika (to extract text and meta-data from a wide range of document types), to extend the reach of the documents indexed.
In addition, more uses of a single, enhanced data source are being discovered on an almost daily basis, meaning that new simple business applications are being developed by various informaticians and developers within AZ.
14.10 Reflections
Overall, our experience of open source technologies as applied to solve business problems has been extremely positive. Even after recent comparisons to commercial software, SOLR still appears highly competitive and truly optimised for faceted search. Prefuse continues to grow and, with the advent of Flare, has made steps to wider adoption with improved visualisation performance.
If we were to do this again, we would invest in both SOLR and Prefuse/ Flare, with a capability to be able to build business applications over the scientific content. Looking back, it appears that we have several different technologies in the mix and in hindsight, much of what we have developed could probably be designed through using just open source approaches.
One area that we would change would be to have a closer connection to the open source community. Currently the relationship is very much one-directional and although we consume open source technology and focus on the must-win problems that immediately affect our business, we would hope to work more closely with the open source community and of course make any improvements to any code publically available.
14.11 Thanks and Acknowledgements
The work described here has been completed over the course of three years. There are many people that have contributed to this and we can’t hope to thank everyone. We would especially like to thank the following people.
Mark Robertson, without his scientific acumen we might still be building IT systems for the sake of IT, Chris Duckett and Graham Cox (Tessella) for their patience and great coding skills, Caroline Hellawell for her continued support and biological understanding, Jamie Kincaid (Accelrys) for being able to rationalise and interpret our ideas, Ian Dix for sponsoring our activities through Knowledge Engineering activities in AstraZeneca, John Fish for believing in us and providing us the original funding that got this off the ground in the first place, and last but certainly not least, Ruben Jimenez (OpenQ) and Otavio Freire (OpenQ) who originally introduced us to SOLR three years ago. Little did we realise how important that technology choice would prove to be in making any of this possible.
14.12 References
[1] SOLR. Lucene.apache.org at http://lucene.apache.org/solr/
[2] Apache Tika. Tika.apache.org at http://tika.apache.org/.
[3] ‘xml.etree.ElementTree’ library at http://docs.python.org/library/xml.etree.elementtree.html.
[4] Schuemie, M.J., et al, Peregrine: lightweight gene name normalization by dictionary lookup. Proceedings of the Biocreative 2 workshop. Madrid, 2007.
[5] Prefuse at http://www.prefuse.org.
[6] Medical Subject Headings (MeSH). nlm.nih.gov at http://www.nlm.nih.gov/mesh/.
[7] Pipeline Pilot. Accelrys at http://accelrys.com/.
[8] Langtry, H.D., Markham, A. Sildenafil: A review of its use in erectile dysfunction. Drugs. 1999; 57(6):967–989.
[9] Murray, F., Maclean, M.R., Insel, P.A. Role of phosphodiesterases in adult-onset pulmonary arterial hypertension. Handbook Experimental Pharmacology. 2011; 204:279–305.
[10] SolrCloud: wiki.apache.org at http://wiki.apache.org/solr/SolrCloud.
[11] Lucidworks: Lucid Imagination at http://www.lucidimagination.com/ products/lucidworks-search-platform/enterprise.
[12] Nutch: at http://nutch.apache.org/.