Using Behavior Analysis and Anomaly Detection
Many types of networks have emerged in the last decade. That includes Internet of Things (IoT) networks, industrial networks, Building Automation and Control (BAC) networks, and more. These networks are connecting devices that were previously connected through proprietary methods, moving to Internet Protocol (IP) connectivity. These devices include various types of sensors measuring temperature and humidity, motion detectors, proximity sensors, gas sensors, and security and surveillance cameras.
These evolutions brought about a new concept in network security. In the past, we used to protect the end units; however, in some cases today, it is more complex than that. We have millions of end devices of many types, where using the standard malware-detection systems is not always possible.
That brought about a new concept of information systems security. In addition to protecting the end devices (in some cases, instead of this), we listen to the traffic that is forwarded through the network and find suspicious patterns. Since everything eventually goes through the network, we establish a baseline of good traffic—that is, the regular traffic that goes in and comes out of end devices—and then, anything that deviates from the baseline is considered suspicious.
In this chapter, we will learn about traffic baselines and traffic patterns, see what is normal and what symptoms we should carefully check for, and get a detailed view of these.
In the first section, we will learn about the tools we can use; in the second section, we will see how to set a baseline from which any change should be examined; in the third section, we will see typical anomalies that might be security breaches. We start with collection methods and learn how we can monitor and collect data from a network.
In this chapter, we will cover the following main topics:
- Collection and monitoring methods
- Establishing a baseline
- Typical suspicious patterns
We start with collection and monitoring methods.
Collection and monitoring methods
Viewing network traffic can be done in several ways, such as the following:
- Simple Network Management Protocol (SNMP)
- NetFlow and IP Flow Information Export (IPFIX)
- Wireshark and network analysis tools
- Streaming telemetry
Let's look at the information we can get from each one of them.
SNMP
Although considered by some as obsolete, SNMP is still by far the most popular network management tool. SNMP is based on a manager-agent model, where a management system (a manager in SNMP terminology) monitors devices by receiving information from the SNMP agent interacting with the communications device.
There are two ways that the SNMP manager (the management system) receives information from the agent, outlined as follows:
- SNMP polling: This refers to when the SNMP manager monitors the agents on communication devices.
- SNMP traps: This refers to when an agent on a communication device discovers a problem, and the agent initiates an alert and sends it to the management system.
There are some configurations we use in both cases in order to improve our network security.
SNMP polling – what to configure
In SNMP polling, the management system polls the monitored agents periodically, giving us statistics on the monitored parameters. Monitored parameters can be traffic parameters such as interface bits/packets/errors per second (/sec), hardware data such as central processing unit (CPU) load, memory usage, power supply health, temperature, and more.
It is recommended to monitor the following parameters:
- Traffic on interfaces—bits/sec and packets/sec, especially on interfaces where attacks can come from; for example, connections to the internet or to remote offices.
Have a look at the following screenshot:
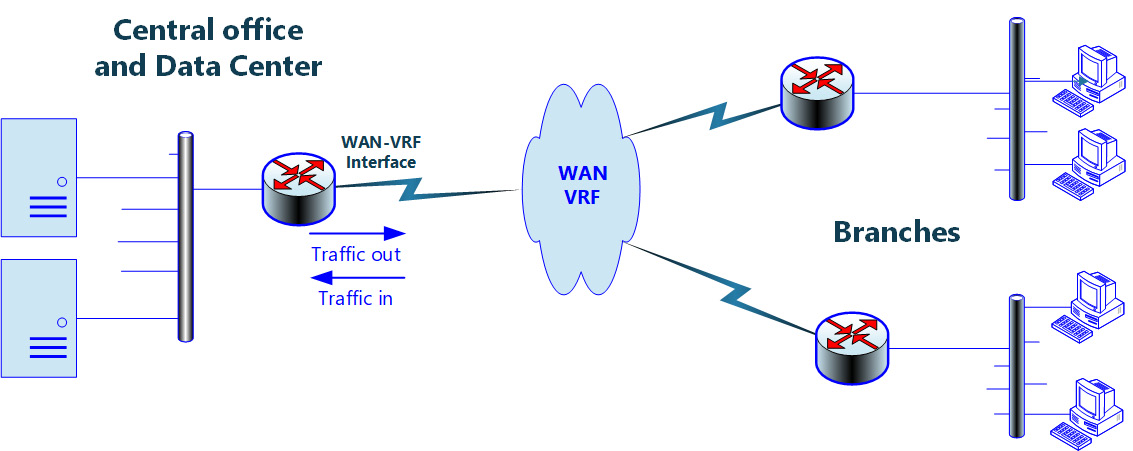
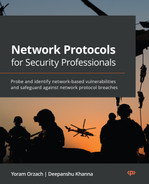
Figure 9.1 – Monitored network
In this network, we monitor the interface in the center facing toward the branches (remote offices)—that is, the wide-area network-virtual routing and forwarding (WAN-VRF) interface.
On this interface, we see that there is a sudden increase in the traffic going out from the data center to the remote offices. This is depicted in the following screenshot:

Figure 9.2 – Traffic increase on the central router
We see that in this 2-day graph, there is little traffic coming out of the interface (the pink line), while on 1/12 (December 1; European notation) at 19:30, when the remote offices are closed, traffic increases to 18 megabits per second (Mbps) for a short time.
Zooming in on the graph, we see that the peak is a few minutes after 19:30, and the traffic increases to a little bit over 18 Mbps, as illustrated in the following screenshot:

Figure 9.3 – Zooming in on the traffic graph
In the next section, we will see how we can find out what's causing this.
SNMP traps – what to configure
Traps are messages initiated by the communications device on a specific event. Traps can be generated on several event categories (depending on the vendor's implementation), such as the following:
- Routing events—Open Shortest Path First (OSPF) topology changes (for example, a change in routing table, Border Gateway Protocol (BGP) connection established or disconnected, and so on).
- Configuration change—Configuration change in the device. In Cisco devices, for example, there is a management information base (MIB) configuration called CISCO-CONFIG-MIB whereby any configuration change is written and sent to the SNMP management console, including details such as the configuration change time and the user that did this.
- Environmental changes—High temperature, power supply problems, and so on.
- Communications events—Connection state (up/down); interface up/down.
- Authentication failures—SNMP monitoring system tries to read information from a system with the wrong SNMPv1/2c community string or SNMPv3 credentials; authentication failure when accessing a device with Telnet or Secure Shell (SSH).
- Traffic alerts—Traffic on the interface rises above a pre-defined value.
For more information on SNMP, you can read the Brute-force attacks against SNMP passwords (community strings) section of Chapter 7, Detecting Device-Based Attacks.
To configure an authentication trap in Juniper, refer to https://www.juniper.net/documentation/en_US/junos/topics/task/configuration/snmp-traps.html. To do the same in Cisco, refer to https://www.cisco.com/c/en/us/support/docs/ip/simple-network-management-protocol-snmp/13506-snmp-traps.html.
From SNMP, let's look at the next method from which you can get information on non-standard traffic that can be suspicious.
NetFlow and IPFIX
NetFlow is a feature introduced by Cisco in the mid-90s that is used to collect Layer 3 and Layer 4 information. Using the NetFlow protocol, the router collects Layer 3 information (that is, source and destination IP addresses) and Layer 4 information (that is, Transmission Control Protocol (TCP) or User Datagram Protocol (UDP) source and destination port numbers) and sends this information to the NetFlow collector on a management system, in which you can see long-term statistics on conversations on the given router interface.
Several protocols similar to NetFlow were introduced later: JFlow from Juniper Networks, SFlow for Level 2 switch monitoring, and some others. NetFlow itself was published as a Request for Comments (RFC) in RFC 3954: Cisco Systems NetFlow Services Export Version 9, later to be replaced the IPFIX protocol, which is based on NetFlow version 9 and supported by most of the leading vendors for collecting Layer 3 and Layer 4 information. The following screenshot shows the NetFlow traffic graph:
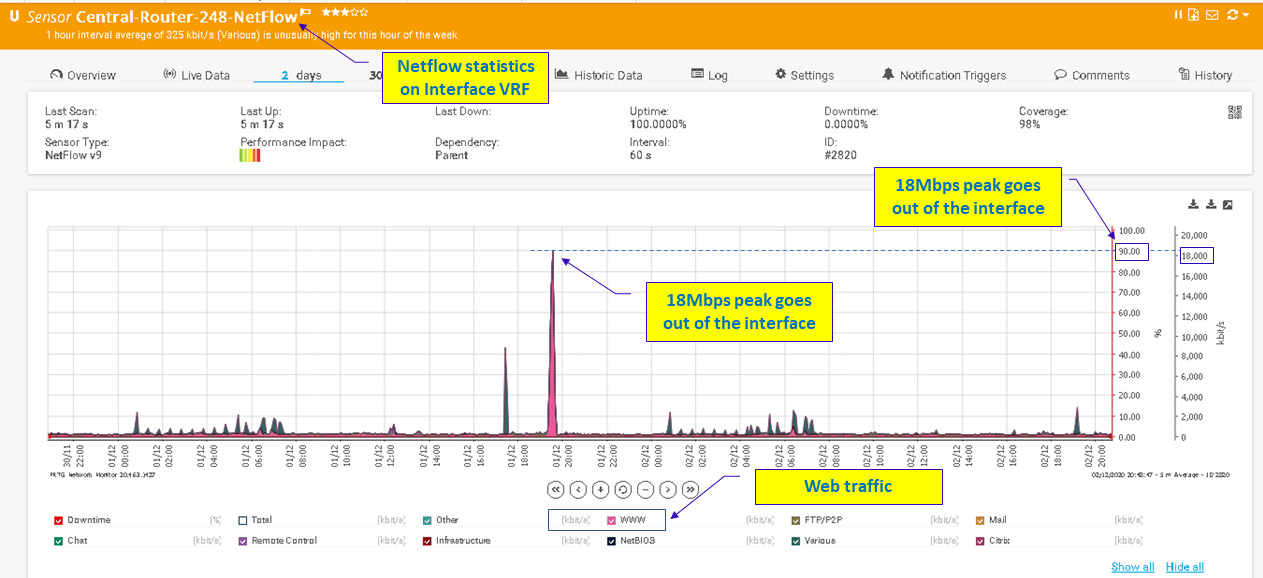
Figure 9.4 – Zooming in on the traffic graph
Focusing on the traffic between the two ends (that is, the conversations between them), we can see that on December 1, 2020, between 19:15 and 19:30, we had 190 megabytes (MB) that were sent from 23.221.29.227 to 172.30.131.1, and 34 MB sent from 82.102.180.147 to the same destination.
Important Note
In using the term conversation in a data network, we refer to the packets that are exchanged between two ends. A conversation can be between Layer 2 entities (that is, all frames between two media access control (MAC) addresses on a local-area network (LAN)), Layer 3 entities (that is, all packets between two IP addresses in the network), or Layer 4 entities (that is, all messages between UDP, TCP, or any other Layer 4 process in the network).
Keep in mind that frames, packets, and messages are all protocol data units (PDUs). PDUs in Layer 2 are called frames, PDUs in Layer 3 are called packets, and PDUs in Layer 4 are called messages or segments.
Now knowing this, it's time to check who are these servers that the internal host downloaded the data from. Let's have a look:

Figure 9.5 – Zooming in on the traffic graph
Checking the IP address 23.221.29.227, where most of the traffic comes from, we see that it is hosted on Akamai, and verifying whether it is a blacklisted site does not return any alerts, so there's no problem with it.
Important Note
Blacklist-checking sites are sites that alert if a specific IP or domain name poses a risk. Many sites provide these services, and some sites summarize the results of many others. In this example, I looked on dnschecker.org, but there are many others that you can use.
In the same way, you can go and check any other suspicious traffic.
Wireshark and network analysis tools
Wireshark is the world's foremost network protocol analyzer. There are several tools in Wireshark that can be used to discover anomalies. Let's have a look at them.
Endpoints and Conversations
One of the first things to do is to see who is talking over the network. We can see this from Endpoints under the Statistics menu. Let's look at the following example:
Figure 9.6 – Finding suspicious patterns in the Endpoints window
What we see is a list of IP addresses and a list of packets that were sent from/to them. Resolving them and checking their Domain Name System (DNS) names will show us if there is a designated suspect or if everything is fine. We can also see UDP and TCP port numbers, so we will focus on this in the Conversations window.
To resolve the addresses, you can use a standard resolver such as https://www.findip-address.com/ or similar, and you also have tools for resolving bulk IP addresses. In the next example, I used a tool from https://www.nirsoft.net/. What I received is shown in the following screenshot (a partial list):

Figure 9.7 – Resolving IP addresses
In Figure 9.7, we can see that all resolved addresses are from hosting services such as Google, Amazon, and Microsoft OneDrive. Cloudfront.net, a service for web content distribution, is also an Amazon site; from https://main.whoisxmlapi.com/, we can see it is an Amazon server physically located in Tel Aviv, Israel.
From Conversations under the Statistics menu, we can see who is talking with whom, and on which port numbers they are talking. Let's see the next example:

Figure 9.8 – Finding suspicious patterns in Conversations
In Figure 9.8, we see—for example—many connections from 192.168.1.136 on various ports, connecting to 192.168.1.159 on port 52235. A Google search on the TCP port shows that this is a video-rendering service. There's nothing that looks suspicious there.
Protocol Hierarchy
One of the important tools Wireshark gives us for detecting network traffic anomalies is the Protocol Hierarchy tool, under the Statistics menu. By watching the protocols that are running in the network, we can verify what should be there and what should not be, and can use this information to discover anomalies. Let's see an example, as follows:

Figure 9.9 – Finding suspicious protocols in Protocol Hierarchy
Looking at this simple example, we can see some familiar protocols whose existence in a home or small office environment is reasonable. These are Quick UDP Internet Connections (QUIC), which are used in connection with Google Drive; Network Basic Input/Output System (NetBIOS) and Server Message Block (SMB), which are common Microsoft protocols used for service discovery and file sharing; and Transport Layer Security (TLS) and HyperText Transfer Protocol (HTTP), which are used for browsing.
Two protocols that are not common to home and small networks are Virtual System Simulator (VSS) Monitoring and Session Traversal Utilities for NAT (STUN).
Important Note
There are thousands of protocols, and only some of them are used in enterprise networks. For every protocol that you don't know, google it, and verify whether there is a reason for it in your network. You might discover that it is something you forgot about that should be there. It could be a Wireshark dissection error; it could also be a network maintenance protocol, and it could be something worth checking.
For VSS Monitoring, right-clicking on the line with STUN in the Protocol Hierarchy window gives us the following packets:

Figure 9.10 – Unknown packets sent over the network
In Figure 9.10, we see that 192.168.1.190 sends packets to 192.168.1.136, and Wireshark recognizes some of these packets as HTTP.
To understand the session, we right-click one of the HTTP packets and choose Follow TCP Stream. This will give us an entire stream of data, from beginning to end, that will help us to understand what is going on here. We see the results in the following screenshot:
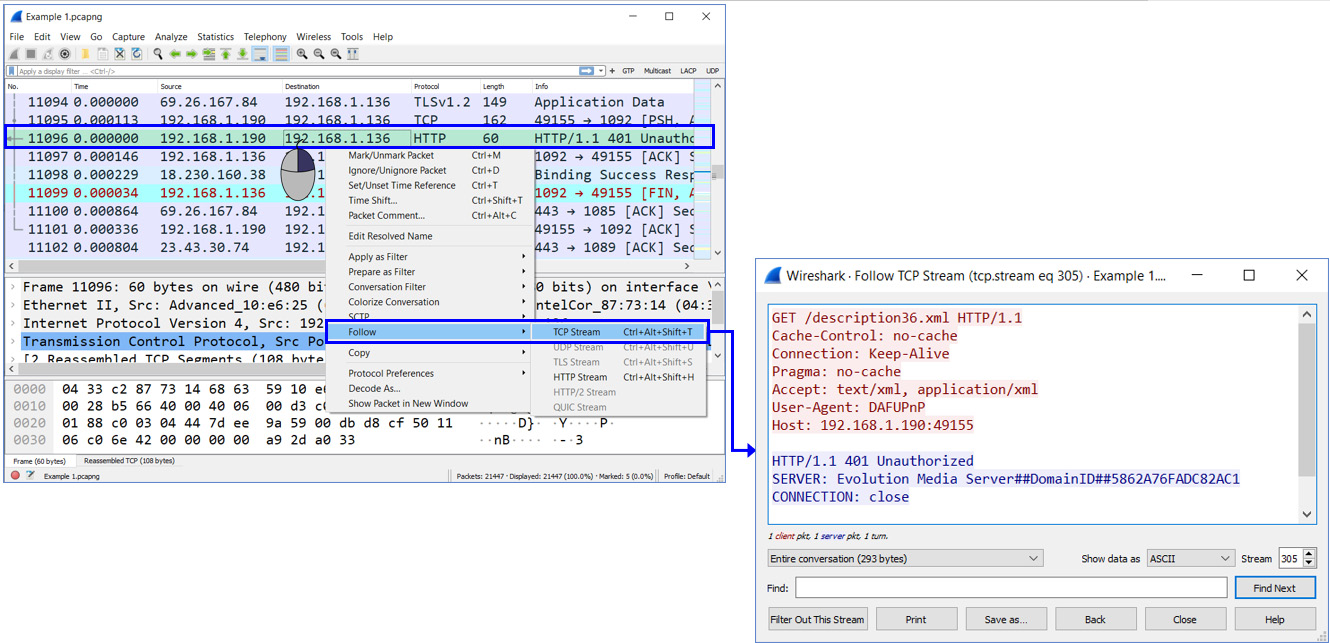
Figure 9.11 – TCP stream details
We see in the next screenshot what is going in the stream from beginning to end:
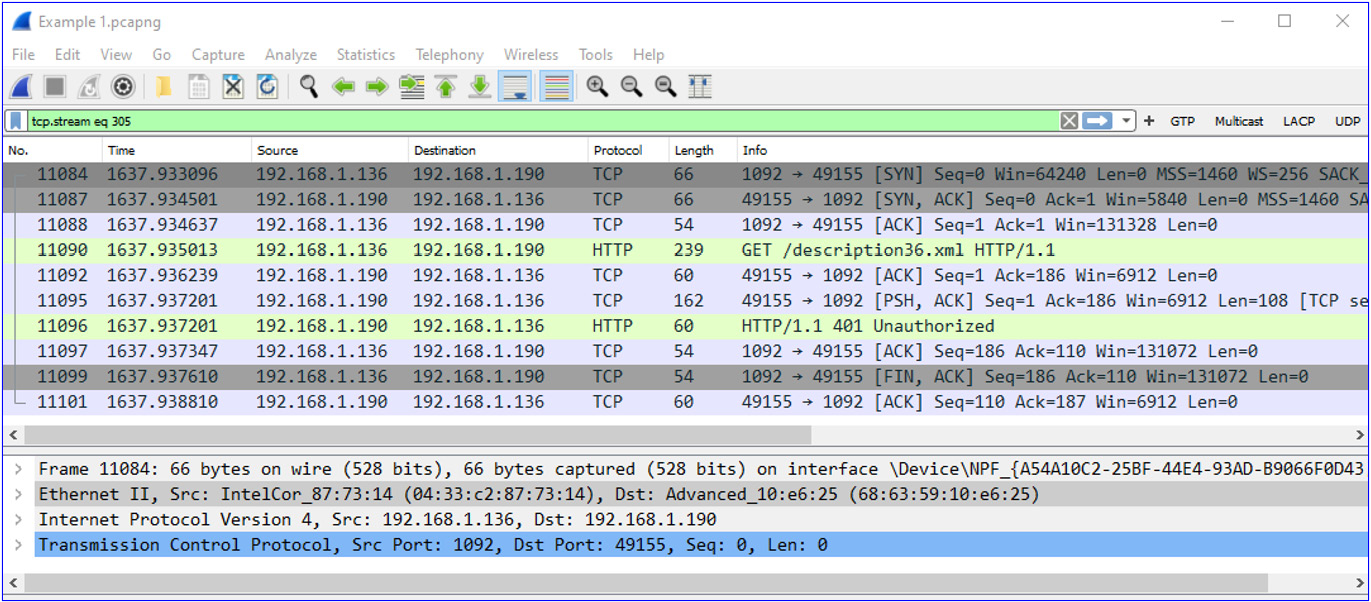
Figure 9.12 – TCP stream packets
What we see here is that one device on the LAN, 192.168.1.190, connects to another device, 192.168.1.136. From the MAC addresses, we see that this is a device from a vendor named Advanced, and resolving its MAC address, we see that the vendor is Advanced Digital Broadcast SA, a Swiss vendor that produces software and devices for Pay-TV (subscription-based television). It looks as though the cable TV is trying to connect to my laptop, and the laptop is refusing to accept it.
The second protocol that is running here without a reasonable reason is STUN. Looking at the Protocol Hierarchy window, we see that we have STUN over TCP as well as STUN over UDP.
STUN is a protocol that is used for network clients behind a network address translation (NAT) device to tell an external Voice over IP (VoIP) server what their external IP address is. To get to STUN sessions, we right-click on STUN in the Protocol Hierarchy window so we see all STUN packets (over TCP or over UDP), then we choose a packet, right-click it, and choose Follow TCP Stream (or Follow UDP Stream). We can see this in the following screenshot example:

Figure 9.13 – STUN request and response
Checking which server I am talking to (that is, IP address 18.230.160.38) shows me that it is an Amazon server in São Paulo, Brazil. Amazon is OK—I cannot think of a reason why my laptop would contact a server in São Paulo without me knowing about it.
In this section, we talked about the tools we can use. In the next section, we will get deeper into the reasons for this.
Looking at the packet capture
Having a first look at the packet capture is always a good point to start from. Some initial indicators will immediately raise a flag that something might be wrong. Some of them are listed here:
- Unknown addresses—Addresses, especially on the internet. Addresses that you resolve as being from Google, Amazon, Microsoft, and so on are probably OK. Check for unknown names, regions, countries, and so on.
- Sessions that do not make sense—Clients in the networks that send information between them without a reason, unknown addresses, unknown TCP/UDP port numbers, and so on.
- Scanning patterns—A device that scans the network, scanning patterns coming from several sources (distributed denial of service (DDoS)), and so on.
- Unknown protocols—Some protocols are common to enterprise networks: HTTP, NetBIOS/SMB, DNS SMTP/Post Office Protocol (POP), and others. Any protocol on the enterprise network that IS NOT from these should be checked.
In this section, we talked about the tools and collection methods to use to collect information that will help us to build a baseline. In the next section, we talk about baselines and how to create one.
Establishing a baseline
Establishing a baseline is a task you must perform. It might sound difficult, but it's very simple when you know your network. In this section, we will talk about the common protocols that run in a typical enterprise network, and we will look at their typical traffic patterns.
Protocols that are common to enterprise networks can be categorized into several groups, as follows:
- Internet access protocols—HTTP, HTTP Secure (HTTPS), Google QUIC (GQUIC), SMTP, POP, and DNS
- Organizational applications—NetBIOS/SMB, Microsoft Terminal Services (MS-TS), database applications, and multicasts
- Network protocols—Routing protocols, discovery protocols, monitoring protocols, and so on
Let's see some typical capture files and find out what we should see in organizational networks.
Small business/home network
In the following screenshot, we see a typical protocol hierarchy of a user connected to an organizational network. Let's see the details:

Figure 9.14 – Small business traffic
Under Internet Protocol Version 6, we see several network-operations protocols, without any real traffic moving over them. In most organizational networks, there is no need for IPv6, so just disable it on PCs and servers. When IPv6 is required, the following protocols need to be enabled:
- Simple Service Discovery Protocol (SSDP), used for network services discovery
- Multicast DNS (MDNS), a zero-configuration protocol that runs automatically as a name-services protocol, Link-Local Multicast Name Resolution (LLMNR) for name resolution on the same link (Layer 2 network), and Domain Name System (DNS), which is the standard name-service discovery protocol
- Dynamic Host Configuration Protocol (DHCP) for address configuration
Under Internet Protocol Version 4, we see UDP and TCP. Let's first look at protocols under UDP, as follows:
- First, we see Internet Security Association and Key Management Protocol (ISAKMP) and Encapsulation Security Payload (ESP). These are used for client-to-firewall virtual private network (VPN) connections and are common to clients connecting to remote firewalls.
- We also have the same discovery protocols that we saw in IP$v6—these are SSDP, MDNS, LLMNR, and DNS.
- NetBIOS Name Service—A discovery protocol, used for name queries in Microsoft networks. Usually replaced by DNS but still used by some applications.
- QUIC (Internet Engineering Task Force, or IETF)—A Google protocol used for working with Google Cloud applications.
Under TCP, we have common protocols, as follows:
- TLS—Used for connection to secure websites, which are the majority of websites today
- POP—Used by standard mail clients (for example, Microsoft Outlook) for receiving mails
- HTTP—Used when browsing web servers, internal and external
At the end of the Protocol Hierarchy window, we also see Internet Group Management Protocol (IGMP) and Address Resolution Protocol (ARP), both network protocols.
Another Wireshark application to examine is the Statistics | Conversations window, especially the TCP and UDP protocols. We see this in the following screenshot:

Figure 9.15 – TCP and UDP statistics
In these statistics windows, with TCP sessions on the left and UDP sessions on the right, we see the conversations. We see that there are many websites we connect to regularly, and many DNS queries to the router/firewall that also acts as a DNS server. All this is regular. Now, let's see what we might expect in bigger, medium-size networks.
Medium-size enterprise network
In the following screenshot, we see a capture on a data center firewall port, of traffic from the organization's users to the data center servers. First, we look at the traffic carried by UDP in the following example:

Figure 9.16 – UDP statistics
In these statistics that focus on traffic sent over UDP, we see the following protocols:
- SNMP—This is a monitoring protocol. Make sure it is coming from a management system and verify this management system is yours.
- Session Initiation Protocol (SIP)—A VoIP/IP Telephony (IPT) signaling protocol used in IP telephony and multimedia applications. Make sure it is yours, meaning IP addresses that are part of your organization, TCP/UDP port numbers that you know, and so on. You can do this by simply right-clicking a specific protocol line and choosing Apply as Filter | Selected. You will see the two addresses on the connection and then can verify you know what they are—for example, on https://whatismyipaddress.com, where you can check if they are on any known blacklist. In the next example, we see a SIP session between two addresses— internal and external. Make sure the external address is not on a blacklist.
- NetBIOS/SMB are standard Microsoft Windows protocols, used for name resolution and services advertisements.
- We also have DHCP, DNS, and connectionless LDAP that are a part of the network operation. Make sure you know them and that their sources are legitimate.
- The last protocol here is the Apache Tribes Heartbeat (ATH) protocol used as a heartbeat (a form of keep-alive protocol) that runs between Apache web servers.
For SIP, when we right-click on it and choose Apply as Filter | Selected, we will get the following window:

Figure 9.17 – SIP session
Checking on a name resolution site (I checked on whatismyipaddress.com, but there are many similar websites you can use), we see that the external address belongs to Partner Communications, which is the customer's internet service provider (ISP). Clicking on Check Blacklist Status verifies it is OK, as you see in the next screenshot:
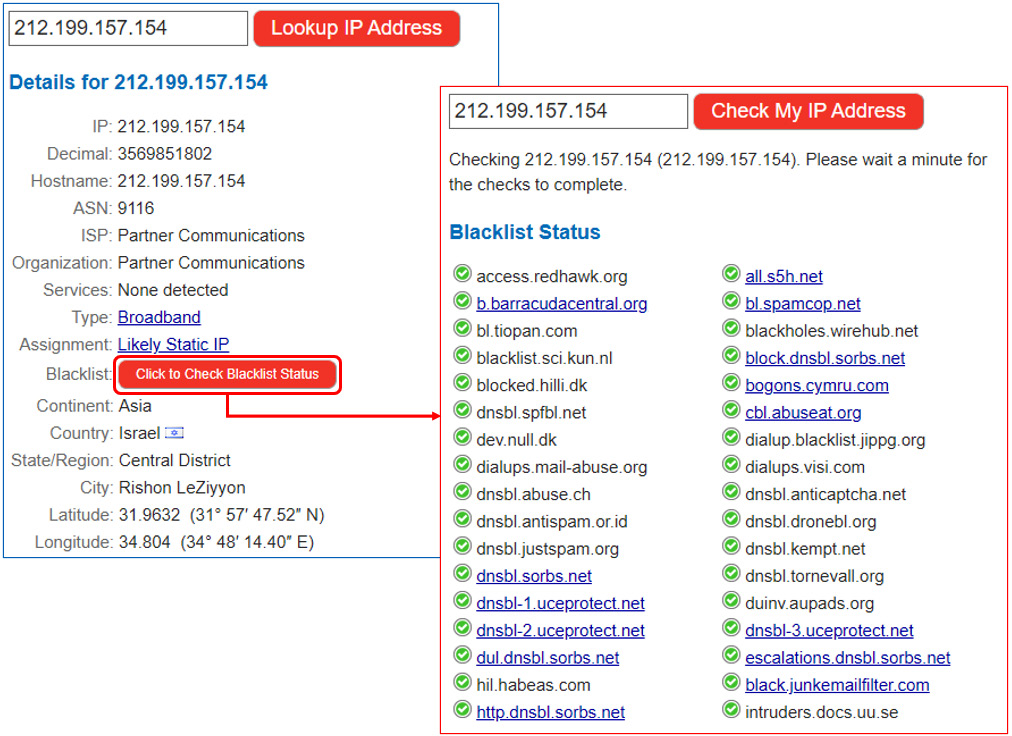
Figure 9.18 – Identifying a SIP server
The next thing is to check what application is running on the local device and if it uses SIP. Make sure you know what it is. You can do this by simply using Ctrl + Alt + Del and examining the applications and processes running on your PC. In the case of Linux, you can do this by using ps -a.
In the TCP part of the window, we see the following protocols:

Figure 9.19 – TCP traffic
Here, you can see the following traffic types:
- Distributed Computing Environment/Remote Procedure Call (DCE/RPC): RPC is a method used in many protocols when a local process call (a remote process, for example) for sending data back performs a specific operation and sends the result. It is used in many applications. To see the sessions behind every line, simply right-click them, choose Apply as Filter | Selected, and you will see it in the packet list. After the end of this list, you will see an example of how to identify a session.
- HTTP traffic flow, of course, for browsing a web server is very important as it gives a clear picture of the network traffic flow in cleartext. To understand the HTTP packet flow, simply right-click click on the HTTP header, choose Apply as Filter, and click on Selected.
- Kerberos and LDAP are authentication protocols. Make sure they are properly configured and used in your network.
- The Line Printer Daemon (LPD) protocol is a network-printing protocol used for submitting print jobs to a remote printer.
- NetBIOS/SMB over TCP is commonly used for file sharing, copying, and other file operations.
- Tabular Data Stream (TDS) is one of the protocols used in databases.
- TLS, as we saw previously, is used for secure connectivity to a remote server.
Now, let's see how we focus on a specific session. Let's say we want to find the details of a local security authority that comes under DCE/RPC under the TCP protocol. We see this in the following example:

Figure 9.20 – Digging into the details of a session
To get session information, follow these steps:
- Open the Protocol Hierarchy window, right-click the protocol you want to check, and choose Apply as Filter | Selected. You will get the filtered data on the main packets window (2), as illustrated in the following screenshot:

Figure 9.21 – Follow session details
- Choose one of the packets and right-click it. You will get the TCP Stream window. In this window, you will be able to see the session details and whether they are good or suspicious, as illustrated in the following screenshot:

Figure 9.22 – Checking session details
Now, let's focus on some examples of suspicious patterns.
Typical suspicious patterns
Viruses, Trojans, worms, ransomware, and other types of malwares can be executed on endpoints—this is what standard endpoint security software and systems protect against, but there are two major problems with this.
The first problem is that when one of these malwares gets to your end device, it is being fought at the gate—that is to say, you fight it when it has already reached your devices. In most cases, you will win the war, but if you do not, the enemy is in your home.
The second, more common problem is that not all devices can be protected with standard endpoint security systems. You cannot install anti-virus on an IoT sensor; some of the software that is used is open source, which has no safety guarantee, and although the network access control (NAC) system approves users when they connect to the network, you can never be 100% sure that a private phone or laptop is not infected.
For this reason, one of the new concepts in network security is to monitor the network and check for risks before they infect end devices, the aim being to identify suspicious traffic patterns and block their source before any damage is done. This is what we will do in this section.
Suspicious traffic patterns can be of many types. They can be scanning patterns in which you see that someone is scanning the network, unknown addresses that appear in the network, unknown TCP or UDP port numbers, unknown strings that appear in traffic, and more. Let's have a closer look at them.
Scanning patterns
Scanning patterns can be of several types. We will go from the simplest ones to the most complex.
ARP and ICMP scans
ARP and Internet Control Message Protocol (ICMP) scans are the simplest scans and are reasonably easy to discover. We talked about them in Chapter 6, Finding Network-Based Attacks. In these scans, you will see many ICMP packets without any reason for being there, or a large number of ARP packets sweeping the network. Check the source of these packets and the reason for them being sent.
TCP scans
TCP scans are sent to target open TCP ports on a target and, when found, other tools will be used to exploit this vulnerability and break into it. TCP scans have quite a simple form. Let's have a closer look at them in the following screenshot:

Figure 9.23 – TCP scan
What we see is that host 192.168.1.101 sends TCP/SYN packets to various ports on 192.168.1.101, and the last one blocks them with TCP/SYN/RST.
HTTP scans
HTTP scans are usually HTTP GET or PUT commands that are sent to an HTTP server to get information from the server or write information to it. In the following screenshot, you can see a typical HTTP scan:
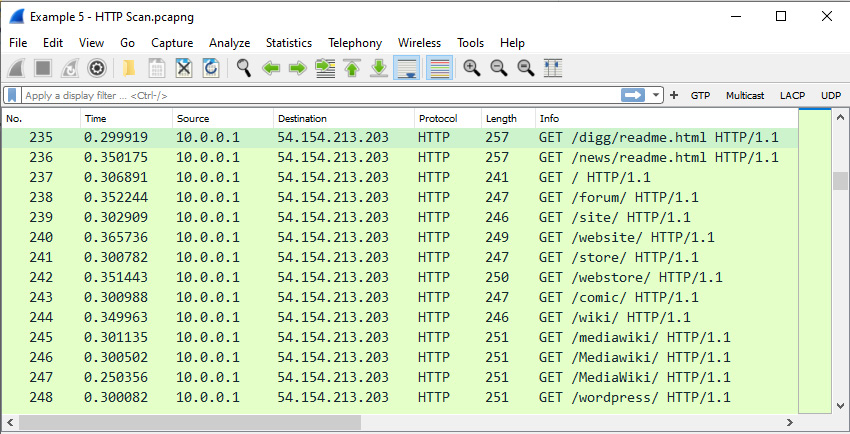
Figure 9.24 – HTTP scan
We see that 10.0.0.1 is trying to get content from 54.154.213.203 without success. If this were a real HTTP GET request from a real client and server, we would have seen requests and responses, not an HTTP GET request to random pages.
Another HTTP scan can be seen in the following screenshot. What attracts my attention here is the number of SYN packets that are sent to various destination IP addresses on TCP port 8080 (web proxy) without getting a response:
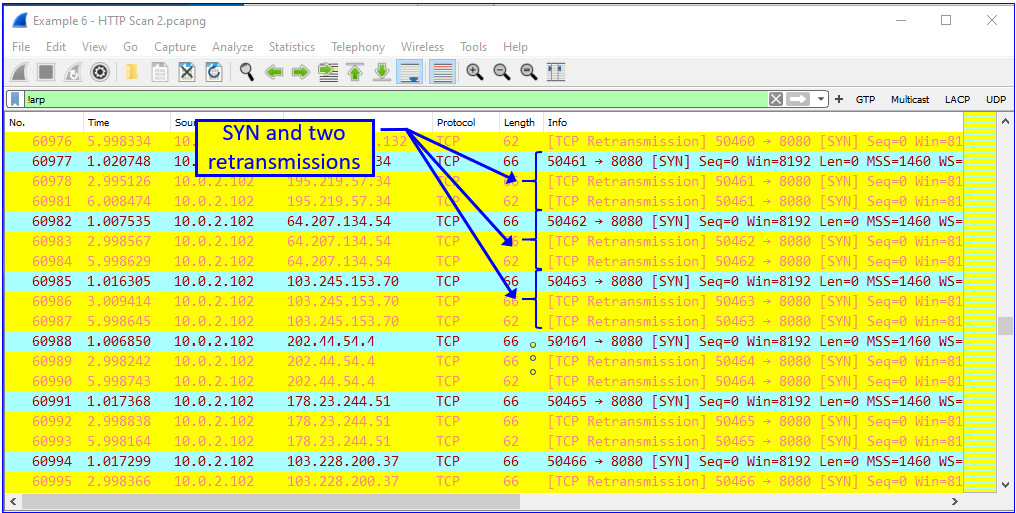
Figure 9.25 – HTTP scan
When filtering several streams (right-clicking a packet and choosing Follow TCP Stream), I saw this:
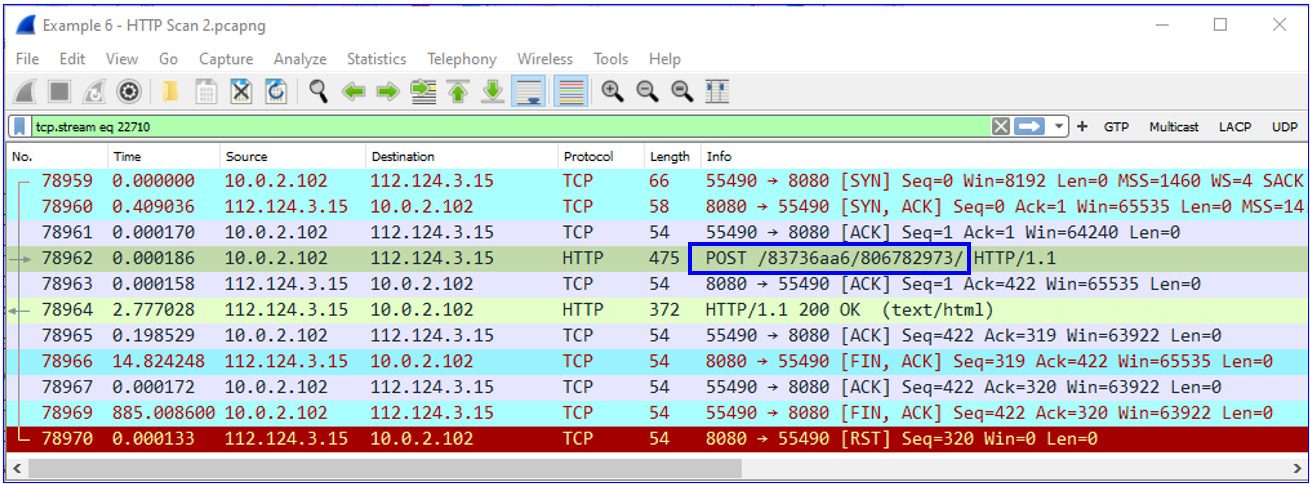
Figure 9.26 – Botnet remote server
What is interesting is that the POST requests were sent with the same /83736aa6/806782973 string to all the destinations that TCP tried, and in some cases succeeded, to open a connection with.
So, I googled this string, and it was not a surprise to see this page:

Figure 9.27 – Botnet
It looks as though someone found it before me. It is a botnet—short for robot network, a network of computers infected by malware that is under the control of a single attacking party.
Brute-force attacks
We saw in the Attacks on the management plane and how to defend against them section of Chapter 7, Detecting Device-Based Attacks, that these brute-force attacks use guesswork to try and break into computing or networking devices. For this reason, it is possible to see these packets when they come from the network. Let's see some examples. The one shown here is a brute-force attack targeting a DNS server, trying to get IP addresses of organization servers:
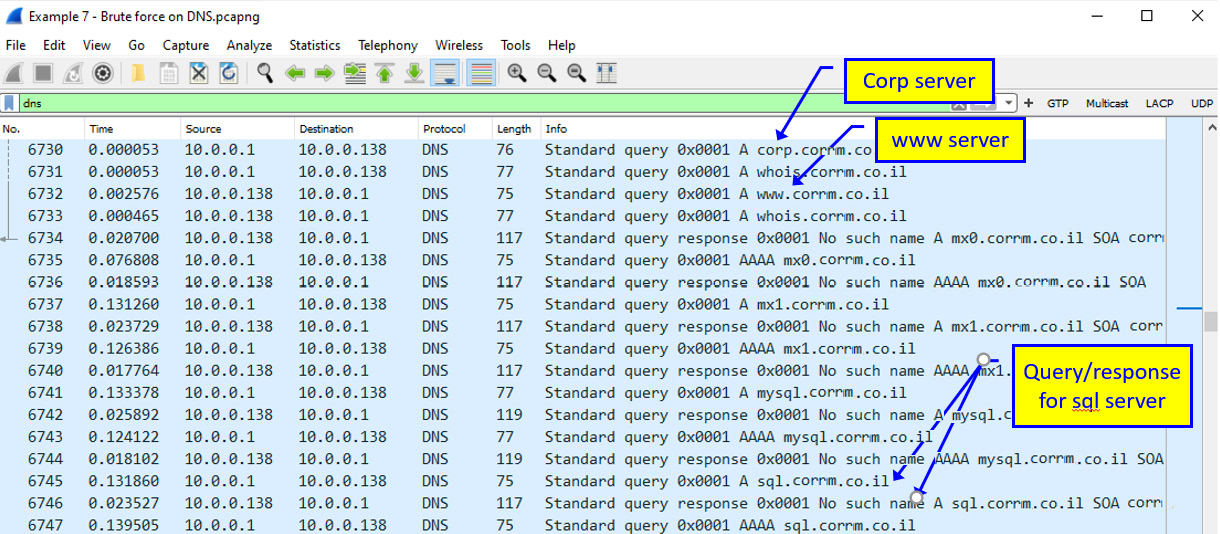
Figure 9.28 – Brute-force scanning
Here, we see how the attacker tries to discover servers in corrm.co.il (not a real name, so you will not get any ideas on attack destinations). The attacker tries to see if someone responds to www.corrm.co.il, to sql.corrm.co.il, and so on. If someone responds, the attacker can move forward with the attacks. What can the attacker do with this information? We will see this in the next chapters when we talk about protocols in detail.
Email issues
In email traffic, you can usually see emails that you do not expect to receive. You can see this in the following example:

Figure 9.29 – Emails from unknown sources
You can see here emails received from addresses in .cl (Chile), which this user does not expect any emails from. Also, there are hundreds of emails (from which you see in Figure 9.29 only a sample, of course) arriving from unknown names and addresses.
When you look at the traffic on this POP connection, you can also see that something does not make sense. In the input/output (I/O) graph shown in the following screenshot, you see a connection that lasts for 80 seconds, with hundreds of packets spread over this time. Usually, you will see emails sent or received from a single user in a significantly shorter time:
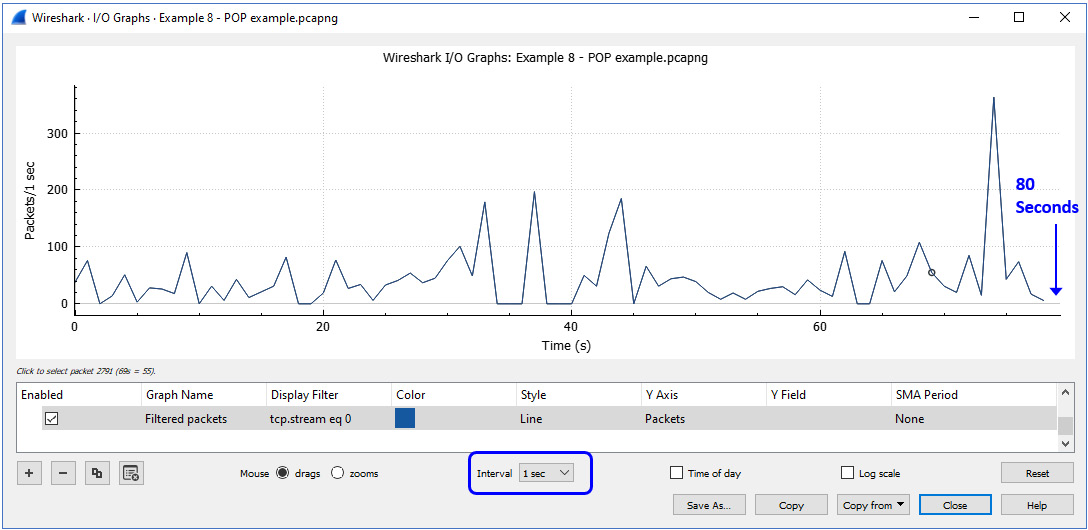
Figure 9.30 – Email (POP) traffic
To summarize this section, this is the meaning of a baseline. If this user is usually downloading emails for a few seconds, there is no reason for traffic to last for 80 seconds on the same connection. If we are used to seeing mail connections last for a few seconds, a connection that lasts 80 seconds does not make sense.
Summary
In this chapter, we talked about discovering suspicious traffic patterns in a network. The most important insight from this chapter should be to know your networks' and applications' behavior, and you will recognize any abnormal activity.
In this chapter, we learned about the tools that you can use to create a baseline, how to establish a baseline and understand the traffic that runs in a network, and suspicious/ abnormal activities that we should be aware of.
In the next chapter, we will start to get into more detail on protocols for detecting device-based attacks, looking at ARP, IP, and TCP/UDP.
So, let's revise what we have learned till now.
Questions
Here are a few questions to test your understanding of the chapter:
- NetFlow/IPFIX are protocols that are used for:
- Continuous monitoring of packets/bytes/gits per second
- Packet analysis and deep packet inspection (DPI)
- IP (Layer 3) and TCP/UDP (Layer 4) statistics
- All of the above
- In the Example 1.pcap capture file, you will see STUN packets. What are they used for in this example?
- Malware discovered in the end device (user laptop)
- A connection to Cisco Webex servers
- A connection to a streaming server that is used for video transmission
- A video conference application
- A network traffic baseline includes:
- Any information on users and what they send to or receive from networks
- IP addresses and TCP/UDP port numbers
- IP addresses and TCP/UDP port numbers and conversations
- Application types and TCP/IP information
- A scanning pattern will have the following identifiers (IDs):
- A single station that sends packets to the entire network
- Many stations that send packets to a single station
- Short inter-packet intervals—in some cases, fixed-size packets
- All of the above—depends on scanning type
- Upon identifying a scanning pattern, you should take which of the following steps?
- Immediately disconnect all sources related to the scan.
- Identify the scanning sources, verify that they are a problem, and if so, disconnect them.
- Immediately lower the port priority on the port connected to the scanning source.
- Identify the scanning source, disconnect it, and dig into the details to resolve the problem.