In this section, we evaluate the performance of MGOR by simulation, and compare the performance of MGOR with multirate geographic routing (MGR), single-rate geographic routing (GR), and single-rate opportunistic routing. Our MGOR degenerates into MGR, when we choose only one forwarding candidate and further degenerates into GR, when we also fix the transmission rate. For all the OR protocols, candidates closer to the destination are assigned higher relay priorities. The performance metrics we evaluate include: throughput, delay and hop count. In order to get insight into our rate and candidate selection algorithm, for MGOR, we show the number of packets transmitted at each rate in the whole network and the average number of forwarding candidates used at each node on each data rate.
8.6.1 Simulation Setup
We implement the multirate link quality measurement mechanism and MGOR protocol with compressed slotted ACK in GlomoSim. The FindMOEOT algorithm proposed in Section 8.4 is used to select transmission rate and forwarding candidates for MGOR. This algorithm is also used to select forwarding candidates for single-rate GOR by fixing the transmission rate. According to the analysis in Section 8.4 and considering the candidate coordination overhead, the maximum allowable forwarding candidate number (rmax) is set as 3. Other than the candidate coordination scheme, our OR protocol follows the same CSMA/CA medium access mechanism as that in 802.11b. The simulated network has 50 stationary nodes randomly uniformly distributed in a d × dm2 square region. When the SNR is larger than a defined threshold and the signal receiving power is above the corresponding threshold, the packet is received without error. Otherwise the packet is dropped. Table 8.2 lists the related simulation parameters. According to the findings in (Sang et al. 2007) and the discussion in Section 8.2.4, we assume the candidate coordination can be ensured by the compressed slotted ACK mechanism.
Table 8.2 Simulation parameters
| Simulation parameter | Value |
| Nodes number | 50 |
| Transmission power | 15 dbm |
| Data transmission rates | 11 mbps, 5.5 mbps, 2 mbps |
| ACK transmission rate | 1 mbps |
| Retry limit | 5 |
| Carrier sensing threshold | −100 dbm |
| 11 mbps receiving threshold | −83 dbm |
| 5.5 mbps receiving threshold | −87 dbm |
| 2 mbps receiving threshold | −91 dbm |
| 1 mbps receiving threshold | −94 dbm |
| Pathloss model | Two-ray |
| Fading model | Ricean with K = 4 |
| Hello packet interval | 1s |
Reproduced by permission of © 2009 IEEE.
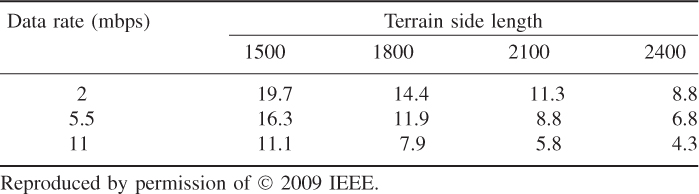
We examine the impact of node density on the performance by setting d = 1500, 1800, 2100, 2400. The corresponding network density in terms of average number of neighbors per node at each rate is summarized in Table 8.3. We randomly choose 25 communication pairs in the network. The sources are CBR (constant bit rate). We examine two different packet sizes. All the results shown in Section 8.6.2 are under 512-byte packet size, and Section 8.6.2 discusses the performance with packet size of 1024 bytes. We examine two traffic demands with CBR interval at 60 ms and 75 ms. User Datagram Protocol is used as the transport layer protocol. Each communication session continues for 40 s. All the simulation results are averaged over 25 flows under five simulation runs with different seeds.
Table 8.3 Average number of neighbors per node at each rate under different network densities
8.6.2 Simulation Results and Analysis
8.6.2.1 Throughput and Delay
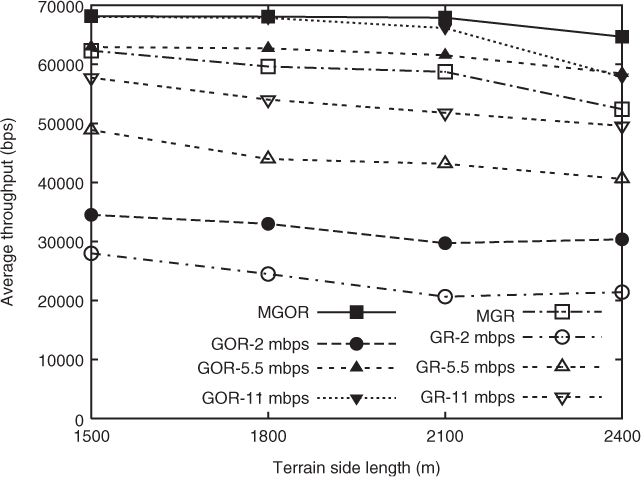
The throughput is measured as the average throughput per flow in the communication period. We first set the CBR packet interval as 60 ms in order to push the traffic demand approaching to the capacity of MGOR. Figure 8.3 shows the throughput of MGOR, single-rate GOR, MGR, and single-rate GR. We can see that MGOR achieves the highest throughput among all the protocols and yields up to 20% higher throughput than MGR (when the terrain side length is 2400 m). Generally, opportunistic routing protocols achieve higher throughput than the corresponding traditional routing protocols at each rate. The spacial diversity gain introduced by involving multiple forwarding candidates in opportunistic routing does increase the probability of a successful transmission at each hop, which reduces the retransmission overhead. The reduction of retransmission can alleviate the medium contention and allow more packets to get through in the network and result in higher throughput. We would like to point out that due to the randomness of the network topology and limited transmission range, the packet lost in 11 mbps GOR and GR is partially due to the communication void where a forwarding node cannot find any neighbor that is geographically closer to the destination. Solving the communication void problem in geographic routing is out of the scope of this chapter. However, we note that lowering the transmission rate (from 11 mbps to 5.5 mbps) increases the transmission range and improves the network connectivity, which in turn alleviates the void problem. This can be seem as a side effect or advantage of multirate geographic routing protocols over single rate ones. That is, by using our local candidate selection and rate adaptation schemes, the multirate protocols take advantage of higher transmission rate (11 mbps) whenever there is sufficient spacial diversity or node density, but switch to lower rate to improve spacial diversity and connectivity in sparser area. Similar observation is obtained in an 18-node 802.11b indoor mesh network tested that the throughput of multirate opportunistic routing is higher than any single-rate one (Laufer and Kleinrock 2008).
Figure 8.3 Throughput of MGOR, single-rate GOR, MGR, and single-rate GR under different network densities with CBR interval at 60 ms. Reproduced by permission of © 2009 IEEE.
The delay performance of these protocols with CBR interval at 60 ms is shown in Figure 8.4. We can see that all the opportunistic routing protocols achieve much lower delay than the corresponding traditional ones. Generally, MGOR achieves the lowest delay among all the protocols. When the network density is high, 11 mbps GOR achieves almost the same delay (0.01 s and 0.015 s with terrain side length being 1500 m and 1800 m, respectively) as MGOR. When the network becomes sparser, MGOR outperforms 11 mbps GOR. In the saturated network, the end-to-end delay consists of per-hop queuing delay, data transmission and retransmission delay, and medium access delay. Opportunistic routing makes use of multiple forwarding candidates to relay packets, thus improves per transmission reliability. This enhancement of reliability reduces retransmission delay, which in turn reduces the queuing and medium access delay, thus reduces end-to-end delay.
Figure 8.4 Delay of MGOR, single-rate GOR, MGR, and single-rate GR under different network densities with CBR interval at 60 ms. Reproduced by permission of © 2009 IEEE.

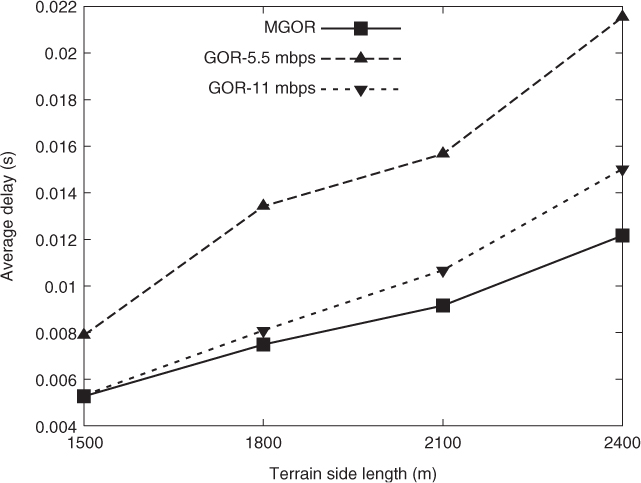
In order to conduct a “fairer” comparison between MGOR and GOR at 11 mbps and separate the impact of the transmission reliability on the end-to-end delay from other factors (such as excessive medium contention and long queuing delay due to high traffic demand, and communication voids), we run another simulation with lower traffic demand where the CBR interval is set as 75 ms and only count the cases without communication voids. This traffic demand is below the capacity of MGOR and GOR at 11 mbps and 5.5 mbps, so they achieve nearly the same throughput as shown in Figure 8.5. Figure 8.6 shows the delay performance of these three protocols. We can see that MGOR achieves lower delay than the other two protocols, especially when the network becomes sparser. MGOR can tune its transmission rate at each hop according to different network conditions to maximize OEOT. When the number of neighbors at 11 mbps is small, MGOR transmits packets at 5.5 mbps in order to involve more forwarding candidates to harvest the opportunistic gain (e.g. achieve higher transmission advancement and reliability). When transmitting at 11 mbps already introduces sufficient spacial diversity, MGOR chooses to transmit at higher rate (11 mbps). We will show the proportion of packets transmitted at each rate in MGOR later.
Figure 8.5 Throughput of MGOR, single-rate GOR, MGR, and single-rate GR under different network densities with CBR interval at 75 ms. Reproduced by permission of © 2009 IEEE.

Figure 8.6 Delay of MGOR, single-rate GOR, MGR, and single-rate GR under different network densities with CBR interval at 75 ms. Reproduced by permission of © 2009 IEEE.
We also find that although MGR can support at least 96% of this lower traffic demand, it still presents one or two orders of longer delay than MGOR. The difference of transmission reliability is the essential reason of this observation. That is, MGR has only one predefined forwarding candidate, so it usually needs more than one transmission to deliver a packet at each hop, whereas MGOR usually needs only one transmission since it introduces multiple forwarding candidates and improves transmission reliability.
Since the relative performance of hop count, average number of forwarding candidates and proportion of packets transmitted at each rate of each protocol is similar under these two traffic demands, we only show the simulation results with CBR interval at 75 ms in the following discussions.
8.6.2.2 Hop Count
From Figure 8.7, we can see that GOR has larger hop count than GR at each single rate. Although GOR allows packets to be forwarded on long-distance links, some forwarding candidates with smaller advancement may also be chosen as the actual forwarders, which results in larger hop count. The hop count of MGOR is nearly the same as MGR, and is between those of GOR at 11 mbps and 5.5 mbps, but closer to that at 5.5 mbps. The rate-distance tradeoff is explicitly shown in the figure for both GR and GOR, that is, the hop count of lower rate is smaller than that of higher rate, since lower rates results in longer transmission ranges.
Figure 8.7 Hop count of MGOR, single-rate GOR, MGR, and single-rate GR under different network densities with CBR interval at 75 ms. Reproduced by permission of © 2009 IEEE.

8.6.2.3 Average Number of Forwarding Candidates
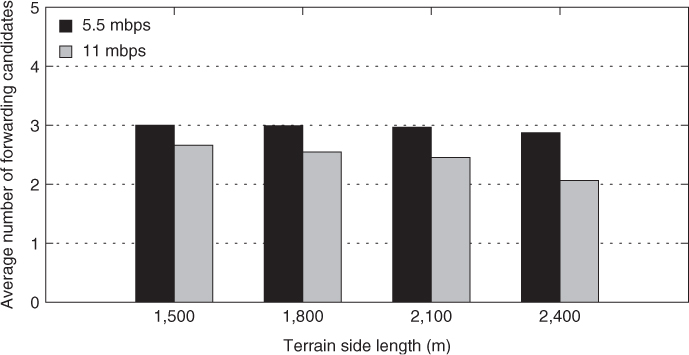
Figure 8.8 shows the average number of forwarding candidates at each rate for MGOR. We can see that the number of forwarding candidates at each rate decreases when the network density is decreased. Furthermore, transmission at lower rate (5.5 mbps) results in more forwarding candidates than at higher rate (11 mbps). In our MGOR, we do not choose 2 mbps transmission rate, as the traffic demand is already larger than the capacity that 2 mbps can provide.
Figure 8.8 Average number of forwarding candidates of MGOR under different network densities with CBR interval at 75 ms. Reproduced by permission of © 2009 IEEE.
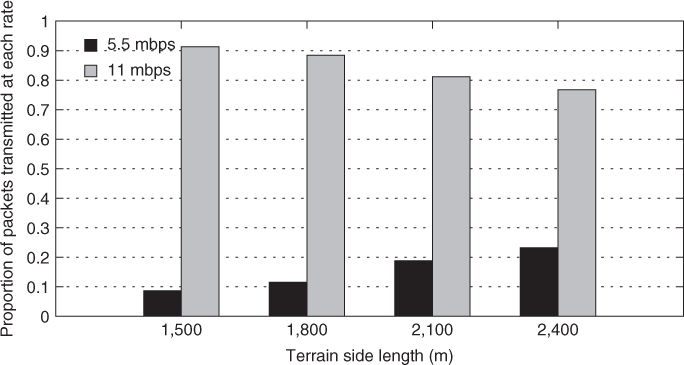
8.6.2.4 Proportion of Packets Transmitted at Each Rate per Node
Figure 8.9 shows the proportion of packets transmitted at each rate per node. We can observe that when the network becomes sparser, more packets are selected to be transmitted at 5.5 mbps in our MGOR protocol than when the network is dense. Lower transmission rate results in longer transmission range, which leads to a greater number of neighbors (shown in Figure 8.8) and increases spacial diversity. The increased diversity gain does improve the probability of a successful transmission, which reduces the retransmission overhead, then improves the throughput (shown in Figure 8.3) and decreases the delay (shown in Figure 8.6).
Figure 8.9 Proportion of packets transmitted at each rate of MGOR under different network densities with CBR interval at 75 ms, packet size = 512 bytes. Reproduced by permission of © 2009 IEEE.

8.6.2.5 Impact of Packet Size
We also evaluated the impact of packet size on the selection of transmission rate. By comparing Figure 8.10 with Figure 8.9, we notice that when the packet size is larger (such as 1500 bytes in contrast to 512 bytes), more packets are transmitted at higher data rate (i.e. 11 mbps). Because when the packet payload size is increased, the time of protocol overhead (such as packet header, preamble and ACK transmission time) becomes relatively smaller compared to the payload transmission time. So higher transmission rate will be more favorable when packet size becomes larger.
Figure 8.10 Proportion of packets transmitted at each rate of MGOR under different network densities with CBR interval at 75 ms, packet size = 1500 bytes. Reproduced by permission of © 2009 IEEE.