
6.3 Simulation Results and Evaluation
In this section, we evaluate and compare the performance of FSA with SA and CSA in GloMoSim (Zeng et al. 1998). We also introduce a perfect detection-based scheme, IDEAL, as the baseline for comparison. The IDEAL scheme is the same as FSA, except that all the ACKs in IDEAL are 100% reliable and the detection judgement is 100% precise. As our focus is on the efficiency of different coordination schemes given the same candidate set and the corresponding forwarding priorities, we use an existing candidate selection algorithm based on a node's geographic locations and adopt the local metric expected one-hop throughput (EOT) (Zeng et al. 2007) to select candidates. We will elaborate this local metric in Chapter 8.
Because the existing popular network simulators, such as NS-2 (McCanne and Floyd 1997), OPNET (www.opnet.com), GloMoSim (Zeng et al. 1998), have not implemented the PHY layer's function like energy integration or matched filter module currently, we have done some modification to the PHY layer in GloMoSim and make the detection judgment based on the following probability model. We define the CCA error floor (Zhen et al. 2008) at the optimal threshold, which can be achieved by equating 1 − Pd and Pfa where Pd is detection possibility and Pfa is the false alarm possibility. Then the CCA error floor for ED-based CCA and PD-based CCA can be expressed in terms of the Q function (Kay 1998):

We define the following performance metrics.
- Throughput: the ratio of the number of received bits to the whole session time.
- Delay: the per-packet end-to-end time delay from the packet being sent out until it reaches the destination.
- Packet deliver ratio: the number of successfully received packets over the number of sent packets.
- Number of transmissions: the total number of data transmissions occurring during the whole simulation time.
- Duplicate delivery ratio: the number of duplicate packets received at all the destinations over the total number of received packets.
- Retransmission ratio: the transmission number needed for a successful one-hop forwarding.
The simulation results of all metrics except for the number of transmissions are averaged over 25 flows under 5 simulation runs with different seeds.
6.3.1 Simulation Setup
We developed a simulation environment with Glomosim. The MAC protocol is based on 802.11b, but with some modifications. Since the source code of SA and CSA schemes are not publicly available, we implemented our own version. Table 6.1 lists all the related simulation parameters.
Table 6.1 Simulation parameters
| Simulation parameter | Value |
| Number of nodes | 50 |
| Stationary or dynamic | stationary |
| Data transmission rate | 11 mbps |
| ACK transmission rate | 1 mbps |
| Retry limit | 5 |
| Contention window | 31–1023 |
| Radio sensing threshold for data | −100 dbm |
| Radio receiving threshold for data | −83 dbm |
| Radio sensing threshold for ACK | −100 dbm |
| Radio receiving threshold for ACK | −91 dbm |
| Pathloss model | two-ray |
| Fading mode | rician |
| Rician k factor | 4 |
| Radio reception SNR | 10 |
| Hello packet intervial | 1s |
| Size of candidate set | 3 |
| CCA window | 15 μs |
| SIFS | 10 μs |
| Radio receive/transmit turnaround time | 5 μs |
Reproduced by permission of © 2009 IEEE.
All these 50 nodes are randomly uniformly distributed in a d × dm2 square region where d = 1400, 1500, …, 1800. The corresponding average number of neighbors per node and average hop counts per flow are listed in Table 6.2.
Table 6.2 Average number of neighbors per node and average hops per packet under different network densities
| Terrain size | Neighbors | Hops |
| 1400 | 12.42 | 2.17 |
| 1500 | 10.90 | 2.50 |
| 1600 | 9.65 | 2.67 |
| 1700 | 8.60 | 2.96 |
| 1800 | 7.79 | 3.17 |
We randomly choose 25 communication pairs in the network. The sources are CBR (constant bit rate) and each packet being 512 bytes long. User Datagram Protocol (UDP) is used at the transport layer. Each communication session lasts 120 s. Before all the transmissions start, the simulation environment will go through a 30 s warm-up phase, during which each node sends out a “Hello” packet periodically to learn the neighbors, information and this learning process lasts through the simulation.
6.3.2 Simulation Results and Evaluation
6.3.2.1 Delay
Figure 6.4 shows the average per packet end-to-end time delay of SA, CSA, FSA and IDEAL. In order to make a fair comparison, we set the packet interval of all the data flows to be 120 ms, which promises all the schemes can handle the traffic demand (in this case, all the protocols achieve 100% delivery ratio and almost the same average per flow throughput of 34 kbps, thus we will not show the performance comparison of these two metrics in this setting). We see that SA has the highest delay value under all terrain side lengths and CSA performs slightly better. Fast slotted acknowledgment achieves a far lower time delay than these two schemes and very close to the performance of IDEAL, which has the lowest delay value. From this result, firstly, we can get the conclusion that the use of the channel assessment technique indeed can alleviate the potential collision problem caused by the ACK's unexpected missing. Secondly, we also notice that the time delays for CSA, FSA and IDEAL grow very slow as the terrain side length increases. This demonstrates that applying the channel assessment technique can also make the delay more stable under different network densities. Finally, we observe that FSA experiences less than half the time delay of CSA under all the terrain side lengths. This reduction in time delay can be attributed mainly to the single ACK design.
Figure 6.4 Average per-packet end-to-end time delay. Reproduced by permission of © 2009 IEEE.

6.3.2.2 Number of Transmissions
Figure 6.5 shows the total number of data transmissions during the simulation time. We see that as the terrain side length increases all schemes need a greater number of transmissions to deliver these data flows. This can be explained by the simultaneous increment of average hop count shown in Table 6.2. We also can observe that FSA needs a lower number of transmissions than CSA and SA. This proves that FSA can not only greatly reduce the time cost for the coordination process but also can achieve better coordination reliability, which contributes to the reduced number of transmissions.
Figure 6.5 Total number of transmissions needed for delivering all the data flows.

6.3.2.3 Duplicate Deliver Ratio and Average Retransmission Ratio
The per-packet duplicate ratio shown in Figure 6.6 and average retransmission ratio shown in Figure 6.7 can further demonstrate that FSA is more reliable. In Figure 6.6, we see that of all the data packets received successfully by the destinations of these data flows, there are approximately 6%–14% duplicated ones for SA and 0.4%–2% for CSA under different terrain side lengths. However, the duplicate ratios for FSA are almost zero under all terrain side lengths, which are very close to the performance of IDEAL. This confirms our analysis in Section 6.2.2, which concludes that the probability of candidates in FSA missing the presence of a higher priority candidate's ACK and of this resulting in duplicate forwarding is very low, but the probability of candidates in CSA receiving corrupted ACKs from other candidates and leads to duplicate forwarding is not negligible. In Figure 6.7, we see that IDEAL achieves an average retransmission ratio of approximately 1.01 under all terrain side lengths. The ACKs in IDEAL scheme are exempt from fading or interference, so the only reason for retransmission in IDEAL is that all the candidates fail to receive the data packet. Such low retransmission ratio shows that OR schemes with multiple candidates can indeed greatly increase the forwarding reliability. We also note that FSA's performance is close to the IDEAL, with an average higher ratio of 0.5%. This shows that the use of a single ACK in FSA is sufficiently reliable to acknowledge the sender.
Figure 6.6 Average per-packet duplicate ratio counted in the final receivers. Reproduced by permission of © 2009 IEEE.

Figure 6.7 Average one-hop retransmission ratio. Reproduced by permission of © 2009 IEEE.

6.3.2.4 Packet Delivery Ratio and Throughput
In order to evaluate the throughput performance of all the schemes, we set the packet interval of all data flows to be 70 ms, which makes a relatively heavy traffic load. From Figure 6.13 we see that SA and CSA are unable to handle the traffic demand and can only achieve packet delivery ratio of 87%–81% and 81%–74% respectively under different terrain side lengths. However, FSA still performs well and achieves 100% delivery ratio under different terrain sizes, just like IDEAL. Since our throughput metric is the ratio of the number of received bits to the whole session time and all the schemes have the same simulation time, thus the throughput is proportional to the packet delivery ratio. From Figure 6.8 we can see that FSA can achieve a throughput of approximately 54 kbps, with an average gain of 12.5%–20% compared with CSA's throughput under different terrain side lengths. The reason is that FSA takes less medium time in each hop's transmission and thus possesses a higher throughput capacity and the traffic demand in this setting is still within its capacity range. The significant higher time delay of SA and CSA shown in Figure 6.9 is also due to the fact that the traffic demand under this setting is beyond the throughput capacity of these two schemes, which cause each packet to suffer a long waiting time in the packet queue of every intermediate relay node. This long queuing delay further aggravates the duplication and retransmission problems, which can be observed in Figure 6.11 and Figure 6.12. From Figure 6.10 we observe that SA still has the highest number of transmissions during the simulation, but it can achieve the lowest throughput. This is not strange because the potential collision problem is exacerbated under a heavy traffic load. However, we also observe that the total transmission number of FSA and IDEAL is higher than CSA under terrain side lengths of 1700 m, 1800 m. This “abnormal” case also proves that nodes in FSA and IDEAL are more positive in transmitting rather than waiting in queue or backing off.
Figure 6.8 Average per-flow throughput.

Figure 6.9 Average per-packet end-to-end time delay.

Figure 6.10 Total number of transmissions needed to deliver all the data flows.

Figure 6.11 Average per-packet duplicate ratio counted in the final receivers. Reproduced by permission of © 2009 IEEE.
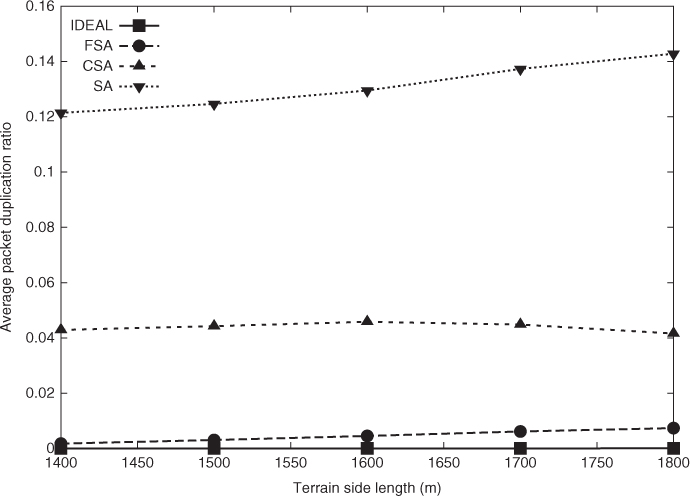
Figure 6.12 Average one-hop retransmission ratio. Reproduced by permission of © 2009 IEEE.

Figure 6.13 Average per-flow delivery ratio. Reproduced by permission of © 2009 IEEE.
