CHAPTER 11
Guided Analytics: Making It Relevant
So, What?
Imagine you are a newly hired analyst for the Edison Motors (EM) car company. Your first week on the job, your manager tasks you with producing a Vehicle Safety and Quality Dashboard to track two of the company's KPIs—Safety and Quality. Directing you to the customer complaints database, your manager tells you the executives want to know how many customer complaints are received, what are they about, where are they from, how they compare to our competition, whether any were hazardous, and so on. She also tells you that it would be nice if the dashboard could help spot patterns and trends and provide early warning alerts to growing quality or safety issues.
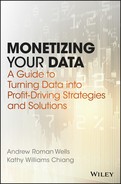
You get the dataset, explore the data, clean it up, and within a week you have a dashboard that you think is pretty good (see Figure 11.1).

Figure 11.1 Edison Motors Customer Complaints Dashboard
You show it to your manager, whose response is underwhelming to say the least.
Your boss is being kind. This is a common scenario played out day after day in many organizations. The truth is your manager nailed it when she said the dashboard doesn't tell her anything she doesn't already know.
Too many dashboards, charts, and reports simply play back information that is readily apparent. In many cases, they overwhelm the user with lots of data but little information. They don't present the information in a manner to make it easy for the user to read. They place the burden on the user to process the data and extract insights. In short, they simply help the user read the news and they do not answer questions. Rather they beg the question, “So, what?”
One of the key premises of this book is that too often analytics and reporting occur in silos, isolated from key business objectives, disconnected from decisions. If, instead, your organization has developed a Decision Architecture with identified business objectives, question analysis, key decisions, action levers, and success metrics, then your job of building a dashboard that guides the user through the analysis to the so-what? question, a process we refer to as Guided Analytics, becomes straightforward and not a guessing game. The Category Tree lends itself naturally to a cascading dashboard layout. The Action Levers of the Decision Architecture and the Business Levers of the Monetization Strategy inform the content of the dashboards and diagnostics. The Success Metrics define the KPIs to monitor.
Even as we begin with a well-thought-out Decision Architecture, the iterative nature of Guided Analytics development results in new insights from exploration of the data that may lead us to revise and extend some of our underlying hypotheses and diagnostic evaluations.
In this chapter we use our imaginary scenario to introduce fundamental principles of Guided Analytics and show how you can apply them to a typical analytical solution. We take you through the journey of crafting Guided Analytics that help users navigate through complex and interconnected data. We also show you how to present data visually that is pleasing to view and easy to comprehend. We show you how, by building your dashboards on a firm foundation of visual analytics and user experience principles, you can relieve the users of the burden of processing information, letting them focus their attention on the story the data would love to tell them.
Guided Analytics
Guided Analytics is both art and science. Decision Architecture and Monetization Strategy provide the structure and analytic goal. Data science and data development contribute the insights, and design of the user interface and user experience bring art to the table. However, even before marrying science to art, if we want our analytics to have impact, we must bring out the Voice of the Data to support the solutions. The Voice of the Data is actually the harmony of two voices:
- The Voice of the Customer
- The Voice of the Business
In the following sections we follow the Voice of the Data through a journey that gives life to the voices of our customers and business processes, telling us what our customers want through their actions, informing our strategies, and showing us which levers have the most impact.
The Voice of the Data
Presentation of analytics has come a long way in understanding that business analytics is more than presenting tables full of data. Rather it tells stories that speak to business managers, stories that get users excited about the opportunities, fearful about the threats, and ready to conquer the competition.
Business analytics is well suited to tell a story because all data has a voice, be it the voice of the customer, the voice of the process, or the voice of the business. You may be familiar with surveys, referred to as Voice of the Customer surveys, that ask customers what they think about a product or company. While these surveys are useful and can provide pertinent information to gain a deeper understanding of what our customers think about our company's products and services, they suffer from several limitations. It is impossible to be able to ask customers all the questions we would like to ask; the more we ask, the fewer customers we find willing to answer. So we typically rely on statistical methods to try to achieve an approximation of customer views accepting limitations on what we can know.
There is another Voice of the Customer that is overlooked or drowned out in our business reporting practices. That is the record of each and every business transaction the customer leaves with us when they buy our products or services, when they call our customer care centers, when they return products, when they stop doing business with us.
Before the advent of analytic databases with increasingly powerful CPUs, cheaper data storage, easy-to-use data-mining programs, and data visualization tools, customer granular data was expensive to keep, difficult to analyze, and hard to comprehend. Accordingly, customer performance metrics have typically been reported as aggregated averages for the whole group or at best some predefined segment, such as average revenue per consumer user versus average revenue per business user. With advances in analytic processes and technologies, we no longer have to settle for aggregates and averages. Such figures are a good place to start but they are not the end.
Let's return to our Customer Complaints dashboard project for Edison Motors. The name itself indicates that there is a powerful voice of the customer in the data—they are voicing their dissatisfaction with our products. But there is also a voice of the business in the data as well. By examining when, where, and what our customers are complaining about, we can uncover flaws in car design that may not be suited for certain terrains, or quality issues in our production processes or problems in our customer care processes.
Marrying the data with other sources that we have about the market and competitors, we may discover that customers hold us to a higher or lesser standard of performance than our competitors. Examining patterns in the data can tell us if there are seasonal patterns at play. And knowing something about the types of customers may give us insights into shifting patterns of behavior. In turn these insights can inform the Actions and Business Levers we select when developing our Decision Architecture and Monetization Strategy.
The Voice of the Customer
Let's take a look at who is complaining (Figure 11.2) based on whether they are the original owners of the vehicle and compare it to the mileage on the vehicle at the time of the complaint. We also want to know if average mileage (Figure 11.3) is increasing for both ownership cohorts, Original Owner and Not Original Owner, at the same rate.

Figure 11.2 Complaints by Year

Figure 11.3 (a) Average Mileage by Year of Complaint; (b) Annual Mileage Rate of Change by Year of Complaint
The charts are telling us some interesting information. As shown in Figure 11.2, prior to 2007, original owners complained about as much as used car owners. After 2007, complaints from original owners declined dramatically whereas complaints from used car owners increased sharply. We also notice in Figure 11.3a that average mileage is increasing both for original and used car owners, but at a higher rate for original owners (Figure 11.3b).
We decide to check on the length of time the customer has owned the car at the time of complaint (see Figure 11.4).

Figure 11.4 Average Length of Ownership by Year of Complaint
Making a note to examine the anomalies in 2002 and 2013 later, we observe that while both cohorts exhibit increasing trends, original car owners appear to be holding onto their vehicles longer at a higher rate than used car owners, with a noticeable notch increase in 2007 with the commencement of the Great Recession.
We wonder if there is a relationship between vehicle mileage, ownership period, and complaints. We run through a few charts to check and note similar decay curves of complaints relative to vehicle ownership period (Figure 11.5). We also observe that used car owners tend to complain more in the first few years of ownership whereas original car owners tend to hold out longer, but both drop off after a period of usage (Figure 11.6).

Figure 11.5 Complaints by Vehicle Ownership Period

Figure 11.6 Complaints by Mileage by Car Owner Cohort
There are many other paths we could travel down, but we believe you get the point and realize you have a story to tell your boss about the pattern of customer complaints, which is as follows.
Vehicle owners tend to file complaints more in the early period of their ownership when they are less familiar with the vehicle and issues may need to be ironed out with the new car. Over time, the problems have been addressed or the owner accepts the condition as normal. Following the beginning of the economic crisis of 2007, original car owners started holding onto their cars longer, resulting in a greater percentage of older or more problematic cars available in the used car market. There appears to be a relationship between the average mileage of the vehicle and the number of complaints that declines with the increased mileage of the car. By studying this probability pattern and monitoring the age of the fleet of our cars in the market, we might be able to anticipate and better prepare for waves of customer complaints.
This story can help guide the Decision Architecture team developing action levers that involve customer satisfaction, product development, or customer service business levers.
Customer Signatures
While each customer is unique, business marketing thrives on the fact that segments of likeminded customers with similar attributes can be identified. Many segmentation models group customers based on static (or relatively static) characteristics of the customer, such as gender, interests, lifestyle, demographics, cultural heritage, and so on. While such segmentation schemes are useful when you can identify your customers, in many businesses it is not possible to know who your customer is.
Advances in digital marketing technologies are helping to overcome this blindness, but in many cases we simply are not able to know who is really behind the clicks or purchases. What really matters is how our customers interact with our products and services. It is in this interaction that the voice of the customer in our data can speak volumes. Using our Decision Architecture to identify and apply data-mining techniques, we can identify customer patterns of behavior at key decision points in our marketing programs. We think of these patterns as customer signatures. Each customer has a unique signature, but with advances in data mining we can identify common patterns of behavior that permit us to segment our customers based on communities of interest.
If we are a communications company, for example, we might identify a cluster of customers who, on a regular basis, have a significant percentage of text messaging late at night within the vicinity of a local college. Applying other factors, we can reasonably determine we have identified a segment of college students and can tailor our direct marketing efforts to this cluster.
The Voice of the Business
In the same way that our customers speak to us through our data, our business processes also have a voice. When we are able to look inside the data and behind the averages, we can see patterns and outliers that all tell us useful information about how our business is performing in the market.
Let's take a closer look at the complaint trends since 1995. Looking at a sparkline chart of complaints by major component category sorted by greatest to least complaints, we observe a range of patterns, many of which display a steady signal of noise (Figure 11.7). But the pattern for the power train catches our attention.

Figure 11.7 Monthly Complaints by Vehicle Component
Since 2010, there appears to be an annual spike mid-to-late summer (see Figure 11.8). With further analysis you determine the pattern is concentrated in a sedan model in the summer. The Voice of the Business is suggesting there are design or production issues leading to heat-related problems, giving rise to a spike in complaints each summer.

Figure 11.8 Monthly Power Train Complaints by Sedan Model
You see an opportunity to use control charts to create an alert tool. When the data crosses the upper control limit (UCL) you have a signal that is significant and you have visibility into the Voice of the Business to determine if it is an issue that is recurring, growing, or getting better, as illustrated in Figure 11.9.

Figure 11.9 Sedan Model Power Train Control Chart
But the charts are rather complicated with a lot of data. Thinking about your boss's feedback, you realize it is difficult for a reader to comprehend at a glance. More work is needed to present the charts in a manner quick to comprehend and easy to navigate. User interface (UI) and user experience (UX) play an important role in developing Guided Analytics that are quick to read and easy to use.
Summary
We have covered the basic function of Guided Analytics and the role it plays in our methodology for Decision Architecture. We have introduced you to the voices of the customer and business that speak through your data. Many rich stories about customer experience and business performance can be found in the data once you learn how to listen.
In the next chapter we take you through the principles of UI that help you create better charts to tell your story so that your audience can get the point at a glance. In the subsequent chapter, we cover the essentials of UX to aid you in designing dashboards that work for your audience rather than making your audience work to get your point.