CHAPTER 2
Analytical Cycle: Driving Quality Decisions
This quote is from Frank van den Driest, Stan Sthanunathan, and Keith Weed's article, “Building an Insights Engine.” Later on in the same article, they continue with,
Both of these concepts are vital to this chapter and this book. The problem they are referring to is a gap that exists between our ability to define what is relevant information and how to monetize it. We show you how to close this gap through our Analytical Cycle, the focus of this chapter, and Decision Architecture, a methodology comprising Decision Analysis, Agile Analytics, and Monetization Strategy.
The Analytical Cycle provides you with a frame of reference on how to solve analytical problems. The journey starts with the business problem statement and questions you ask yourself as you try to understand how to create an opportunity to monetize. Next, we discuss diagnostics, which is the problem solving that occurs as you look for decisions to make to capture the opportunity. Lastly, we focus on making our solution actionable and measuring our results. This process is enabled through data and informed by the user of the information and the analytical maturity of the organization. Let's start with an overview of the Analytical Cycle.
Analytical Cycle Overview
As we mentioned in Chapter 1, decisions are often impeded by our personal biases and noise. To raise the level and quality of your decisions, it makes sense to empower your managers with the collective wisdom (best practices) of the organization and provide diagnostic tools with algorithms to make better decisions. When we rely on managers to learn on the job and develop a “gut” instinct for the decisions through learned experiences, we expose ourselves to many traps such as cognitive bias. There is an abundance of evidence that supports this statement and points to the need for a fact-based decision process powered by analytics.
An example of this is from one of the most famous individuals in history, Sir Isaac Newton. In the early eighteenth century, the South Sea Company was granted a monopoly on trade in the South Seas in exchange for assuming England's war debt. The idea that the company had a monopoly was of obvious appeal to investors and the company's stock began a six-month explosive run. Newton got into the investment early and saw his stock nearly double, at which point he decided to exit with a nice return. The stock continued to climb and Newton, feeling that he was missing out while his friends were getting rich, decided to reenter the investment at astronomical prices only to lose the bulk of his life savings. This prompted him to say famously, “I can calculate the movement of stars, but not the madness of men.”
Making decisions based on gut feel, intuition, or emotion leaves you vulnerable to the cognitive biases we all carry around with us. In the case of Newton, it was an emotional decision based on the fear of missing out while his friends got rich. In the Decision Theory chapter (Chapter 8), we cover a full range of biases that you need to be aware of as you build out your analytical solutions. For now, let's look at an approach to making quality decisions.
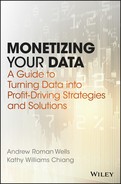
Making a quality decision is harder than ever before. We are flooded with information and are expected to synthesize this information into quality decisions in order to drive results. The first step on our path to utilizing this information is to distill it into what is accurate and relevant for our organization and job function. Once we have more accurate and relevant information, the next step is to diagnose or spot an opportunity in order to make a quality decision. With a better decision, we get higher quality actions that we can execute on to capitalize on an opportunity. The higher quality actions, the better our results and measurements. We are able to take these measurements as information to inform our next decision, and the cycle continues. Figure 2.1 depicts this concept.

Figure 2.1 Analytical Cycle
We refer to this virtuous cycle as the Analytical Cycle, which is broken down into four components: Inform > Diagnose > Action > Measure. The foundation for the entire process is data, and we should probably stress, quality data. Figure 2.2 is an abstracted version of the Analytical Cycle.

Figure 2.2 Analytical Cycle in the Abstract
This analytical cycle is structured very similarly to that of a doctor or scientist trying to diagnose an issue. Let's look at a hypothetical example. A patient walks into the doctor's office and the doctor is trying to diagnose a course of treatment based on verbal and visual information provided by the patient.
In Figure 2.3, the first step is for the doctor to take the patient's vitals and then proceed with a set of questions to narrow down the potential issue. We see that the patient has a rash and the doctor is going through a set of Inform questions to determine the potential cause of the rash. In this case, the doctor was able to get to a root cause in five questions and determine the issue must be associated with a poisonous plant.

Figure 2.3 The Analytical Cycle in Action
Once the doctor knows the root cause of the issue, the next step is to determine the type and severity of the rash to make a decision on what type of treatment plan. After a visual inspection and a few additional diagnostic questions, the doctor is able to make a decision. From the decision we have an action, which in this case is the treatment plan and the patient's application of medication in the prescribed amounts and duration. Finally, to measure the results, the patient is to monitor if the rash improves to determine the effectiveness of the treatment plan. If there is no improvement, a return visit will be needed.
We can see from the example that each of the analytical steps helps drive to a better quality decision. The doctor starts with a line of questioning to understand the issue and develops a hypothesis to narrow down the possible types of rashes. This is the Inform stage of the process and is driven by an initial hypothesis and a line of questions that perform a root cause analysis.
Once the doctor narrows the problem down to a poisonous plant, she begins a poisonous plant diagnostic to determine the type and severity of the rash in order to make a decision on the type of treatment. Once this information is understood, a treatment is prescribed for the patient. In our case, the treatment plan is the set of actions that the doctor and patient will take to resolve the issue. Finally, measuring the progress of the issue to determine effectiveness is necessary to see if the rash heals or if a more aggressive treatment plan is needed.
The Analytical Cycle helps guide us in the problem-solving process. By following these four steps with quality data, we enable our managers to make higher quality decisions. The next step is to build analytical solutions on top of this framework to empower the broader organization. Our Decision Architecture methodology in the next chapter picks it up from here to provide a deep dive into each of the individual steps.
Let's drill into each of the four steps of the Analytical Cycle, starting with the spark to the cycle, Inform.
Inform
Distilling the troves of information that our organizations collect starts with understanding what business problem we are seeking to solve. This is where we start our journey to let the business problem dictate the right information needed.
The Inform stage starts with a business problem statement and one or more hypotheses. The business problem statement should be in alignment to an overarching business objective or goal. Anchoring your hypothesis to a business problem statement creates alignment and focus.
A hypothesis is an educated guess or proposition to explain a potential outcome and guide an analysis. Your hypothesis should help solve the business problem statement. To form a hypothesis, take your knowledge of the business environment, market cycles, industry knowledge, current issues, and specific area of expertise to generate a set of statements you believe will solve the business problem. Your hypothesis guides the focus of your investigation. The more specific you can be with your hypothesis, the greater the direction you will provide the analysis.
Let's review an example. We have a Business Problem Statement to “grow revenue by 10 percent while focusing on our best customers” and want a few candidate hypotheses. Below are a few potentials:
The Inform stage starts with a hypothesis or question to ignite the analytical process. The next step in this stage is focused on asking questions to drive to a root cause to perform a diagnostic. These questions lead us to understand what is the core opportunity or issue we will use to develop our action plan. The questions asked during this stage also help us determine what datasets are needed to support the questions. This can come from existing reporting systems that are in place, onetime ad-hoc analysis, or new analytic environments to be developed.
For example, let's see what questions we have for Hypothesis 1:
Inform Questions/Answers:
- What are the top five most profitable product segments?
- Industrial—Heavy Duty
- Industrial—Small Bags
- Office
- Home Kitchen
- Recycling/Composting
- What is our market share in each of those product segments?
- Industrial—Heavy Duty—12%
- Industrial—Small Bags—9%
- Office—22%
- Home Kitchen—16%
- Home Recycling/Composting—29%
- What are the three fastest growing product segments and their respective growth rates?
- Office—12%
- Home Kitchen—16%
- Home Recycling/Composting—32%
- What are the average profit margins for each of these product segments?
- Office—40%
- Home Kitchen—36%
- Home Recycling/Composting—45%
As we can see, after about the fourth question, we start to narrow down a potential opportunity to help solve our hypothesis. The goal is to get to a probable root cause. At this point we can begin to develop a plan as we further diagnose the opportunity. From our example, we see that the Home Recycling/Composting segment is one of the fastest growing segments that also has the highest margins. We may want to focus our energy for our diagnostic on how we can improve this segment.
Diagnose
Merriam-Webster defines diagnosis as “investigation or analysis of the cause or nature of a condition, situation, or problem.” The intent of the diagnostic stage is to finalize the root cause analysis and make a decision on a course of action. Where the Inform stage is the filtering of information to drive to an issue or opportunity, the Diagnose stage takes the issue or opportunity and adds specificity to it along with a course of action to make a quality decision.
The Diagnose stage is where managers will spend their time analyzing and diagnosing opportunities or issues that translate into actions. They bring the actions to life through detailed analysis of information, usually driven by specific metrics that guide their analysis.
Let's take a look at our example from the last section and how it relates to the Diagnose stage. In our prior example we determine that the Home Recycling/Composting segment is an attractive segment to pursue as it has high margins and a high growth rate.
In the diagnostic stage we want to understand trends, forecasts, correlations, opportunity, and metrics that are more specific to the diagnostic. In this case we are going to perform a product diagnostic based on price and package combinations in the Home Recycling/Composting segment (Tables 2.1–2.4).
Diagnostic Questions/Answers
- What are the Package Price Combinations in the Home Recycling/Composting product segment?
- Tall Kitchen Compostable Bags—45 count ($8.89)
- Recycling Tall Kitchen Drawstring Clear Bags—45 count ($8.49)
- Recycling Large Trash Drawstring Blue Bags—45 count ($14.99)
What is our Competitor Pricing for each of these product lines?
Table 2.1 Competitor Pricing
Competitor A Competitor B Our Price Tall Kitchen Compostable Bags $8.45 $9.50 $8.89 Recycling Tall Kitchen Drawstring Clear Bags $8.07 $9.15 $8.49 Recycling Large Trash Drawstring Blue Bags $11.52 $15.68 $14.99 What has been the order volume trend for each of the products in the Home Recycling/Composting product segment for the last six months?
Month 1 Month 2 Month 3 Month 4 Month 5 Month 6 Tall Kitchen Compostable Bags 11,091 12,099 11,441 11,789 11,273 11,804 Recycling Tall Kitchen Drawstring Clear Bags 5,928 6,003 6,189 6,224 6,431 6,577 Recycling Large Trash Drawstring Blue Bags 4,334 4,729 5,035 5,632 6,101 6,871 What do the next 90 days look like for our Order Pipeline to Forecast and Budget for the Recycling Large Trash Drawstring Blue Bags product line?
If we want to target a marketing campaign focused on the purchase of Recycling Large Trash Drawstring Blue Bags with a $.50-off instore coupon for a total purchase price of $14.49 ($14.99 minus $.50) to create awareness in underperforming outlets, what is the total opportunity by outlet type?
Table 2.4 Total Opportunity by Outlet Type
Outlet Type Number of Stores Current Penetration Product Profit by Outlet Type Opportunity Potential Ability to Achieve Large Grocery Store 38,000 28,553 $5.79 $54,698.13 Med Convenience Retail 64,500 5,211 $6.75 $400,200.75 Low Large Retail 11,200 9,837 $5.07 $6,910.41 Low Organic Specialty Stores 24,000 3,027 $7.97 $167,154.81 High
As you can see, the Diagnose stage has a different flavor than the Inform stage. In the Inform stage we filter information to get to a potential opportunity. In the Diagnose stage, we ask questions to solve for specifics around the opportunity in order to take action.
In the first part of the diagnostic we review Package Price combinations and how they compare to our competition. Next we want to know historical volume information for the past six months and forecast volume for the next three months. This analysis gave us an understanding of what products are growing the fastest. In addition, it tells us if the growth is a onetime occurrence or a trend that we believe will continue.
In our final analysis we look at the market share for the Recycling Large Trash Drawstring Blue Bags product line along Outlet Types. We are able to perform an opportunity analysis from this based on profitability and market potential. In addition, we rate each of the outlet types in terms of ability to achieve the opportunity amount based on type of channel and market share. Based on our diagnostic, we are ready to make a decision to focus on Organic Specialty Stores with a marketing campaign and sales force sell-in initiative.
The diagnostic process is enabled through decision analysis, data science, and decision theory. In this example, our Decision Analyses are the questions and thought processes that lead us to an opportunity. We leverage a decision matrix from the Decision Theory discipline to structure the analysis to determine which decision to make. Finally, we utilize Data Science to provide a confidence factor in our ability to achieve the results. We cover more on these topics in future chapters.
Action
The Action stage is about execution. Based on the action levers we develop in the Diagnose stage, it is time to execute in the marketplace. The ability to execute may vary depending on the type of action. If the action is to develop a pricing strategy, it might involve getting organizational buy-in at many levels and departments before you are able to act. If the action is developing marketing collateral, you may need to work with your marketing department. These dependencies with other departments in your organization are an important consideration. If your actions are too complex to commercialize, they have a low chance of succeeding.
When developing your actions, it is important to consider how to measure each action. Some actions are measured by simply executing on the activity. Others need the ability to correlate a response from a customer back to the particular action. For example, a coupon code on a marketing piece that has a specific marketing ID associated with it enables us to tie it back to a specific action.
In our example, the action is associated with the decision to generate marketing campaigns for the Organic Specialty Stores. At this point, our analysis may be complete as we have provided direction to the marketing department on a focused campaign strategy. We may also choose to take the next steps in our solution and provide marketing initiatives tied to the campaign.
Measure
Measuring is often the hardest step in the Analytical Cycle. Often, the time from analysis to measure is months, if not years, apart, making continuity difficult as people shift jobs, organizational changes occur, or business interests change. When the timelines are closer together, measurement gets easier as long as the action and the intent are recorded. There are two methods for measuring an action: direct or inferred responses.
A direct measurement is a link back to the original action. This can be from code on a webpage that links back to a marketing email showing a click-through occurred. The code is usually parsed with specific information that links back to any number of items that can include specific action type, date, category, and/or marketing campaign.
An inferred measurement is what the name implies; you do not have a direct link and need to infer that the sale was linked back to a specific action. This is much more common and also much more prone to error or interpretation.
An example of an inferred response would be reviewing sales of a specific product for up to six weeks after an action has been taken to see if there was a spike in sales. To be more specific in the example, if we choose to increase prices on a product, we want to measure the post-six-week time period to see if we sold more or less of that product with the new pricing structure. While we can't directly link a sale back to a particular action via a code, we can infer that the amount of sales is a result, for better or worse, from the price increase.
Measurement also gives us the lessons learned from the action to understand what is or is not working. This helps us when we develop our next set of hypotheses in the Inform stage. To extend our example, if we increase our price and it did not have any effect on the sales volume during that time, then we have a successful hypothesis. We are able to generate more money by increasing the price and not lose customers. This may lead to a hypothesis that the demographics in that outlet has shifted and other products may be ripe for price increases or new upscale product lines might be a better fit. These insights would start the analytical cycle over again.
Data
Data is at the heart of the Analytical Cycle. There are many facets to data, some of which include the quality of the data, ability to find relevant data, ability to stitch data together, knowing where to find the data, and internal versus external data.
The quality of the data, in our opinion, is one of the most important factors. It is the one component that either severely hinders or enables the analytical process. Without quality data that is meaningful to the business, you have tremendous difficulty driving insights.
The ability to quickly link relevant information together is another important factor. Information often sits in the various siloed data islands throughout the organization. One system may contain financial forecast information, the company enterprise data warehouse may contain sales transaction information, and a marketing database may contain customer segmentation information. Our ability to find and stitch these together drives what capabilities we can bring to the analytical solution.
This point is further validated in the article, “Building an Insights Engine,” in which the authors discuss the results of an i2020 research study. The article points to the results in which certain firms have built the capability to amass large amounts of information quickly in order to make quality decisions.
Another key component is finding the right individuals who can provide business context to the data. If your organization has a good master data program, this might be an easier task. In most organizations, individuals often have to relearn the business rules applied to certain data sets or find subject matter experts with tribal knowledge.
Lastly, various types of data can provide a competitive advantage. This might mean internal data or external data to drive specific insights. For example, in the same article, “Building an Insights Engine,” the author discusses an insights group called CMI at Unilever who leverage social information to solve a stockout problem.
Once you have the right data, your analysis can take life. In the chapter on Data Development (Chapter 10), we cover additional concerns, including the concepts of data quality, data transformation, and data structure.
Hierarchy of Information User
Another key concept when building an analytical solution is to know your user. Tailoring the analytics and diagnostics to the right user group is important. Imagine giving an executive an operational report that shows line item detail of purchases for a particular store in a particular city, when what the executive really wants is a summary of sales across regions. Please see Figure 2.4 for the level of detail that the various information users desire.

Figure 2.4 Hierarchy of the Information User
For an executive user, high-level metrics, aggregations, and alerts are probably more interesting. These can be displayed in a executive dashboarding format that allows the executive to easily interpret information to figure out if there are any major issues or opportunities. They may look for answers such as what products are performing well or what markets are underperforming.
For senior management, a dashboard may be the first place they start before drilling into the next level of information to gain an understanding of divisional, product, channel, or geographic issues. They may choose to drill deeper, but rarely at an operational level.
Middle managers, which would also include analysts, spend the bulk of their time in the data trying to understand how their division or product is doing and developing insights for action. The ability to translate an insight into action is best understood by the group that lives with the process, operation, or data on a day-to-day basis.
Operational managers are usually less interested in the high-level dashboard view and more interested in operational-level reports that will assist them with decisions in their day-to-day jobs. These might be decisions such as product replenishment, labor schedules, and detailed product sales figures.
Knowing your user helps you determine the right level of information and decisions to include in your analytical solution.
Next Steps
We are excited to start our journey together with the Analytical Cycle as backdrop for your monetization strategy. Over the next couple of chapters, we will go deep into the Decision Architecture methodology, Guided Analytics, and Monetization Strategy that will provide a step-by-step approach to building your analytical solution.
The important points to remember from this chapter are the four stages of the analytical cycle:
- Inform
- Diagnose
- Action
- Measure
The stages are enabled through quality data. We can enhance our analytical solution by working with a variety of data sets that improve our decisions. In addition, we also need to be aware of our audience and the level of detail the information consumer will require.
For additional tools, templates, examples, and workbooks, please visit us at www.monetizingyourdata.com.