Models for Phase A
Vision
Based on the Discount Travel company example, we identify which models and diagrams are useful during the Vision phase. Goals and objectives are key elements developed during the Vision phase. Modeling activity starts at this point.
7.1 Phase A artifacts
7.1.1 Nature of phase A artifacts: Vision
The vision phase prepares the following phases through a general representation of the baseline and target architectures (see Section 2.2.2). To provide a wide vision that can be used to scope all the work, the vision phase uses initial schemas of an essentially informal nature. These artifacts are very high level and do not yet involve detailed modeling activities. They will be developed “free hand,” in the form of images or matrices, in order to prepare later phases of the ADM. However, certain artifacts can still be translated in the form of models, and where this is the case, we show their correspondence. Translation into models, which is very quick to carry out based on initial schemas, is used to initiate future modeling work and to provide the first elements that will be used to trace decisions during the following phases.
Certain artifacts are clearly not part of any modeling phase, such as the stakeholder map matrix, defined by TOGAF as being “sensitive information which does not require any specific metamodel (therefore model) entities.”
One of the tasks of the vision phase is to prepare the ADM cycle. Essential business goals must also be prepared and validated.
Artifacts linked to business goals are often initiated during the preliminary phase or earlier before being reworked during the vision phase (phase A). They provide a framework for work to be carried out during the architectural cycle to come and will essentially be consolidated during the business architecture phase (phase B).
A general plan of the complete architecture cycle must be defined. For this reason, the first sketches of the envisaged solutions, which have their place for the most part in phases B and application architecture phase (phase C), must be established during phase A. Solution concept diagrams will notably be used to this end (Table 7.1).
Table 7.1
Phase A Artifacts
| TOGAF Artifacts | Models Presented | Remarks |
| Stakeholder map matrix | Stakeholder matrix | |
| Value chain diagram | Value chain diagram | |
| Solution concept diagram | Solution concept diagram | |
| Driver/Goal/Objectives catalog | Goal diagram | The goal diagram is an extension to TOGAF allowing it to be formalized more precisely |
| Driver/Goal/Objectives catalog | Goal catalog | The catalog and the diagram are two different ways of representing the same goals |
| Requirements catalog | Requirements diagram, requirements catalog | Initial requirements are initiated in phase A, and developed throughout the entire ADM cycle |
| Process/Event/Control/Product catalog | Business process catalog | |
| Event diagram | Event diagram | Event diagrams are used to produce business process catalogs and map processes |
The modeling techniques presented also use goals and formalize the different links possible between architecture models and goals. The goal diagram, which is an extension of TOGAF, provides added value by representing these links.
7.1.2 Essential concepts used in models
Phase A sketches models that will be reworked during the development phases. To this end, it implements a number of concepts clarified in phases B and C. Essential concepts are presented in detail in the paragraphs on model-focused phases.
Here we present “goals,” which are heavily reworked during phase A, and also requirements, since these are initiated at this stage and are closely linked to goals. TOGAF places requirement analysis at the heart of the ADM (see Figure 3.2). Thus, requirements concern all ADM phases.
•  Goal or objective of the enterprise: Determines the orientations of the enterprise.
•  Requirement: Required aptitude at enterprise or IS level.
• ![]() Internal actors, who participate in the functioning of the enterprise (for example, “Marketing manager”).
Internal actors, who participate in the functioning of the enterprise (for example, “Marketing manager”).
• ![]() External actors, who are external to the enterprise but who interact with it (here, “Clients” and “Partners”).
External actors, who are external to the enterprise but who interact with it (here, “Clients” and “Partners”).
• ![]() Business process (for example, “Reserve Trip”).
Business process (for example, “Reserve Trip”).
•  Business event, such as the cancellation of an order or the end of the marketing season.
•  Entity component: Autonomous component of the IS, which is configured and deployed. Entity components can be physical or logical components. We provide a service component typology for SOA architectures, indicated by the character associated with the icon (here, “E” for “Entity” component). This is explained fully in Chapter 9.
•  Application: Form of application component that designates an application in the traditional sense of the term. It is used widely to represent existing applications, for example, to carry out application mapping. It allows applications to be designated as having been bought off-the-shelf, such as ERPs or custom-developed applications.
Note: Like those presented earlier, these notations are provided by the EAP profile used in this book.
7.2 Stakeholder matrix
| Name | Stakeholder matrix |
| Experts | General management, organization unit directors, business managers |
| Designers | Business analysts |
| Recipients | All participants in enterprise architecture |
| Aim | To define the different actors participating in the construction of the enterprise architecture in order to facilitate the organization of the ADM cycle and to determine which artifacts are to be produced by whom |
| Useful preliminary information | Actors and human resources of the enterprise |
Section 1.2.5 described the importance of stakeholder management when setting up an ADM cycle. All those participating in enterprise architecture work must be identified, along with their influence on commitments and their main concerns that must be addressed through enterprise architecture work. The stakeholder matrix influences the ADM cycle and the organization of participants since it indicates who is involved in the work, who must be informed, and who has a significant influence on requirements, goals, and the priority given to them.
The role of participants and their tasks in the ADM cycle must be determined. Knowledge of the different participants’ concerns guides the choice of artifacts that it will be useful to produce and the way in which they will be produced. In particular, models will be selected so as to be easily understood by participants. For each of the artifacts described in this book, we find the list of participants concerned.
Table 7.2 provides an example of a stakeholder matrix. The level of interest designates the interest of the stakeholder in question for enterprise architecture. The name and the attributions of actors vary greatly from one enterprise to the next. It is certain that for the “Discount Travel” company, this list is too rich. Thus, a single person will probably carry out the tasks of several actors.
Table 7.2
Stakeholder Matrix
| Participant | Skill | Decision-Making Power | Level of Interest |
| CEO | Goal orientation, decisions | High | High |
| Organization unit director | Requirements orientation, decisions | Quite high | Medium |
| Business analyst | Business, analysis techniques | Low | High |
| Business architect | Business, architecture | Medium | High |
| Application architect | Application architecture | Medium | High |
| CIO | Project management, IS | Quite high | High |
| Business manager | Business | Quite high | High |
| Business expert | Business | Low | High |
| Data architect | Data architecture | Low | Quite high |
| Software designer | Software design | Low | Medium |
| Technical architect | Technology architecture | Low | Quite high |
| User | Use mode | Low | Low |
| Security expert | Software security | High | Medium |
| Operational manager | Deployment and functioning of applications, management of the application park | High | Medium |
| System and network engineer | Hardware, systems, network | Low | Medium |

7.3 Artifacts linked to goals
7.3.1 Goal analysis
Goals: A company’s reason for being
TOGAF defines an enterprise as being a collection of organizations with a common set of goals. This shows just how important goals are within an enterprise; they are its reason for being. An enterprise has a history, which is translated notably by its organization, the locations where it is present, and its information system. An enterprise operates in one or several business domains, where its skill lies. The transformations required to guide the enterprise architecture are defined by the enterprise’s goals. Goals provide direction, the place we want to get to. As far as possible, all enterprise architecture tasks will refer to goals to define what the desired results or outcome are and hence to decide what must be done. Goals will justify the work to be done, the reorganizations to be carried out, the orientation of the activity toward businesses to be put in place, and the evolution of the IS to support everything by rationalizing choices.
Goals in phase A
Goals are often known before phase A. By deciding on the start of an ADM cycle, the preliminary phase has already identified goals. Goals are reworked in phase A, for example, by using the techniques described below, before being finalized in phase B. The development of business architecture in phase B identifies architecture elements that are recognized as being necessary, which also enables goals forgotten during phase A to be identified later.
Goals and objectives
TOGAF distinguishes between goals and objectives. An objective breaks down a goal in order to set a time-specific milestone which corresponds to the progress made with regard to the goal. Objectives set the targets for goals in order to monitor whether or not they are met. Goals are the “what,” in other words, the desired results, while objectives are the “how,” that is to say, the courses of action that will lead to goals being achieved.
For example,
• “increase the use of our transport capabilities by 30% by the end of next year” is an objective
• “be one of the global top five in our activity sector in 5 years” is a goal.
The definition of goals is particularly based on the estimation of the enterprise’s capacity to progress, as well as on how well business drivers are taken into account. Business drivers or influencers are conditions outside the enterprise and linked to the sector of activity, such as competitive constraints (reduction in costs, competitor growth, etc.) or legal constraints (bank capital, travel agency insurance, etc.). Goals are always center-stage when an ADM cycle is triggered. Prior definition of goals therefore exists, often in an informal form.
One of the first enterprise architecture activities during phase A consists in formalizing, structuring, hierarchically organizing, and rationalizing goals with the help of the techniques presented earlier. Goals are completed and clarified by driver analysis and knowledge of the business and the IS.
Identifying goals
Identifying and selecting goals and giving them a priority level are not easy tasks. The definition of goals is a discipline in itself.
TOGAF reminds us that an objective must be SMART:
• Specific, by determining what must be done in the business
• Measurable, by implementing clear metrics for success
• Attainable, by:
• Clearly breaking down the problem
• Providing the basis for determining elements and plans for the solution
• Realistic, by indicating deadlines and conditions that can be met by the enterprise’s capabilities within stipulated time and cost limitations
• Timely, by explicitly indicating when interest in the solution will disappear
An essential point is that architectural choices must be aligned with the organization’s business goals. By constantly referring to goals, everyone is faced with his or her responsibilities, only asking the IS for the most fundamental things, defining priorities, allocating the necessary budget where the stakes are high, and identifying who is responsible for which goal.
Assigning goals and objectives
Assigning responsibility is a key step in the finalization of goal definition, as it implies negotiation on the feasibility of goals and agreement between stakeholders. By designating who will be responsible for reaching an objective, negotiation must take place with the people responsible, which therefore leads to communication on and validation of the objective in question. Goals and objectives are by no means just a list of pious wishes, but rather strategic choices that will guide the future activity of the enterprise. Responsibility for each objective must therefore be assigned to a person who will be in charge of attaining it.
Most of the time, goals are corporate-level goals, in other words, goals are frequently assigned to the entire enterprise, while objectives are allocated more specifically to people. Where they are assigned to organization units or business processes, the responsible element is always clearly identified (the process owner, the organization unit manager).
Goal graph
Goals are constructed hierarchically. Goals constitute the roots of the goal/objective tree. For every high-level goal, the question, How can we reach this goal? is used to identify lower-level goals, which are generally objectives. Conversely, identifying a low-level objective leads to the question, Which objective or goal will this help us reach? Finally, for every breakdown of a high-level goal, it is useful to think about alternative breakdowns: Do any obstacles exist that will hinder the realization of current goals? What other paths can be envisaged to reach higher-level goals?
This breakdown continues until a set of elementary objectives has been identified, whose allocation is clear and whose feasibility is confirmed.
We will see that the goal diagrams presented here go beyond a simple breakdown hierarchy. Analysis of the goal graph also looks at consistency and conflicts between goals: some goals contradict others (negative influence) or reinforce them (positive influence).
For example, the goal of improving customer service, which requires more staff, is in conflict with the goal of reducing costs. This is not an absolute contradiction, but it does require analysis to determine the exact quantification required and the right balance between the two goals.
Defining priorities for goals
Objectives must be measurable. This enables us to check that they really have been attained. Measuring facilitates the quantification of the advantages expected for the business once the objective has been met. These advantages have to be weighed against the effort required to obtain them. Thus, if the objective is “We want to give a full and immediate response to clients placing orders over the telephone,” then we must ask ourselves what advantage this objective brings to the organization. If it is a question of increasing client satisfaction, then it is necessary to measure the increase in satisfaction. For the enterprise, this can have the advantage of generating consistently higher turnover, a better image, increased revenue, and so on.
Goal/objective determination comes up against priority definition, which leads to the postponement of certain goals/objectives and the promotion of others. A common technique consists in evaluating the importance of goals/objectives, as well as their accessibility (how difficult it is for the enterprise to attain them).
Figure 7.1 thus provides a more rational basis for assigning priorities to goals. This exercise can also be useful during phase E when analyzing opportunities and solutions. While it is easy to decide to retain “7,” “6,” and “4” (they are accessible and extremely important) and to defer “3” and “5” (they are not easily accessible and have limited importance), it will be more difficult to decide about goal “1,” which is important but difficult to attain.

Summary of best practices for defining goals
Define the following:
• Subgoals/objectives, by asking how a goal can or should be implemented.
• Supergoals, by asking why a goal is necessary or needed.
• Alternatives, by asking what different ways of satisfying the supergoal exist.
• Conflicting goals, by asking what goals may conflict with each other.
• Allocation/assignment to individual parts of the business.
• Means of measuring their fulfillment.
7.3.2 The “Goal diagram” artifact
Description of the artifact
| Name | Goal diagram |
| Experts | General management, organization unit directors |
| Designers | Business analysts |
| Recipients | Architecture cycle stakeholders, general management and business architects, application architects, CIOs |
| Aim | To define the goals/objectives that will guide the changes that are to be made to the enterprise and its IS. To quantify objectives and allocate them. To provide a rational basis for the assignment of priority levels to goals/objectives |
| Useful preliminary information | Previously identified goals, enterprise drivers, “SWOT”a analyses, earlier marketing studies |
a SWOT: Strategic planning method based on evaluating strengths, weaknesses, opportunities, and threats with regard to one or several of the enterprise’s activities.
•  Hierarchical breakdown of goals
•  Indicates that the source goal will make it easier to attain the destination goal.
•  Indicates that the source goal will make it more difficult to attain the destination goal.
The goal diagram is an extension to TOGAF, which only provides the goal catalog. The goal diagram provides useful complementary information, notably through the different types of links represented.
Goal diagrams are used to summarize goals, represent them in the form of a hierarchy, and present the links that exist between goals and other model elements. Goals are situated at the top of the diagram, with the operational objectives that constitute them appearing lower down, via the “Part” link.
Goals are broken down hierarchically using the “part” link. Thus, in Figure 7.2, “Increase turnover and profits” is a strategic goal, which is broken down into operational objectives such as “Increase number of trips reserved per day,” which itself is broken down into “Increase sales presence,” “Optimize client transformation rate,” and “Render products more attractive.” Objectives orient the strategies used to achieve goals. They start to express what must be done. The “why” is expressed by the goals they break down. We can see that the “Reservation via the Internet” goal breaks down the “Increase sales presence” goal, since the capability of selling via the Internet is a new form of sales presence ensuring wide geographical coverage and availability. This goal has a positive influence on the “Optimize client transformation rate,” “Improve business process management,” and “Reduce file processing times” goals.
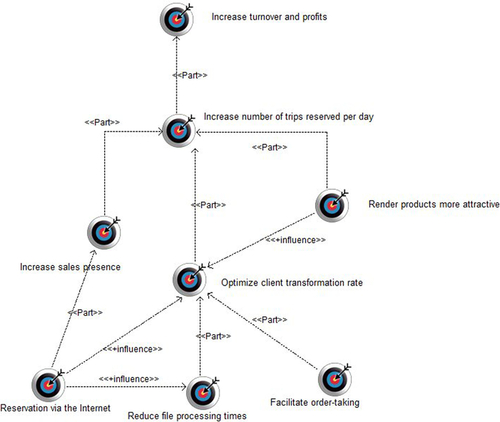
The existence of drivers imposes the creation of associated goals. This is the case for the “Reservation via the Internet” goal. In a competitive environment where most travel agencies provide access to their services on the Internet, the marketing management team can identify this capability as being a driver: providing this access modernizes the company image and contributes to increasing sales. This capability therefore has the status of a strategic goal, which conditions how the company is organized, notably for the marketing, sales, and accounts departments.
During phase A and then phase B (business architecture), goals are reworked in order to make sure that they meet SMART criteria as closely as possible. Thus, a goal such as “Improve business process management” can be called into question: it is nonspecific, difficult to measure and act upon, and has no time limit. No one within the enterprise will accept responsibility for this goal, and the monitoring of its realization will only be a vague, overall evaluation at the enterprise level. It is preferable to focus on more factual and operational goals, such as specific points on how to improve certain identified processes.
• ![]() Business process
Business process
• ![]() Internal actor
Internal actor
•  Assignment of a goal to an element (actor, organization unit, business process).
•  Indicates that when this requirement is satisfied, the goal will be attained.
Figure 7.3 provides complementary information. Links assigning goals are represented (≪ assigned ≫). In the example in Figure 7.3, the “Optimize client transformation rate” goal is assigned to the “Sales director” internal actor, while the “Render products more attractive” goal is assigned to the “Marketing director” internal actor.

7.3.3 The “Goal catalog” artifact
The goal catalog is the equivalent of the goal diagram. It presents the same elements, is realized by the same designers, and has the same experts and the same objective.
Goal analysis is essentially carried out using tables, which present values for the properties of each goal.
The properties assigned to a goal depend on enterprise practices. The preliminary phase must define which attributes will be used to evaluate goals.
Here is a typical example of goal properties:
• Description
• Kind (goal or objective)
• Global: Determines whether or not the goal concerns the entire enterprise or if it should be assigned more precisely. Goals are often global, whereas objectives are often not.
• Type: qualitative or quantitative. Quantitative goals (most often objectives) have a clear unit of measurement (for example, “turnover”). Qualitative goals (most often goals) require human evaluation of whether or not they have been attained.
• Required level of satisfaction: evaluated or firm. An evaluated goal is based on the fact that many goals are never totally met. For example, “improve employee well-being” is an “evaluated” goal. Because of this, evaluated goals are achieved when evaluation estimates that satisfaction factors are greater than failure factors. Firm goals can be judged in a more binary fashion: either the value has been reached or not.
• Unit of measurement: Determines the unit of measurement used to measure objectives.
• Target value: Value to attain in order to satisfy the objective.
• Current value: Value measured on the date on which the objective is defined.
• Problems: Obstacles that can get in the way of the goal being met.
• Source: Determines the origin of the definition of the goal.
Table 7.3 presents a simplified version of a goal catalog, with the scope and the values indicated for each goal.
Table 7.3
(Partial) Example of a Goal Catalog
| Name | Description | Scope | Type/Target Value |
| Internet access | Propose a reservation service on the Internet | Strategic | Qualitative |
| Improve quality image | Improve the image of the quality of both products and services (support, sales) | Strategic | Qualitative |
| Financial optimization | Manage the company’s accounts by optimizing the company’s cash flow and margins | Strategic | Quantitative: net margin = 8% |
| Improve payment management | Payment times must be reduced and payments secured; the implementation of remote payment mechanisms through credit cards must be systematized | Operational | Qualitative |
| Improve clientele follow-up | Better understand clients, their tastes and preferences, and their loyalty; inform them of the status of their order, and/or new offers and promotions | Operational | Qualitative |
| Increase number of trips reserved per day | The average volume of trips sold per day must be increased; this volume will be measured for a full year. This increase must take place based on average prices and margins, which are either constant or growing | Operational | Quantitative: number of purchase per day = 90 in the next 1.5 years |
| Optimize client transformation rate | When a prospect consults our offers, the rate of clients proceeding with a purchase must be increased | Operational | Quantitative: number of purchases/number of consultations = 0.4 |
| Reduce file processing times | Client order-taking processing times must be as short as possible | Operational | Quantitative: duration (min) = 30 |
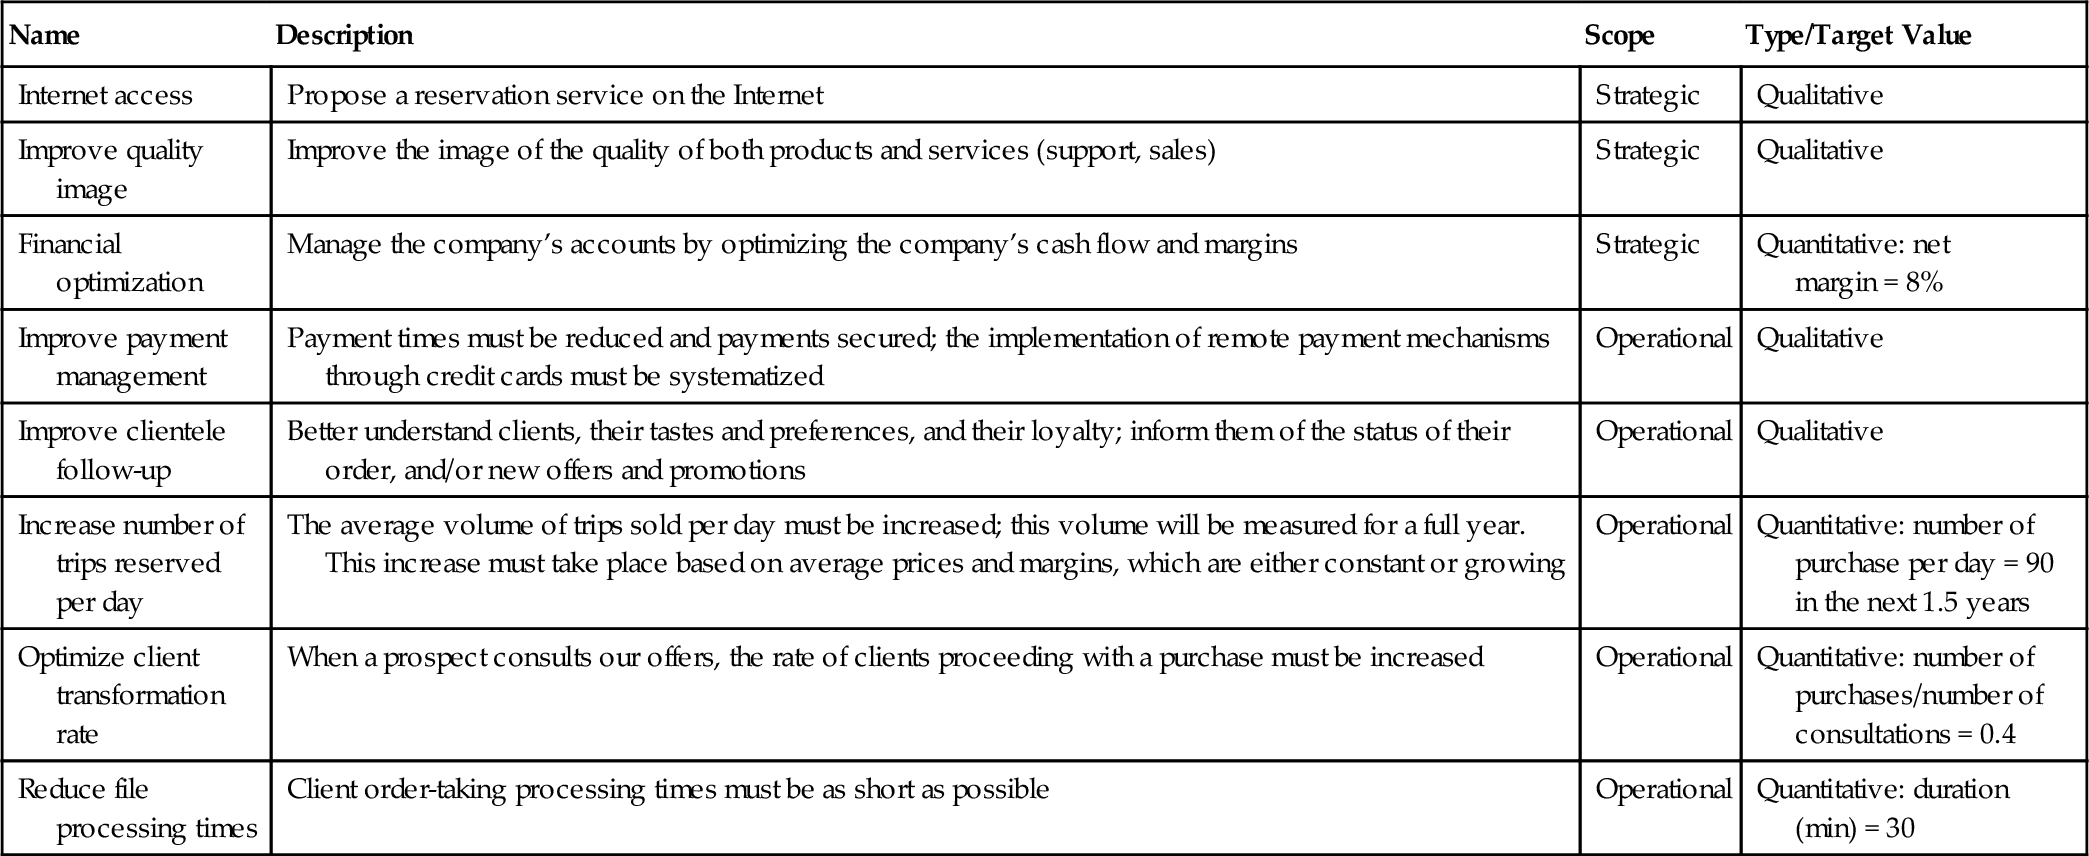
In Table 7.3, “drivers” are not shown. For the example of a travel agency, we can imagine that pressure from competitors is increasing, notably with regard to prices. We can also imagine that consulting and ordering trips online is becoming more and more widespread in the field. These constitute two “drivers,” which will guide the enterprise’s strategic goals.
7.4 Artifacts linked to requirements
Requirements management is at the center of the TOGAF ADM. In practical terms, this means that requirements management is constantly being carried out during each phase. This work begins in phase A and continues throughout the entire cycle.
7.4.1 The “Requirements catalog” artifact
Description of the artifact
| Name | Requirements analysis diagram; requirements catalog |
| Experts | Business experts, business managers, application architects |
| Designers | Business analysts, application architects (nonfunctional requirements) |
| Recipients | Business architects, application architects, software designers |
| Aim | To define the specifications for evolutions to the business architecture and the IS. To translate goals into detailed requirements on enterprise architecture components |
| Useful preliminary information | Goals of the enterprise, business architecture, application mapping |
Requirements analysis often takes place by constructing tables such as Tables 7.4 and 7.5. Requirements have a name, a description, and a set of associated properties (which vary according to the enterprise approach). The benefit/cost/risk ratio produced by this example is used to decide on the priority level to be assigned to each requirement: the decision (target version) is therefore indicated in one of the properties of each requirement. The use of tables to support requirements analysis limits the ability to link requirements to goals, work items, test cases, and other artifacts and model elements of the EA and its lifecycle. Requirements should also be managed in the model repository.
Table 7.4
Functional Requirements: Example of a Catalog
| Name | Description | Benefit | Cost | Risk | Target Version |
| Internet access | The information system must allow the client to consult available trips and to place his orders via a dedicated Internet site | Critical | 200 | Medium | 1 |
| Client autonomy | The client must be able to place his orders in an autonomous manner (without the involvement of salespeople) in at least 95% of cases | High | 10 | Low | 1 |
| Process automation | Order placement and monitoring processes must be able to run with no human intervention | High | 120 | Low | 1 |
| Purchase automation | This activity will be automated on the new website by direct connection to the “GIE” credit card server | Critical | 10 | Low | 1 |
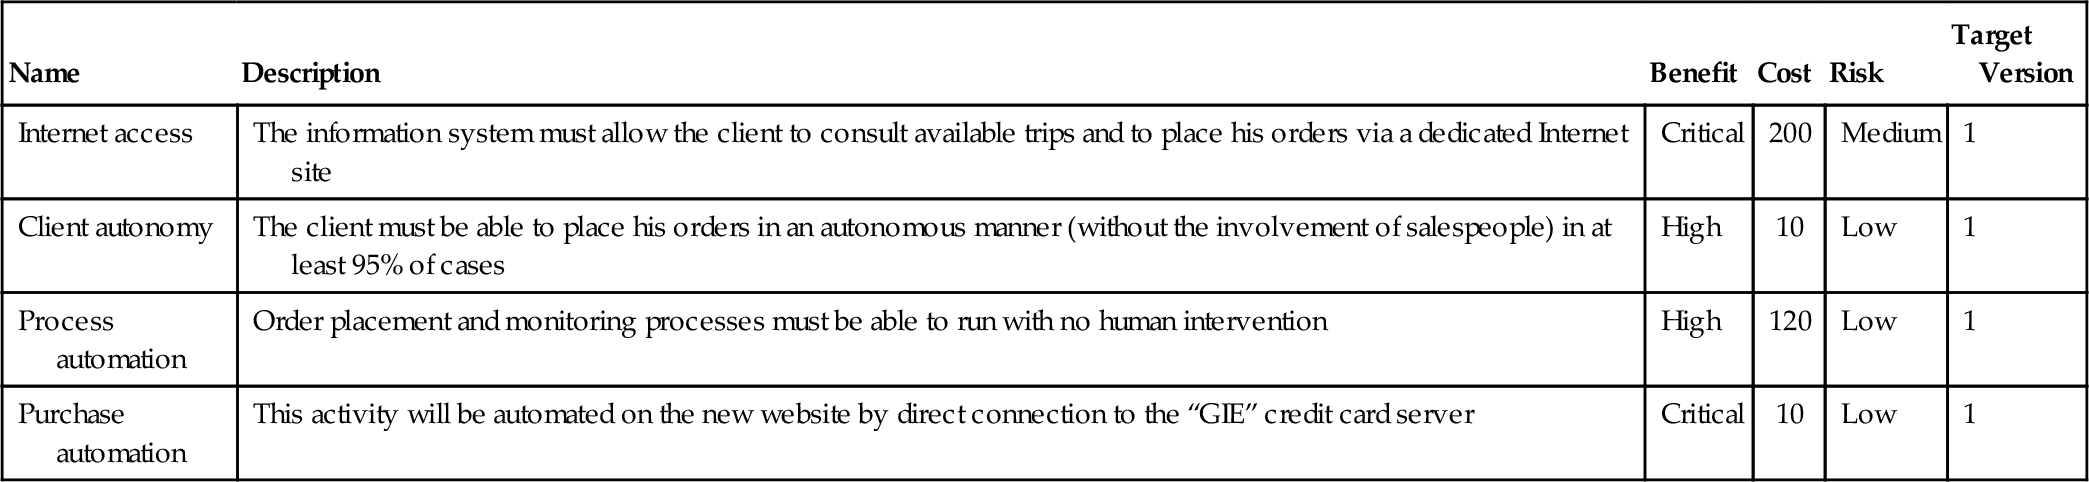
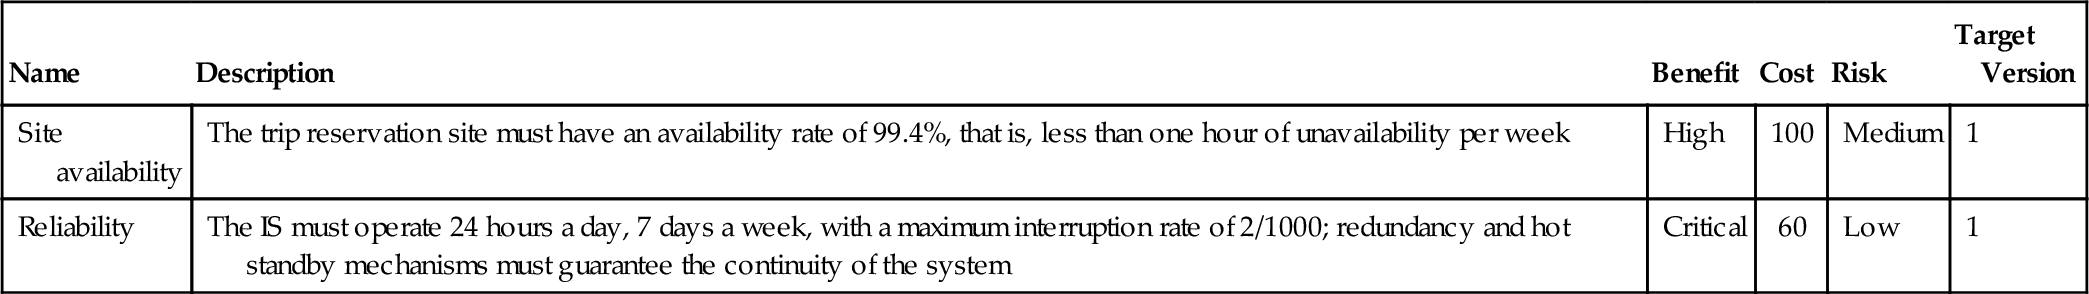
Table 7.5
Nonfunctional Requirements: Example of a Catalog
| Name | Description | Benefit | Cost | Risk | Target Version |
| Site availability | The trip reservation site must have an availability rate of 99.4%, that is, less than one hour of unavailability per week | High | 100 | Medium | 1 |
| Reliability | The IS must operate 24 hours a day, 7 days a week, with a maximum interruption rate of 2/1000; redundancy and hot standby mechanisms must guarantee the continuity of the system | Critical | 60 | Low | 1 |
Thus, a high risk on a requirement that is not particularly important will certainly lead to the assignment of lower priority to the requirement in question.
It is not easy to place a limit on the number of requirements formulated. The criteria and attributes presented above enable us to rationalize the process of defining priorities and choosing requirements to take into account. Finally, budgetary constraints will intervene to limit them.
Characteristics of a requirement
The definition of requirements in the ADM cycle was presented in Section 2.2.6. A requirement specifies a capability or a condition that must (or should) be provided by a system. A requirement can concern the enterprise in general, one of its processes, one of its functions or organization units (for example, “the sales department must manage order cancellations”), or the information system more specifically (for example, the nonfunctional requirements in Table 7.5). Requirements must be satisfied by the business architecture (meaning that business processes, business services, actors, and organization units must be defined or adapted to handle order cancellations), or by application and technology architectures (for example, we will see that the application architecture includes a “CreditCard” component to implement the “purchase automation” requirement). Requirements concerning the IS will then be sent to projects and will constitute their specifications.
Functional requirements present a complete description of the way in which the system will operate. They should enable actors (users or technical actors) to have a realistic image of the system and to see all aspects of its functioning, before its construction.
Using Table 7.5, nonfunctional requirements will primarily interest technical architects, who will use them to deduce the needs of the infrastructure. Security experts, operations managers, and system and network engineers are also concerned.
Properties that must be verified by a requirement
The “business book of knowledge” (BABoK)a defines the properties that must be respected by the requirements in Table 7.6.
Table 7.6
Useful Properties for Requirements (BaBoK)
| Criteria | Description |
| Assignable | This requirement can be assigned to a component of the system, where it can be implemented |
| Attainable | The requirement is technically feasible, in the context of budgetary and time constraints |
| Complete | All known requirements are documented and all the conditions under which the requirement applies are identical. Requirements must contain the information necessary to design a solution and to check that a solution satisfies them |
| Consistent | A requirement must be able to be satisfied without coming into conflict with another requirement |
| Correct | A requirement must precisely describe the expected function or condition. Only the initiator of the requirement (client, user, stakeholder) can judge this |
| Not solution-oriented | The requirement must be expressed in such a way as to leave the widest possible range of implementation options |
| Measurable and testable | Requirements must be designed to check whether or not the solution satisfies them |
| Necessary | A necessary requirement is a requirement that is essential to the satisfaction of business goals. Requirements must be traced to goals to check their necessity |
| Ranked | A priority is assigned to each functional requirement in order to indicate whether or not it is essential for a particular version of the system. These priority levels are used to make choices with regard to budgetary constraints |
| Traced | The source of the requirement must be known: a person, a business rule, a use case, and so on. Requirements must have a unique identifier |
| Not ambiguous | All readers must interpret the requirement in the same way. It is preferable to use simple, concise terms when writing requirements. The use of terms featuring in a previously defined business glossary helps ensure that requirements are not ambiguous |
| Understandable | Solution designers must be able to easily understand requirements |
In practice, requirement analysis is an extremely difficult task. The following are some of the issues involved:
• Customers often don’t know the requirements.
• Analysts and designers need to have a thorough understanding of the essence of the requirements, and what it means to match them.
• Requirements are not stable between the time they were analyzed and the time the solution is delivered.
Good requirements management has to address these realities. This is why TOGAF puts them in the center of the ADM circle, and why requirements analysis is a continuous activity throughout the ADM.
Goals and requirements
Goals constitute one of the starting points for the development of requirements, and help make requirements clearer for stakeholders. Goals focus on the “why” (strategic questions) and the “what” (the results we want to achieve), whereas objectives clarify the “how” (operational questions), before using requirements to broach the question of the detailed functional and nonfunctional characteristics of the solutions that realize the strategies used to achieve the goals. Requirements introduce the “what” at the solution level (which developments to carry out, which system to put in place, etc.).
The breakdown of goals often helps identify initial requirements. Respecting these requirements will then help guarantee (using the “guarantee” link) that goals are reached (see Figure 7.4). Thus, when the “Trip reservation process automation” requirement on the IS is satisfied, this will facilitate the guarantee that the “Reduce file processing times” goal be reached.

It is not always easy to distinguish between goals and requirements. In the example mentioned in this section, we can see that the goal has a general scope, whereas the requirement appears as a solution to the goal.
Operational objectives are assigned (using the “assigned” link) to an actor, an organization unit, a business process, a business function, or a business service. They are never assigned to an IS component; this level of detail corresponds to requirements that can be satisfied (using the “satisfy” link) by an IS component.
Requirements are written like behavioral specifications rather than goals to be reached (the system will carry out…, access will be limited to…).
7.4.2 The “Requirement diagram” artifact
Description of the artifact
The requirement diagram presented here is based on the SysMLb standard.
• Goal
•  Interaction component
•  Use case
• Breaks a requirement down into more elementary requirements.
•  Describes the manner in which a model element or a set of model elements can be used to refine a requirement.
•  Determines that a model element is used to satisfy a requirement by supporting the requested function or by responding to the formulated constraint. Very often an application component satisfies a requirement.
•  Defines the manner in which a test case (which can be a use case) verifies a requirement. For example, a use case can express test sequences, which check whether or not a requirement is satisfied.
Requirements can be presented in graphical form. Here, requirement modeling enables requirements to be positioned and several types of links to be defined between requirements and the rest of the model. Requirements often appear in architecture models, to remind us which requirements refer to which represented model elements. Matrices can be used instead of diagrams.
These links between requirements and the architecture model are used to measure:
• Whether or not each requirement is satisfied by at least a part of the system
• Whether or not at least one test case is planned for each requirement
• Which model elements satisfy no requirements
Thus, requirements are justified through their links to goals, and the model itself is justified through its links to requirements. Moreover, requirements enable us to closely monitor how well the model respects the specifications.
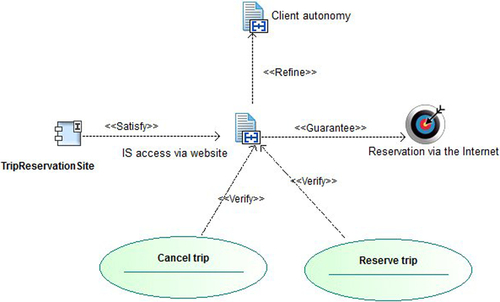
In Figure 7.5, the “IS access via website” requirement guarantees the “Reservation via the Internet” goal. It is satisfied by the “TripReservationSite” component, and will be verified by the “Reserve trip” and “Cancel trip” use cases.
7.5 Artifacts linked to business processes
7.5.1 Modeling business processes in phase A
Phase A is mainly concerned with the high-level identification of business processes (see Sections 2.2.2 and 12.2), in order to help establish the vision. Business process modeling is carried out by business analysts, who use their knowledge of the organization of the enterprise (roles and actors) and the business functions of the enterprise.
The TOGAF event diagram particularly describes the links between events and business processes. It is used to obtain a “macro” vision of business processes by mapping them, while detailed information on business processes is defined by process flow diagrams (see phase B artifacts).
7.5.2 The “Event diagram” artifact
Description of the artifact
| Name | Event diagram |
| Experts | Business analysts, organization unit managers |
| Designers | Business process analysts |
| Recipients | Business analysts, application architects, organization managers |
| Aim | To identify processes, characterize them, and provide general mapping. To decide on priority optimization lines |
| Useful preliminary information | Definition of actors, functions |
Event diagrams present business events, but also and above all provide a macroscopic view of processes. They cover what is traditionally referred to as a “process map,” and can be implemented with several levels of detail. Three different views are presented here. The most macroscopic level is used to carry out general mapping of business processes (Figure 7.6); an intermediate level presents events, participants, and data linked to a group of processes (Figure 7.7); the most detailed level focuses on one given process and provides details on the process’ external environment.

• ![]() Business process
Business process
Figure 7.6 presents organization domains (for example, “Marketing”) which structure processes (for example, “Define portfolio”). It provides a macroscopic view of processes that is useful when mapping them; in other words, when producing an inventory of processes that can then be organized.
The enterprise’s key business processes
Phase A and then business architecture must identify the key business processes linked to the enterprise transformation targeted by the ADM cycle. These key business processes must therefore be listed, classified, and their respective positions specified, while providing information on the context. These business processes will constitute determining reference elements for application architecture, which will have to provide services to support some of them. Their definition will be used for business governance, which will make sure that they run correctly, that results are efficiently produced, and that enterprise functioning rules are respected.
The event diagram provides an overview of processes and their connections to other processes and to other business architecture elements. The most general event diagram view, presented in Figure 7.6, is used to establish the business process map by classifying them (in business domains as shown in Figure 7.6) and by providing information on their context. This map will be completed by process files similar to those presented in Section 12.2.2.
Based on this business process map, business managers and analysts can define priorities with regard to processes that must be overhauled or optimized. They identify critical zones, think about processes impacted by new enterprise goals, and may begin more detailed studies of certain processes, which involve additional business process modeling and analysis work.
Business events and processes
Business events represent any event that can arise during the functioning of the enterprise and which necessitates management work on the part of the enterprise. A “request for information” from a client or a “cancellation” are examples of business events. Events can be of different types, for example:
• External events, initiated by an entity outside the enterprise (for example, “order from a client”).
• Temporal events, initiated by a time-linked condition (for example, “month end” or “fiscal year end”).
• Internal events, initiated within the enterprise (for example, “current stock level lower than stock renewal level”).
Most events require action to be taken within the enterprise, and this action will be described in business processes. When a business event occurs, this can also trigger a process that will produce a business result or response.
The “Event diagram” artifact (intermediate view)
•  Product
• ![]() Business process
Business process
• ![]() Internal actor
Internal actor
• ![]() External actor
External actor
•  Link indicating a flow of data (input or output) on an active element (here, processes).
•  The origin actor is the initiator of the process.
•  The origin actor or organization unit participates in the running of the process.
•  The origin actor is the owner of the process.
Event diagrams provide an overview of processes, trigger events or sent events, participating actors, roles or organization units, and products received or sent. At this intermediate macroscopic level, there is no sequence between processes, even if we can see that products sent by a process can be reused by another process. This intermediate level of detail cannot be presented for all company processes in a single diagram. For reasons of size, several diagrams of this type must be created and then classified, for example, by process domain (identified in the map).
The event diagram, shown in Figure 7.7, presents support processes (see Section 12.2.4) linked to marketing and financial services and production processes linked to trip reservation. It associates trigger events or sent events to these processes, as well as input or output products.
It associates actors to these processes, actors who initiate or participate in processes, events that trigger or that are generated by processes and input or output products on processes.
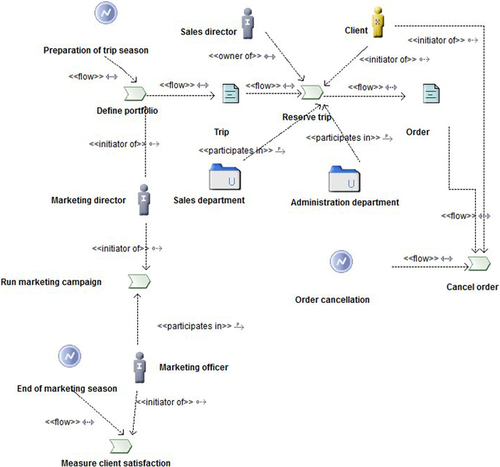
The “Event diagram” artifact (view focused on a process)
• Goal
• ![]() External actor
External actor
• ![]() Internal actor
Internal actor
• Business event
•  Organization unit
• ![]() Business process
Business process
•  Function
• Link expressing incoming and outgoing information between an event and a process, or between a product and a process. This kind of link exists between the “Order” product and the “Reserve trip” process, or between the “Order cancellation” event and the “Cancel order” process.
• A “participates in” link from a role or organization unit to a process. Thus, the sales department and the administration department participate in the realization of the “Reserve trip” process.
• An “initiator of” link from a role or organization unit to a process. Thus, the client is the initiator of the “Reserve trip” process.
• An “owner of” link between an actor and a process. Every process must have an owner whose role is to guarantee the correct functioning of processes by supervising them and by applying corrective measures when they are run. Here, the sales director is the owner of the “Reserve trip” process.
Event diagrams can focus on a particular process in order to determine its context in greater detail. For a given process (here, “Reserve trip”), the actors and organization units that initiate or participate in the process will be expressed, as well as the owner of the process, the trigger events or events sent by the process, and the incoming/outgoing information flows. Goals assigned to the process also appear in this diagram. They are used to identify priority processes that must be modeled, as well as to orient modeling and planned improvements in performance, automation, better synchronization with information systems, and so on. Key performance indicators (KPIs) can be partially deduced from goals assigned to processes.
For reference purposes, TOGAF indicates the characteristic operational objectives that can be assigned to a process:
• Increase process production rate (for example, “Optimize trip reservation times”)
• Ensure consistent process production quality (for example, “Reduce reservation failure or error rates”)
• Obtain a foreseeable process execution cost
• Increase existing process reuse
• Reduce interprocess information provision times
Figure 7.8 focuses on a process and is a graphical view of the process file (see below).

Business process catalog
TOGAF defines the process/event/control/product catalog. This kind of catalog will be produced as a result of process mapping. Macroscopic diagrams (Figure 7.6) and intermediate diagrams (Figure 7.7) can be referenced in this catalog. In Table 7.7, we show the information resulting from identification. Qualification generally happens during phase B and provides other defined properties (frequency, complexity, etc.), as shown in Table 7.8.
Table 7.7
Business Process Catalog
| Process | Description |
| Reserve trip | Proceed with the reservation request for the client’s trip, including payment aspects and availability checking |
| Define portfolio | Constitute the trip catalog for the following season |
| Cancel order | Manage the cancellation of a client’s order |
Table 7.8
Detailed File on a Business Process
| Process | Reserve Trip |
| Finality | Proceed with the reservation request for the client’s trip, including payment aspects and availability checking |
| Trigger events | Reservation request |
| Input | Trip catalog (Trip) |
| Output | Order |
| Key performance indicators (KPIs) | File processing time < 10 minutes; abort rates during order < 30%; “Discount Travel” employee intervention < 5% |
| Governance | Sales director |
| Resources used | Website, IS, partners ISs |
| Main actors | Client, sales department, administration department |
| Work underway | Opportunity study |
7.6 The “Solution concept diagram” artifact
7.6.1 Definition of the artifact
| Name | Solution concept diagram |
| Experts | Business and application architects |
| Designers | Business architects, functional architects |
| Recipients | General management, analysts, architects, CIOs |
| Aim | To share a preliminary vision with all stakeholders by providing general information on the changes that are going to be implemented |
| Useful preliminary information | Goals, organization, existing application and business architectures |
Figure 7.9 presents an overview of the target architecture: a website destined for clients and sales representatives will be built. Work will concentrate on the trip reservation process, which will be implemented by a set of new application components linked to the accounting management application (ERP).
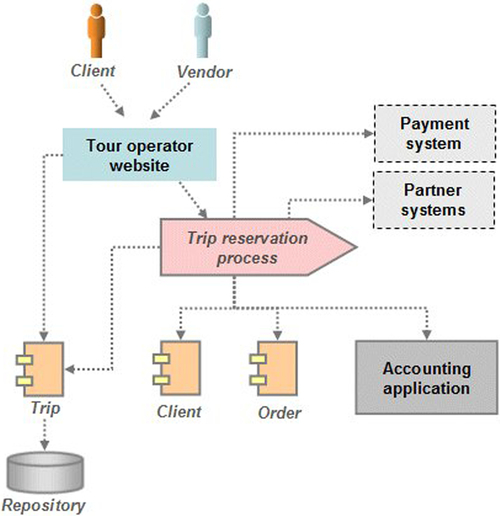
Once consensus has been obtained, this type of model can then be reentered more formally in the modeling tool and used to begin systematic modeling work in the different architecture domains concerned. Figure 7.10 presents the same model slightly more developed in the modeling tool.

The central elements represented in Figure 7.10 are application components with their interdependency (access) links. The links between the information system and functions, business services, or business processes are indicated (“realizes” implementation links).
The “TripReservationSite” component provides clients and sales representatives with Internet access. The “ReserveTrip” process component implements the “Reserve trip” business process. It uses the “Order,” “Client,” and “Trip” entity components. It interacts with the accounting ERP application by transmitting invoices to send out.
• Goal
• ![]() External actor
External actor
• ![]() Internal actor
Internal actor
•  “Database” component
• Entity component
•  Utility component
•  System federation component
•  Process component
• Interaction component
• Application
• ![]() Business process
Business process
•  Realization by a component: The “ReserveTrip” process component realizes the “ReserveTrip” process.
• Assignment of a goal to an element (actor, organization unit, business process). The goal of improving the rate of prospect-to-client transformations is thus assigned to the “ReserveTrip” process.
•  Consumption or use link. Determines that an actor consumes an element of the information system, such as a process.
• Link expressing that an element of the information system satisfies a requirement. The “ReserveTrip” component satisfies the “Trip reservation process automation” requirement.
We must refer to goals to remind ourselves why we have decided to make the IS evolve and why we have to introduce or further develop such and such an application component. In Figure 7.11, the “ReserveTrip” business process is linked to the assigned goals. The “ReserveTrip” component satisfies the “Accounting ERP connection,” “Trip reservation process automation,” and “Purchase automation” requirements.

Assignment is generally about accountability of organization units or their members. Assigning a goal to a process means that the process owner will be accountable for the goal, or in practice to the KPI inferred from the goal or objective.
7.6.2 Providing the envisaged solution with an orientation
A solution concept diagram provides a high-level orientation of the solution that is envisaged to achieve the goals of the enterprise architecture. Unlike the more formal and detailed architecture diagrams developed in later phases, solution concepts represent a sketch of the expected solution without going into any detail.
In a broader EA context, a solution concept diagram would include different opportunities and solutions, investment strategies, change initiatives, and their impact on a broad range of architecture building blocks. Solution concept diagrams can contain key goals, requirements, and constraints for the engagement, and can also highlight main work areas that will have to be investigated in more detail using more formal architecture modeling. The goal of this diagram is to share an early vision with all stakeholders by giving them an idea of the changes that are to be put in place. Each participant then understands the envisaged architectural engagements, and the way in which these will produce a solution that will achieve the enterprise’s goals.
We recommend that only essential application components be presented and that their interconnections be summarized using dependencies (without considering service assembly). New components to be introduced must be linked to existing applications where necessary. They must be linked to requirements, processes, or functions, which themselves are linked to goals. It is also useful to use “consumes” links to show which actors use which components.
The model has the benefit of being understood by everyone, but this does not mean it is frozen in terms of its elements. It will have to undergo several iterations and improvements during subsequent phases in order to take into account all business constraints and the more elaborate application architecture. It is generally not elaborated using “formal” modeling tools, and will be built using simple graphical tools such as PowerPoint.
7.7 The “Value chain diagram” artifact
7.7.1 Definition of the artifact
| Name | Value chain diagram |
| Experts | General management, business organization unit managers |
| Designers | Business analysts |
| Recipients | Business analysts, architects, general management, business managers |
| Aim | To identify the source of values brought to the client, values that must be preserved or improved. To identify the capabilities necessary to achieving new business opportunities |
| Useful preliminary information | Knowledge of the organization and the business; business functions and capabilities |
Value chain diagram representation is often informal, as in Figure 7.12. Different enterprise functions involved in the chain are grouped together with support functions (Marketing and Advertising) distinguished from the main activities involved in value production (for example, “Sales”). The margin is provided as a result of the chain.

• ![]() Sequence between functions
Sequence between functions
With a modeling tool, this can also be represented using functions defined in the enterprise architecture. In the example in Figure 7.13, sequence links express the usual order of sequencing (this order is informal and not inflexible) in order to illustrate the chain between valued functions. “Value factor” and “Changes needed” notes indicate value factors and required changes.

7.7.2 Contribution of business functions to value
Value chain diagramsc provide a high-level orientation view of an enterprise and how it interacts with the outside world. They do not provide an exhaustive or formal view of the enterprise, but rather concentrate on the impact of certain orientations and on the relative importance of certain decisions. The aim is to quickly align decision-maker views on priorities and the relative importance of components. All participants must quickly understand the organizational and functional context of an architectural engagement.
Value chain diagrams are used to identify the source of values provided to the client, values that must be preserved or improved. They make it easier to measure the impact of investments on the value provided, and summarize factors such as production times, cost, and quality. Value chain diagrams allow alternative configurations to be compared and vulnerabilities and nonessential activities to be identified. They also enable the capabilities necessary to achieving new business opportunities to be identified. Finally, they constitute an entry point that can be used to center business process improvement work.
7.8 Fundamental concepts
The following fundamental concepts were introduced in this chapter:
• Goal: Determines the orientations of the enterprise.
• Objective: Breaks down a goal in order to set a time-specific milestone that corresponds to the progress made with regard to the goal.
• Requirement: Required aptitude at the enterprise or IS level.
• Application component: Encapsulation of application functionality aligned to implementation structure.