
Chapter 12. Visio Graphics Service Development
IN THIS CHAPTER
• Developing a Data-Driven Visio Web Drawing
• Publish a Drawing to a SharePoint 2010 Document Library
• Browsing a Visio Web Drawing Online
• Refreshing Data in a Visio Web Drawing
• Embedding a Drawing into a SharePoint Page Using the Visio Web Access Web Part
• Interaction with other SharePoint 2010 Applications
To gain a full view of information that matters to your business requires both a high-level perspective and detailed data. Visio 2010 in integration with SharePoint 2010 lets you share your Visio drawings with your users in an effective manner. Users can see your real-time data through web drawings in their browsers without having Visio installed on their local machines. They can pan and zoom in the online diagram, follow hyperlinks embedded in shapes, and refresh the data manually or on a set schedule. They can interact with other SharePoint web parts to create visually compelling and interactive dashboards. Visio Graphics Service allows publishing diagrams directly from Visio Professional or Premium edition to a SharePoint document library.
Prerequisites
Developing Visio Graphics Service content is all done from Microsoft Visio 2010, which is installed as a separate component of Microsoft Office 2010. Data-driven Visio web drawings can be developed using either Microsoft Visio 2010 Professional or Premium. You can download a trial version of Visio 2010 Premium edition from http://technet.microsoft.com/en-us/evalcenter/ee390821.
You can learn more about Microsoft Visio 2010 version differences at http://office.microsoft.com/en-us/visio/visio-edition-comparison-FX101838162.aspx.
This chapter requires that you have a basic understanding of how Visio drawings are created. We do not cover all available features of Visio 2010 Premium edition in this chapter. Our focus is mainly on how to create a data-driven Visio web drawing using data from Excel Services, SharePoint Foundation List, and SQL Server database.
In this chapter, we first develop a data-driven Visio web drawing using Visio 2010 Premium edition. We use multiple external data sources to pull data into the same drawing. The ContosoRetailDW database is used for all development work. After the Visio web drawing is created, we publish it online in our SharePoint 2010 document library. We review features available for browsing the drawing online. You also learn how to refresh the data embedded in the drawing manually and via automated schedule. Toward the end of this chapter, you learn how to make your drawing interactive by integrating it with other SharePoint 2010 web parts.
You can download the ContosoRetailDW database from http://www.microsoft.com/downloads/en/details.aspx?FamilyID=868662DC-187A-4A85-B611-B7DF7DC909FC&displaylang=en.
Developing a Data-Driven Visio Web Drawing
To develop a data-driven Visio web drawing connected to an Excel workbook, first we need to confirm that workbook is hosted on a same SharePoint farm where we are planning to deploy our Visio web drawing. Also verify that Excel and Visio Graphics Services are running on the SharePoint farm. Once confirmed then set up a connection to that workbook using following steps:
- Open Microsoft Visio 2010 Premium edition from the All Programs menu. A window similar to Figure 12.1 will pop up on your screen.
Figure 12.1. Blank Visio drawing.

- Create an empty drawing by selecting the Blank Drawing template from the File menu.
- After a blank drawing has been created, click the Data tab on the top ribbon and then click Link Data to Shapes.
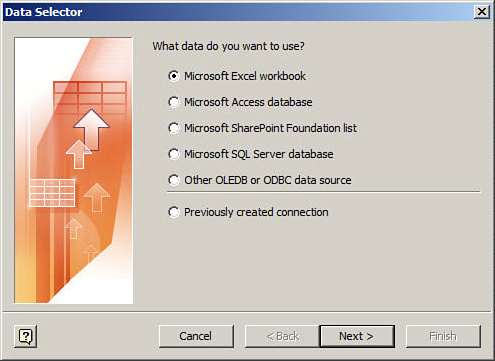
- The Data Selector window will open as shown in Figure 12.2. Select the Microsoft Excel Workbook radio button, and then click Next.
Figure 12.2. Data provider selection.
For this section, we prepare an Excel data sheet manually and upload it to our SharePoint document library first. We use this Excel sheet as an external data source. I have executed the following SQL query against the ContosoRetailDW database to extract sales data by channel. You can either manually prepare this Excel sheet or use this book’s resource material to access the ContosoSalesData Excel sheet.
SELECT b.CalendarYear
, a.ChannelKey
, MAX(c.ChannelLabel) AS ChannelLabel
, MAX(c.ChannelName) AS ChannelName
, SUM(a.salesamount) AS SalesAmount
, SUM(a.TotalCost) AS TotalCost
FROM FactSales a
INNER JOIN DimDate b ON a.Datekey = b.Datekey
INNER JOIN DimChannel c ON a.ChannelKey = c.ChannelKey
GROUP BY b.CalendarYear, a.ChannelKey
ORDER BY b.CalendarYear, a.ChannelKey - You are now ask to provide the location of your Excel workbook as shown in Figure 12.3. Type the path where your Excel workbook is stored on SharePoint and then click Next.
Figure 12.3. Excel workbook location.

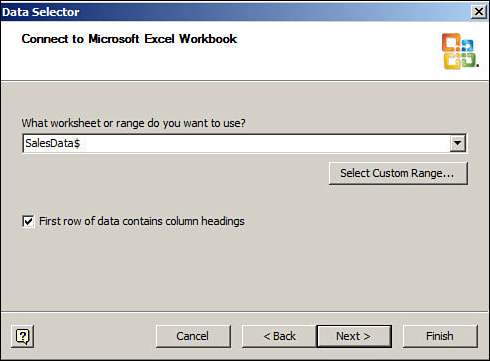
- Select the worksheet to use from the drop-down menu as shown in Figure 12.4 and then click Next.
Figure 12.4. Excel worksheet selection.
- Select the unique key identifier in your dataset as shown in figure 12.5 and then click Next. Click Finish in the next window.
Figure 12.5. Unique identifier selection.

You should now see the data from Excel sheet at the bottom of your drawing as shown in Figure 12.6
Figure 12.6. Linked data from Excel workbook.

We will now put some shapes and text boxes on our drawing, which we want to link with this external dataset. You can choose shapes of your own choice or retrieve the Visio drawing file (ContosoSalesByChannel.vdw) from this book’s resource material. ContosoSalesByChannel.vdw file looks similar to Figure 12.7.
Figure 12.7. Visio web drawing.

- When the drawing is ready with shapes and text boxes, you can then link those shapes and text boxes to actual data rows available at the bottom of the drawing. To link shapes to the data, just drag data rows from the bottom of the drawing to the actual shape or text box on your drawing. You can link one row to one shape or a text box.
- After links have been established between shapes and text boxes and the data rows, you will notice a link icon appear beside the data row. You can now right-click the actual shape or text box and choose to edit the data graphic from the menu. Figure 12.8 shows how to edit the data graphics for textbox with caption “ONLINE”. This textbox is linked to sales data from online channel.
Figure 12.8. Edit data graphics.

- You can double-click each data item and update its data graphic settings. You can display data as text, data bar, icon set; or you can present your data with different colors based on your defined business rules. In the Details section, you can also choose to format data differently. Figure 12.9 displays the Edit Item window which pops up when you double click on any data item.

- We now have the Visio drawing, which has shapes and text boxes linked to Excel Services data. Our next step is to create another data source connection to the SQL Server database. The process to connect to a SQL data source is very similar to what we just did to connect to Excel Services data. Click the Data tab and then click the Link Data to Shapes button.
- Select the Microsoft SQL Server database in the Data Selector window and then click Next.
- Type the server name and provide the correct security credentials in the Data Connection Wizard window (Figure 12.10) and then click Next. You can use either SQL or Windows authentication. For user-level security, it is recommended to use Windows authentication.
Figure 12.10. Data Connection Wizard.

- Select the ContosoRetailDW database from the Database drop-down menu. Click Next after the V_Profit view has been selected as shown in Figure 12.11.
Figure 12.11. View Selection window.

A view (V_Profit) has been created under the ContosoRetailDW database using the following SQL statement. This view calculates profit by calendar year. We will use this view as an additional data source for our Visio drawing. Create the view in your ContosoRetailDW database using following SQL statement:
Create View V_Profit
AS
SELECT TOP (100) PERCENT
b.CalendarYear
, SUM(a.SalesAmount) - SUM(a.TotalCost) AS Profit
FROM dbo.FactSales AS a
INNER JOIN dbo.DimDate AS b ON a.DateKey = b.Datekey
GROUP BY b.CalendarYear
ORDER BY b.CalendarYear - Name the ODC file V_Profit and click Finish. To ensure that the connection file is always used when the data is updated, click the Always attempt to use this file to refresh this data check box (Figure 12.12). This check box ensures that updates to the connection file will always be used by all workbooks that use that connection file. Save this file in the same SharePoint document library where you will publish your Visio drawing.
Figure 12.12. Save the data connection file.

- Click Next in the Data Selector window, and in the next window make sure the path is the same as your SharePoint path for the ODC file. Next you have an option to pick columns and rows for your dataset as shown in Figure 12.13. We will choose all columns and all rows and click Next again.
Figure 12.13. Data Connection Wizard.

- Select Calendar Year as a unique identifier and click Next. Click Finish in the next window.
You will notice another dataset at the bottom of your drawing (Figure 12.14). This dataset is using SQL Server as its external data source.
Figure 12.14. Linked data from SQL server database.

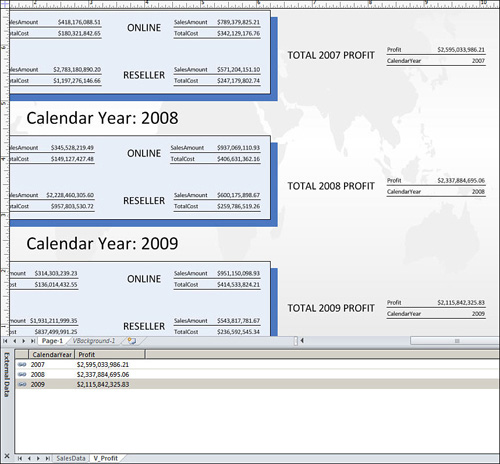
- Create a Total Profit text box for each year as shown in Figure 12.15, and then link the data rows from our SQL Server dataset to these text boxes.
Figure 12.15. Linking data to the text box.
- We will display this new data set as an icon set. To do that, right-click the text box connected to the V_Profit dataset, and select Edit Data Graphic from the Data menu. Double-click the Profit data item and then choose Icon Set from the Displayed As drop-down menu.
- Select the Traffic Lights option under the Style menu and define rules for different light options as shown in Figure 12.16. Click OK.
Figure 12.16. Traffic Light style option.

- You will now see a colored traffic light appear in the upper-right corner of each text box (Figure 12.17). Adjust the formatting as you prefer. You can also add a legend to the same drawing by clicking Insert Legend on the top Data menu. At this point, you have successfully connected your drawing to the SQL Server database.
Figure 12.17. Visio web drawing connected to SQL server database.

We will now create a new connection to a SharePoint list to use it as an external data source on the same Visio drawing. We will use the same process as before:
- Click the Link Data to Shapes tab. Then choose Microsoft SharePoint Foundation List from the Data Selector window and click Next again.
A SharePoint Foundation List was manually created that displays the top three employee names as list items (Figure 12.18). These three employees have done the most business in the past three years. We will use the same list as an additional data source for our drawing. You can create one yourself before moving forward with this exercise. The list should have three columns: RecordKey, EmployeeName, and Total Profit.
Figure 12.18. SharePoint list.

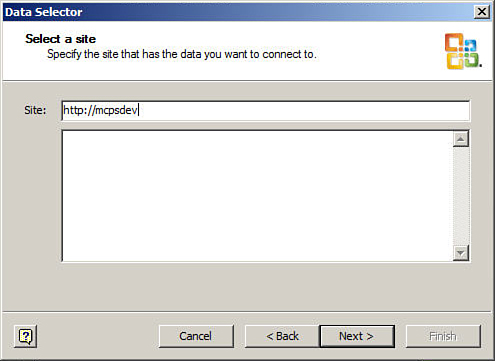
- Provide the site address of your SharePoint site as shown in Figure 12.19 to the Data Selector window, and then click Next. Make sure both the Visio drawing and the SharePoint list are on the same SharePoint 2010 site.
Figure 12.19. SharePoint 2010 site hosting custom list.
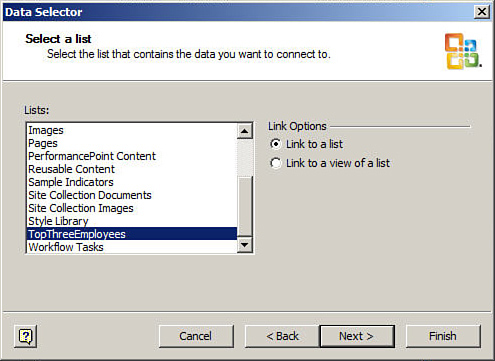
- When you click Next, you are asked to choose a list from all available lists on that SharePoint site. The list you will select is used as an external data source for our Visio web drawing. We will choose the TopThreeEmployees list (Figure 12.20) and then click Next. Click Finish in the next window.
Figure 12.20. Custom list selection.
You will now see a new dataset at the bottom of your drawing, TopThreeEmployees (Figure 12.21).
Figure 12.21. SharePoint Foundation List external data source.

- You can again use the shapes and text boxes of your own choice to further develop this Visio drawing. After shapes and text boxes have been placed on a drawing, you can link them with the data rows of our new SharePoint Foundation List dataset. This time we will use data bars to display TopThreeEmployees Total Profit. Right-click the shape or text box you are using for this new data source and then choose Edit Data Graphic from the Data menu.
- Double-click Total Profit and choose Data Bar from the Displayed As menu and select Progress Bar from the Style menu (Figure 12.22). Define the max value of a bar as 600000000 and click OK.
Figure 12.22. Progress bar style option.

You will now have TopThreeEmployees list data displayed as a progress bar on your Visio drawing (Figure 12.23).
Figure 12.23. Visio web drawing connected to SharePoint list.

We now have our Visio drawing ready, which is using SQL Server, Excel Services, and SharePoint Foundation List as an external data source. The next section explains how you can save this web drawing to a SharePoint document library.
Under the Data tab on the top menu there is a button named Automatic Link. After you click it, it will start the Automatic Link Wizard. The Automatic Link enables you to quickly link rows of data to shapes in your diagram if existing values in the shape equal values in the row.
Publish a Drawing to a SharePoint 2010 Document Library
The Visio web drawing (VDW file) is a new Visio file type that allows diagrams to be rendered in the browser using Visio Services on SharePoint 2010. To save your Visio drawing as a web drawing file in a SharePoint 2010 document library, follow these steps:
- Click File, Save, Send. You will see an option to Save to SharePoint in the right pane as shown in the Figure 12.24.
Figure 12.24. Save to SharePoint.

- Click Save to SharePoint, Browse for a Location. Under file types, select Web Drawing, and then click Save As. You can provide the path for the exact location on your SharePoint server where you want to save this file and then click Save. You can also manually upload this file to your SharePoint directory.
After your Visio web drawing file has been saved to the SharePoint document library, you can continue to work on it in Visio. You can edit Visio web drawing files using the complete set of features provided by Visio and then save again. When the file appears in your document library, you can open it in a browser by clicking it.
Browsing a Visio Web Drawing Online
A Visio diagram saved to a SharePoint document library as a Visio web drawing can be viewed in any web browser by just clicking its filename in the document library.
The diagram renders in the browser if the viewer has Silverlight installed on his or her machine. Visio Services renders seamlessly anything you can draw in Visio (see Figure 12.25).
Figure 12.25. Visio web drawing in a browser.

Visio Services enables you to navigate diagrams using easy-to-use control features for panning, zooming, switching pages, following hyperlinks, and discovering shape data. You can also open a drawing in Visio directly from the browser with one click using the Open in Visio button.
Because Visio web drawings are stored in a SharePoint document library, users get a variety of useful document management features, such as access control using permission management and change control using version management. Drawings can also be integrated with SharePoint workflows.
By default, Visio web drawings open in their own web page for a full-screen viewing experience. Visio Graphics Service allows Visio web drawings to be embedded in other SharePoint pages using Visio Web Access web parts. Using the Visio Web Access web part, you can embed Visio web drawings in SharePoint pages. By putting all relevant information onto one page, you save viewers time and enable them to understand the information fully. You will learn more about Visio Web Access web parts in later sections.
The next section covers options available for refreshing data in Visio web drawings.
Refreshing Data in a Visio Web Drawing
Visio Graphics Service has taken Visio’s data refresh features to the browser. When Visio Graphics Service renders a data-driven drawing in a browser, it fetches the linked external data from the data source. After you publish your drawing to the SharePoint document library, your diagram will always visually represent the most up-to-date data. You can also refresh data manually by clicking the Refresh button. Visio Graphics Service supports refresh on open, manual refresh and automatic periodic refresh.
The next section explains how the ContosoSalesByChannel.vdw drawing can be presented using the Visio Web Access web part.
Embedding a Drawing into a SharePoint Page Using the Visio Web Access Web Part
There are multiple ways to share your Visio web drawings with viewers online. One of the options is to upload the drawing file (.vdw file) to the document library. Users can then open it in a browser by clicking on the actual file name. Another option is to embed your web drawing directly into a SharePoint page using the Visio Web Access web part. This is helpful when you are developing a dashboard page. Contribute, Approve, Manage Hierarchy, Design, or Full Control level permissions let you embed your Visio web drawings into an existing SharePoint page. This section will provide you step-by-step guidelines on how to embed drawings in a SharePoint page using Visio Web Access web part. To do so, follow these steps:
- Create a New Visio Web Access web part page by clicking New Page under Site Actions.
- Click the Insert tab and then click the Web Part button.
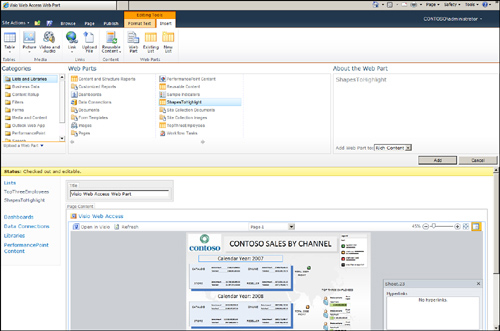
- Select the Business Data category as shown in Figure 12.26, select the Visio Web Access web part, and then click the Add button.
Figure 12.26. Visio Web Access web part.

- At this point, an empty Visio Web Access web part should appear on your page. To assign an existing web drawing to display in this web part, follow the Click Here to Open the Tool Pane link (Figure 12.27).

- Type in the URL to the web drawing you want to display in the text box, or use the Browse button to navigate the SharePoint folders to find the drawing. Figure 12.28 shows the window you see when you use the browse button to search for your web drawing file.
Figure 12.28. Select an asset: Web Page Dialog.

- After the URL is in the Input field, click either the Apply or OK button at the bottom of the configuration panel. You will notice the drawing is embedded in the page after you click Save and Close (Figure 12.29). You can click Page on the top ribbon bar and then click Make Homepage to use this Visio web part page your home page.
Figure 12.29. Visio Web Access web part home page.

You can only embed web drawings that are hosted within the same SharePoint farm as the site hosting the web part. Also note that Visio Services checks the permissions of page viewers before it renders a web drawing. If the viewer does not have at least View permissions, Visio Services will not render the web drawing.
Table 12.1 lists other settings options to further customize your Visio Web Access web part page.
Table 12.1. Further Customizing Your Visio Web Access Web Part Page


Interaction with Other SharePoint 2010 Applications
In this section, we review how the Visio Web Access web part can interact with other SharePoint 2010 web parts. We use our previously created web drawing to set up an interaction with other web parts. You have to make sure the ContosoSalesByChannel.vdw drawing is published in a SharePoint 2010 document library. Also verify whether you have the Visio Web Access web part working on your home page. After confirming such, you can set up an interaction as follows:
- Create a new custom list in SharePoint and add a new column called Shapes to Highlight. Choose Single Line of Text as the column data type.
- Create a new item in your list for each group of shapes you want to highlight. In the Shapes to Highlight field, enter a comma-delimited list of the names of the shapes you want to highlight as shown in Figure 12.30, with no spaces (for example, Sheet.23,Sheet.69).

- On the web part page, add the List View web part for the list that you created at the bottom of the page. The name of the list should show up as a web part once you select List and Libraries from the categories as shown in Figure 12.31.
- In the corner of the Visio Web Access web part, click the arrow to open the Visio Web Access web part menu.
- Click Edit Web Part. In Edit mode, click the arrow to open the Visio Web Access web part menu again, point to Connections, choose Get Shapes to Highlight From, and then choose the List web part (ShapesToHighlight) you added to the page as shown in Figure 12.32
Figure 12.32. Visio Web Access web part menu.

- The Configure Connection dialog pops up asking you to map a field from the Provider web part to a field in the Consumer web part. Visio Web Access is the consumer web part because it is receiving a list of shape names from the List View web part. Choose Shape Names for the Consumer field and Shapes to Highlight for the Provider field as shown in Figure 12.33.
Figure 12.33. Configure Connection window.

- Click Finish. Now your two web parts are connected, and when you select a row in your List web part, Visio highlights the shapes that are specified in that row.
Just as with Get Shapes to Highlight From, you can use a few more connection actions. Table 12.2 describes each possible connection action.
Table 12.2. Possible Connection Actions

Custom Data Providers
When you want to use an external data source that is not compatible with Visio Graphics Service, you can create a custom data provider using steps shared at http://msdn.microsoft.com/en-us/library/ff394595.aspx.
This MSDN article shares the most important classes and methods available in the Visio Services class library to create and deploy a custom data provider. The custom data provider in this article reads data from an XML file and then displays the same data in a Visio web drawing file.
Summary
Microsoft Visio 2010 integration with SharePoint 2010 has opened a whole new way to display Visio diagrams more effectively. Visio developers can now create interactive, dynamic, data-driven Visio web drawings using Microsoft Visio 2010 Premium and Professional editions. They can publish their drawings online in a SharePoint document library for others to view without having Visio installed on their local machines.
This chapter walked through the process of developing each piece of Visio Graphics Service content. It explained you how you can access data from different external data sources. In addition, the chapter explained how to set up an interaction between the Visio Web Access web part and other SharePoint web parts. In later chapters, a complete end-to-end solution shows how Visio Graphics Service fits into the overall BI stack and how the components from this chapter are used to build the complete solution.
Best Practices
The following are best practices from this chapter:
• It is important to understand how much space you need to store your web drawings and how many users will be simultaneously accessing your web drawings. You can access an article about capacity planning for Visio Graphics Service at http://www.microsoft.com/downloads/en/details.aspx?FamilyID=fd1eac86-ad47-4865-9378-80040d08ac55&displaylang=en.
• For large diagrams, use the Get Shape to View From connection setting to configure the zoom settings.
• Most data providers are already listed with Visio Graphics Service, but if not, make sure all your external data sources are listed as a trusted data provider.
• Make sure ODC files, SharePoint lists, and Excel sheets are stored on the same SharePoint site as your drawing, if used as an external data source.