
Chapter 10. PowerPivot for SharePoint
IN THIS CHAPTER
• Overview of PowerPivot for SharePoint
• Installing PowerPivot for SharePoint
• Using PowerPivot for SharePoint
• Monitoring PowerPivot for SharePoint
The preceding chapter discussed how PowerPivot for Excel is a powerful tool for end users to create analytic applications. However, without some management of these applications, they are unlikely to become reliable enterprise tools that benefit the organization. This kind of application management is one of the primary benefits of SharePoint, and this chapter explores PowerPivot for SharePoint.
Overview of PowerPivot for SharePoint
IT departments have their hands full maintaining mission-critical enterprise applications and developing new enterprise applications to meet the needs of the business. As a result, business users often end up developing their own departmental applications for data analysis. Although these applications often prove quite useful, they do not receive the management benefit that IT can provide, such as keeping the applications accessible, current, and organized.
This situation represents a significant risk to an organization. Often, the business user who created the application moves on to a different department or leaves the company, and then these departmental tools either die or IT has to scramble to become familiar with an application that they had no part in developing.
The ideal scenario is to have a tool that enables business users to create a variety of analytic applications themselves and then those applications can be placed in an environment where IT can manage the distribution and data requirements. This will also enable IT to monitor the usage of these applications to plan future resources and development. This scenario illustrates the benefit of PowerPivot for SharePoint.
Installing PowerPivot for SharePoint
The process of installing PowerPivot for SharePoint is obviously impacted by the kind of SharePoint environment that is intended to host the service. The simplest installation is a single-server SharePoint installation, but this is really only practical for evaluation environments or very small production environments. A typical PowerPivot for SharePoint installation is to a multiserver SharePoint farm. However, because of the tight integration of PowerPivot with several SharePoint services, this installation path involves several complex steps.
As a result, the smoothest approach to installing PowerPivot for SharePoint is to make this part of an initial farm install. Of course, that is not a requirement, and Microsoft has developed excellent installation guides for installing PowerPivot for SharePoint on existing farms, but installation to an existing multiserver SharePoint farm is the most complex installation path. For this reason, this section does not attempt to address all the different configurations in detail, but instead addresses single server installation and multiserver installation from a high level, intending to provide sufficient information to guide the installation process.
Hardware and Software Requirements
Server sizing and capacity planning depend on numerous factors, but the biggest variable for PowerPivot servers is memory. Because PowerPivot for SharePoint is a SQL 2008 R2/SharePoint 2010 feature, the minimum system requirements are essentially the same as for those two applications. In addition, because PowerPivot uses an in-memory data analysis engine, the application server that will host PowerPivot for SharePoint should have enough additional memory to accommodate the expected concurrent file use. For example, to support 20 different PowerPivot applications, each 1GB in size, an additional 20GB of memory is needed on the server (even if more than 20 users will be accessing these applications).
Microsoft’s recommended standard configuration for a PowerPivot server includes the following:
• 64-bit Quad-core processor running at a minimum of 3GHz
• 32GB to 64GB of RAM
• 80GB to 100GB of storage (because PowerPivot caches data files on disk)
• Windows Server 2008 SP2 or Windows Server 2008 R2 (64-bit)
• SharePoint 2010 with Excel Services and Secure Store Service
• SQL Server 2008 R2 Enterprise
New Single-Server Install
The following steps are for a single server installation of SharePoint and PowerPivot:
- Prepare domain accounts for the SharePoint Service accounts and the SQL Service accounts.
- Launch the SharePoint 2010 Prerequisite Installer to ensure all prerequisites are installed, and then reboot.
- Launch SharePoint 2010 setup in Administrator mode and choose the Complete installation.
- Do not configure the server yet! When prompted to configure the server, click Cancel. The PowerPivot for SharePoint installation configures the new SharePoint 2010 farm.
- Launch the SQL Server 2008 R2 setup in Administrator mode and select the New Installation or Add Features to an Existing Installation option.
- After the setup files are installed, select New Installation or Add Shared Features for installation type, as shown in Figure 10.1.
- After entering the product key and accepting the licensing terms, you are prompted to select a setup role. Select SQL Server PowerPivot for SharePoint, New Server, as shown in Figure 10.2.
Figure 10.2. Setup role: New Server.

- Proceed through the next few screens. The installer tests the installation rules, prompts for SharePoint farm configuration, and creates a new instance of the SQL Server Engine and the Analysis Services Engine. When prompted for the service accounts, enter the service accounts created earlier.
- Be sure to add the current user on both the Database Engine Configuration screen and the Analysis Services Configuration screen so that the administrator is set up for those services.
- Click through the remaining confirmation screens and initiate the install process. This process could take up to 30 minutes.
- After successful installation, click Close.

You should now be able to verify the successful installation by browsing to http://<machinename> (with machine name being the name of the server). The Welcome page of the SharePoint 2010 site should load, and you should see an entry for the PowerPivot Gallery on the left-side navigation, as shown in Figure 10.3.
Figure 10.3. SharePoint home page with PowerPivot Gallery.

You have now completed a successful single-server installation of PowerPivot for SharePoint.
Multiserver Farm Install
In the steps for performing a single-server install, SharePoint was first installed but not configured, and the PowerPivot Installation Wizard handled the configuration of SharePoint. When installing PowerPivot in a multiserver farm, the SharePoint farm needs to be set up and configured first, and then the PowerPivot application servers can be added. Note that PowerPivot needs to be installed using a Farm Administrator account, otherwise SQL Server setup will not pass the pre-requisites tests. The following steps assume that this is a new farm install. Detailed instructions on SharePoint installation are beyond the scope of this chapter, but a summary of the steps involved is provided for guidance. If the farm already exists, you may skip ahead to the section on preparing the application servers.
Getting the installation environment set up correctly can sometimes be a challenge. It is a good idea to first perform a single-server installation to a virtual machine (VM) to become acquainted with the installation process and to get all the services configured properly. Using a VM will also enable you to undo any changes more easily if you desire to configure things differently.
- If not already done, prepare domain accounts for the SharePoint Service accounts and the SQL Service accounts following standard best practices for SharePoint farm design.
- Prepare the database server.
• Install SQL Server 2008 R2 on the database server.
- Prepare the web front-end servers (WFEs) and create the farm.
• Install SharePoint on the first WFE using the Complete Installation option. At the end of the installation process, check the box to Run the SharePoint Products and Technologies Configuration Wizard. This will enable you to create the new farm. Step-by-step instructions for this process are beyond the scope of this chapter, but be sure to enable the following services:
• Excel Services
• Secure Store Service
• Usage and Health data collection (see the “Monitoring PowerPivot” section later in this chapter for more information)
• Install SharePoint on any additional WFEs and run the Configuration Wizard to join to the farm and specify the database server and passphrase that were established earlier.
- Prepare the application servers.
• Install SharePoint on the application servers, run the Configuration Wizard and join to the farm, and specify the database server and passphrase that were established earlier.
- At this point, the SharePoint farm is installed and configured. The next step is to install PowerPivot on the application server.
• On the application server, launch the SQL Server 2008 R2 setup from the installation media. Select Installation, New Installation or add features to an existing installation.
• Proceed through the next few screens, and on the Setup Role screen, select SQL Server PowerPivot for SharePoint, and choose Existing Farm from the drop-down list, as shown in Figure 10.4.
Figure 10.4. Setup role: Existing Farm.

• Proceed through the next few screens, and on the Server Configuration screen, specify the Analysis Services service account. Also be sure to add the current user to the Analysis Services Engine screen so that the SharePoint Farm Admin has access to Analysis Services.
• Proceed through the remaining screens to complete the installation. After it’s complete, launch SharePoint Central Administration and navigate to System Settings, Manage Servers in this Farm, and you can confirm that the SQL Server PowerPivot System Service is running on the application server.
- Deploy and configure PowerPivot on the SharePoint farm.
• From Central Administration, navigate to System Settings, Manage Farm Solutions.
Figure 10.5. Manage farm solutions.

From here, you should see two solutions: powerpivotfarm.wsp and powerpivotwebapp.wsp. The powerpivotwebapp.wsp is probably already deployed to Central Administration (notice the port number), but still needs to be deployed to the default web application. Click the Deploy Solution link and specify when you want the deployment to occur. Be sure to select the default web application from the Deploy To drop-down.
• Next, a PowerPivot service application is required for the WFEs to communicate with the PowerPivot services via the PowerPivot System Service proxy. From Central Administration, navigate to Application Management, Manage Service Applications.
Figure 10.6. Manage service applications.

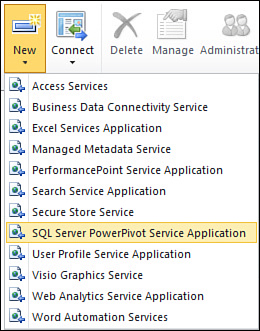
- Select New from the menu bar and choose SQL Server PowerPivot Service Application.
Figure 10.7. New PowerPivot service application.
A configuration screen will appear allowing specification of application pool and proxy settings. Generally, it is considered more secure to have application services running under separate application pool IDs. However, the PowerPivot service application and the PowerPivot System Service require Farm account rights to access the Secure Store Service database. For this reason, it is recommended to change the following two settings:
• Application Pool: Select Use Existing Application Pool and select SharePoint Web Services System.
• Check the box at the bottom of the page to add the proxy to the Default Proxy group.
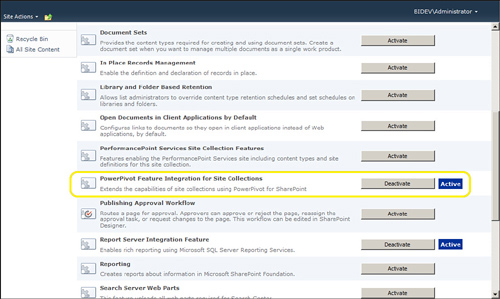
- Lastly, the PowerPivot feature needs to be activated. Launch the default website from a WFE and select Site Actions, Site Settings. Under Site Collection Administration, select Site Collection Features. Scroll down to the PowerPivot Feature Integration for Site Collections entry and click the Activate button, as shown in Figure 10.8.
Figure 10.8. PowerPivot feature activation.
- Stop Excel Calculation Services on the WFE.
Because the SharePoint instance on the WFE was installed as a Complete installation, Excel Calculation Services (ECS) are installed and running. However, if the instance of ECS on the WFE tries to connect to PowerPivot, it will fail because the Analysis Services OLE DB driver is not installed on the WFE. Because this farm is architected for PowerPivot work to be handled by the application server, ECS should only be running on the application server and should therefore be stopped on the WFEs:
• From Central Administration, navigate to System Settings, Manage Services on Server.
• From the drop-down, make sure that the server selected is the WFE.
• Scroll down to Excel Calculation Services and click Stop.
- Creating the PowerPivot Gallery.
For setup on an existing SharePoint farm, navigate to More Options in the Site Actions menu, find PowerPivot Gallery in the Libraries column, and create a new library.
PowerPivot is now installed, configured, and active on the SharePoint Farm.
Using PowerPivot for SharePoint
PowerPivot applications are created using Excel 2010 with the PowerPivot add-in, as covered in the preceding chapter. After a PowerPivot application is created, it should be uploaded to the SharePoint PowerPivot Gallery to be shared across the organization.
PowerPivot Gallery
When documents are loaded into a typical SharePoint library, they are presented in a simple list. This works fine, but wouldn’t it be great if the documents were able to be previewed in a library visually, like how photos are presented with thumbnail previews? Well, that is precisely what the PowerPivot Gallery provides for PowerPivot applications. Although this might seem like simple eye-candy, this has significant benefits for usability and user adoption. It’s much easier for users to remember an application visually than simply by the filename. Also, the ability to visually review the applications in the gallery makes them more engaging, which can lead to increased user adoption.
The PowerPivot Gallery offers three different presentations: Gallery view, Carousel view, and Theater view. These are selectable from the Library ribbon, as shown in Figure 10.9.
Figure 10.9. PowerPivot Gallery view selection.
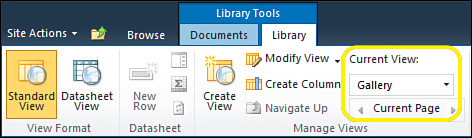
• Gallery view: The Gallery view is the most basic of the views and lists a preview of the file along with a smaller thumbnail view of each sheet in the file. As you hover over each thumbnail, the primary view changes to show that sheet. Clicking the primary view or the thumbnail launches the PowerPivot viewer and loads the file full screen for interactivity.
Figure 10.10. PowerPivot Gallery view.

• Carousel view: The Carousel view replaces the vertical scrolling with a rotating presentation, with only a single PowerPivot file sheet shown at any one time. Clicking the center sheet launches the sheet in the PowerPivot viewer.
Figure 10.11. PowerPivot Carousel view.

• Theater view: The Theater view is similar to how you would view photos, with the selected sheet nearly full screen in size and a series of thumbnails across the bottom of the screen with the ability to scroll right to left. Clicking the center sheet launches the sheet in the PowerPivot viewer.
Figure 10.12. PowerPivot Theater view.

Data Refresh and Snapshots
If the PowerPivot Gallery just provided static thumbnail views, that would be useful, but the gallery is actually more intelligent than that and can refresh the data in the PowerPivot workbooks to keep them current.
When viewing the workbooks in the gallery, you will notice two faint icons in the upper-right corner for each workbook. The icon on the right, which looks like a calendar, is the Manage Data Refresh function. Clicking this icon launches a page where a data refresh schedule can be created. Currently, the highest frequency that can be set for data refresh is daily. This can be useful for applications where the data is loaded nightly, because the PowerPivot applications could then be set to refresh each morning.
When a PowerPivot workbook gets refreshed, PowerPivot needs to take a new “snapshot” of each sheet for visual presentation in the gallery. The PowerPivotGallery component initiates this snapshot process automatically, but if a user attempts to look at the gallery before the snapshot has been updated, PowerPivot places an hourglass icon on the outdated views as a visual indicator that these views are not yet current. (see Figure 10.13). Keep in mind that this hourglass is simply an indicator that the visual snapshot has not been updated. If the user were to open the workbook, the data in the workbook would be current.
Figure 10.13. Out-of-date snapshot images.

Publishing Workbooks
Publishing PowerPivot workbooks to SharePoint can be done by either the Upload function from within the SharePoint PowerPivot Gallery, the Save As option from within Excel, or the Save and Send option for publishing from within Excel. Although all of these methods produce the same result (that is, getting the file into SharePoint), the mechanisms and options used are different.
• The Upload option is initiated from within the SharePoint PowerPivot Gallery. The Upload function is a synchronous transfer and is the fastest option but also results in more bandwidth usage than the Excel save options.
Figure 10.14. Upload initiated from SharePoint.

• The Save As option is initiated from within Excel by selecting Save As and browsing to the PowerPivot Gallery in SharePoint as the destination. This option uses an asynchronous transfer, which enables the bandwidth demand to be more balanced, but takes more time than the Upload option.
• The Save and Send option is similar to the Save As option but enables the user to specify publishing options, including selecting which sheets of the workbook to expose in the browser and setting parameter values that may be used in the worksheet.
Figure 10.15. Publish initiated from Excel.

Although there is no way to force a particular PowerPivot publishing method, each organization should consider whether there is a preferred method and recommend this to their users.
Controlling Data Exposure and Spreadmarts
Although the uploading of PowerPivot workbooks is beneficial to an organization, allowing these workbooks to be downloaded can be very detrimental. Because these PowerPivot applications contain significant data and may also contain business rules, allowing them to be downloaded can be risky. In addition, downloading these applications usually results in multiple copies of various versions of the application, which is a very unmanageable scenario. This scenario has been thought of as a datamart of spreadsheets, or a spreadmart. This can be controlled by preventing users from downloading these applications.
To prevent users from downloading the workbooks into Excel, Excel Services provides a SharePoint group named “Viewers.” Users placed into the “Viewers” group can still fully interact with the workbook, including changing the slicer values, but they are prevented from downloading the Excel file.
Monitoring PowerPivot
One of the biggest advantages of a tool like PowerPivot is the ability to give end users the freedom to build the analytic applications that they find useful for managing the business. However, one of the biggest concerns for SharePoint administrators is being able to manage the effect that these applications will have on the rest of the SharePoint environment and to plan for future resources.
To meet this need, PowerPivot for SharePoint includes some very useful tools for monitoring which files are being used and how they are performing. The SharePoint Usage and Health Data Collection service is used to collect this information, and the PowerPivot Management Dashboard is used to monitor this information.
Enabling Usage and Health Data Collection
The Usage and Health Data Collection service is new to SharePoint 2010. This service collects and logs SharePoint health indicators and usage metrics for analysis and reporting purposes. During the multiserver farm install process, there was a statement about making sure the Usage and Health Data Collection service was enabled. To do this, follow these steps:
- Go to Central Administration and navigate to Monitoring, Configure Usage and Health Data Collection.
- Confirm that the Enable Usage Data Collection box is checked, and then check the boxes for PowerPivot data collection, namely the following:
• PowerPivot Connections
• PowerPivot Load Data Usage
• PowerPivot Unload Data Usage
• PowerPivot Query Usage
- Confirm that the Enable Health Data Collection box is checked.
Using the PowerPivot Management Dashboard
To launch the dashboard, go to Central Administration and navigate to General Application Settings, PowerPivot Management Dashboard.
Figure 10.16. PowerPivot management dashboard.

The dashboard is divided into the following sections:
• Infrastructure - Server Health: Provides graphical trend charts for the following statistics:
Query Response Times
Average Instance CPU
Average Instance Memory
Activity
Performance
• Actions: Links to PowerPivot-related settings within SharePoint.
• Workbook Activity: This is a chart of the number of queries by the number of users over time, but it is more than just a static chart. It enables you to “play” the chart and watch how the usage occurs over the time span presented. This is useful for tracking peak activity and determining when additional resources might be necessary.
• Data Refresh: The automatic data refresh capability of PowerPivot is one of its most useful features. As such, it’s extremely important to know whether those refreshes succeed or fail, and if they fail, why. The Data Refresh section contains a list of recent activity, which can be drilled down to see all history for a particular data file. The Data Refresh section also contains a list of recent failures for troubleshooting.
• Reports: The Server Health and Workbook Activity sections are actually displays from a PowerPivot application, which is connected to an Analysis Services cube named ITOps Sandbox. The Excel files that provide that information are listed in the Reports section as Server Health.xlsx and Workbook Activity.xlsx. Custom reports can also be created against this cube.
Summary
While PowerPivot enables end users to create powerful analytic applications, the PowerPivot features of SharePoint enable IT to keep the applications accessible, current, and organized.
In this chapter, we explored how PowerPivot for SharePoint is installed, how the PowerPivot Gallery can be used to access and refresh these applications, and how the PowerPivot Management Dashboard can be used to keep things running smoothly.
Best Practices
The following are best practices while working with PowerPivot for SharePoint:
• Don’t skimp on memory: Because PowerPivot for SharePoint loads the workbooks into the server’s memory, the application server hosting PowerPivot services should have plenty of memory. The recommended amount of memory for an enterprise PowerPivot server is 32GB to 64GB. This will vary from organization to organization, but the determining factor is the number and size of concurrent workbooks that will be used.
• Review and set file size limits: Because PowerPivot applications include the actual data, the files can be larger than what is commonly stored in SharePoint. By default, SharePoint limits the size of uploaded files to 50MB and Excel Services limits the size of a workbook to 10MB. These limits should be reviewed and adjusted as necessary to meet the requirements for the environment.
• In a multiserver SharePoint farm, turn off Excel Calculation Services on the WFEs: If the instance of ECS on the WFE tries to connect to the PowerPivot application service, it will fail because the Analysis Services OLE DB driver is not installed on the WFE.
• Turn off the Excel Web Access warning: Because PowerPivot applications require Excel Services to query external data, users will frequently be prompted with the SharePoint Excel Web Access external data warning. In the Excel Services Application settings, the Warn on Refresh check box should be cleared.