Chapter 8
Azure Service Health
Overview
Azure provides a set of tools to help you monitor the health of the Azure Cloud services you are consuming. In addition to Azure Monitor, which you can use to monitor workload levels, there are tools to monitor the resources on the service layer and to alert you of service issues that could be affecting the health of your environment. These tools also relay information and alerts about ongoing maintenance activities—planned and unplanned—that could cause service-availability issues for your cloud resources. This chapter covers three of these tools:
Azure StatusThis tool provides information about Azure service outages across all Azure regions. Because this tool provides information about outages across all regions, rather than just the regions hosting your resources, it is best to use it when there is a wider outage possibly affecting inter-region services.
Service HealthThis tool provides a more succinct view of the health status of Azure services, focusing only on the regions and services you are using in your subscription. It monitors the services you have deployed in your subscription to provide a more personalized dashboard and alerts you to any outages, planned maintenance activities, or advisories pertaining to those services and regions alone.
Resource HealthThis tool goes one step further: It monitors the health of individual cloud resources deployed in your subscription and alerts you to any issues affecting those resources. Resource Health works hand-in-hand with Azure Monitor to provide alerts that are critical to the health of your resources.
This chapter reviews each of these tools in more detail.
Azure Status
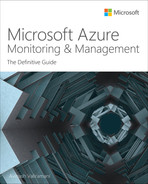
As mentioned, Azure Status (see Figure 8-1) monitors the overall service health across all Azure regions and provides updates on service-level issues in all regions. It is an unauthenticated service that provides status publicly for everyone at https://status.azure.com.
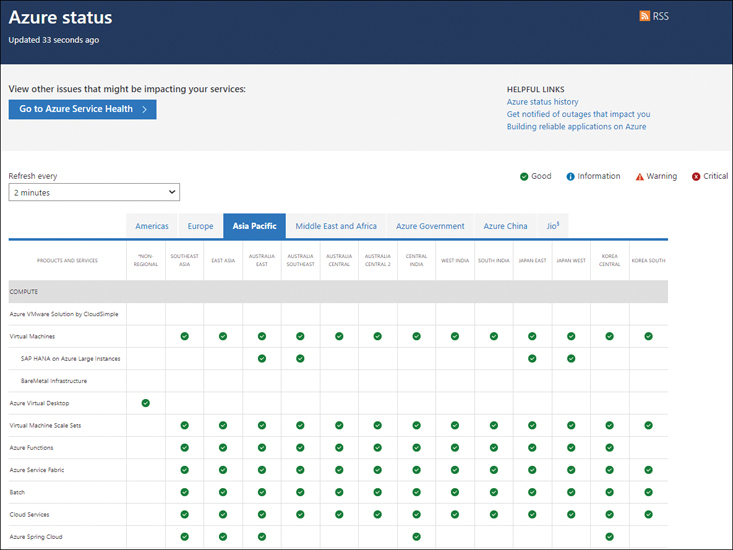
FIGURE 8-1Azure Status page.
The only configuration options for the Azure Status page are as follows:
Refresh Every drop-down listUse this drop-down list to change the refresh interval.
Region tabsClick the tab for the region that is relevant to your environment to view region-specific details.
Azure Status HistoryObtain a historical view of outages.
The Azure Status History page (see Figure 8-2) keeps a record of all incidents that have occurred in the last five years, by default (starting November 20, 2019). You can filter this information by service, region, and date range to view only those incidents relevant to your needs.
Because Azure Status provides a high-level view of major outages or planned activities affecting services in all regions, it is difficult to use it to identify issues with specific resources or workloads in your environment. Service Health and Resource Health are better tools to address those scenarios.

FIGURE 8-2Azure Status History page.
Service Health
Service Health is a free dashboard provided in Azure that tracks the health status of your Azure services and the regions in which they have been deployed. This tool tracks various service events that indicate a change in the health status of your Azure services. These events include the following:
Planned maintenance activitiesThese are maintenance activities planned for the services you are using in the regions in which they are deployed.
Service issuesThese are ongoing health issues for services that you are using in the regions in which they are deployed that could have an impact on your environment.
Security advisoriesThese are advisories related to security violations or ongoing security issues that might affect your services.
Health advisoriesThese are advisories related to the deprecation of service features or to features or services that require upgrade for continued support.
Service Health saves records of these events for 90 days. You can set up alerts to monitor issues for action from your end on an immediate basis.
Figure 8-3 and Figure 8-4 show the Service Health history for two different Azure subscriptions. As you can see, by default, Health History filters the view to only those regions in which the subscription has resources hosted. A few events that took place on a global level can be seen across both views. However, certain events that occurred in the Central US region are visible only in one image.

FIGURE 8-3Service Health history for the Pay-As-You-Go subscription.
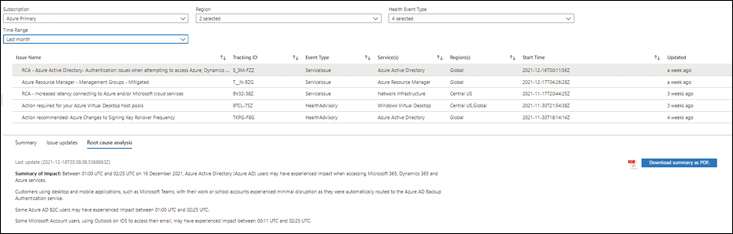
FIGURE 8-4Service Health history for the Azure Primary subscription.
Service Health walkthrough
The following section walks you through the process of viewing events on the Server Health dashboard and setting up alerts for continuous monitoring using the Azure Portal.
Using The Azure Portal
Log in to the Azure Portal, type service health in the search box, and select it from the list that appears. (See Figure 8-5.)

FIGURE 8-5Search for Service Health.
The left pane of the Service Health window, under the Active Events section, contains a list of event types to choose from. By default, the Service Issues event type is selected in the left pane, and a default subscription, region, and service will be selected in the right pane, depending on your environment. (See Figure 8-6.)

FIGURE 8-6The Service Issues option is selected under Active Events in the left pane, and the default subscription, region, and service are selected in the right pane.
To view service issues in a specific subscription or region, or to choose a specific service, select the desired options from the Subscription, Region, and Service drop-down lists. (See Figure 8-7.)
FIGURE 8-7Customizing the Service Health options.
NoteYou can perform the same tasks described in the previous steps in the other Active Event pages, including the Service Issue page, the Planned Maintenance page, the Health Advisories page, and the Security Advisories page.
Now let’s set up a new Service Health alert so you can be notified of any issues with specific services in specific Azure regions. This involves creating an alert rule.
Click the Create Service Health Alert button.
In the Create an Alert Rule dialog box (see Figure 8-8), enter the following information:
SubscriptionSelect the subscription that hosts the services for which you want to create an alert.
Service(s)Choose the service(s) for which you want to create an alert.
Region(s)Choose the region(s) for which you want to create an alert.
Event TypeSelect the event type(s) for which you want to create an alert.
ActionsSelect the Add Action Groups option. This will allow you to define an action, such as sending notifications via email, SMS, or voice call; the associated recipients; or triggering automated actions.

FIGURE 8-8The Create an Alert Rule dialog box.
In the Basics tab of the Create an Action Group wizard (see Figure 8-9), enter the following information. Then click Next:
SubscriptionSelect the subscription in which you want to create the action group.
Resource GroupSelect the resource group in which you want to create the action group. Alternatively, click the Create New link and follow the prompts to create a new resource group.
Action Group NameEnter a unique name for the action group.
Display NameEnter a unique display name for the action group. This name is limited to 12 characters.

FIGURE 8-9The Basics tab of the Create an Action Group wizard.
In the Notifications tab (see Figure 8-10), enter the following information:
Notification TypeSelect Email/SMS Message/Push/Voice.
NameEnter a unique name for the notification.

FIGURE 8-10The Notifications tab of the Create an Action Group wizard.
In the Email/SMS Message/Push/Voice pop-up box that opens on the right (see Figure 8-11), enter the following information (if applicable to your environment). Then click OK:
EmailSelect this check box and enter the address to which Service Health alerts should be sent via email.
SMSSelect this check box and enter the country code and phone number to which Service Health alerts should be sent via SMS message.
Azure App Push NotificationsSelect this check box and enter the Azure account email address to which Service Health alerts should be sent via the Azure app.
VoiceSelect this check box and enter the country code and phone number to which Service Health alerts should be sent via voice call.
Enable the Common Alert SchemaLeave this option set to No.
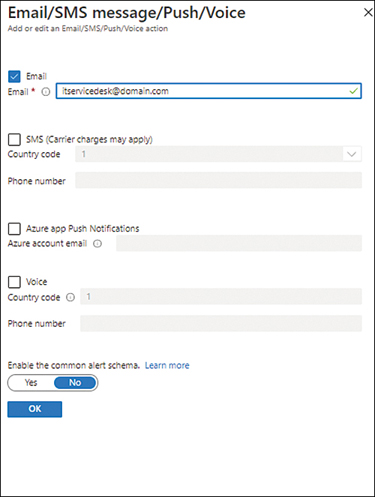
FIGURE 8-11Configure the action.
Back in the Notifications tab, check your settings. Then click Next.
In the Actions tab, optionally open the Action Type drop-down list (see Figure 8-12) and choose any additional actions you want to take (in addition to notifications). Then type a name for the action in the Name box and click Next. (In this example, I have not set additional actions.)

FIGURE 8-12The Actions tab of the Create an Action Group wizard.
In the Tags tab (see Figure 8-13), enter any tags you want to associate with the action group and click Review + Create.

FIGURE 8-13The Tags tab of the Create an Action Group wizard.
In the Review + Create tab (see Figure 8-14), check your settings. Then click Review + Create to create the action group.

FIGURE 8-14The Review + Create tab of the Create an Action Group wizard.
Back in the Create an Alert Rule dialog box (see Figure 8-15), enter the following information. Then click Create Rule:
Alert Rule NameEnter a unique name for the alert rule.
DescriptionEnter a description of the alert rule for easy reference for other admins.
Resource GroupSelect the resource group in which to create the alert rule.
Enable Alert Rule Upon CreationLeave this check box selected.

FIGURE 8-15Finishing the alert rule.
To view the rule, click the Health Alerts option in the left pane of the Service Health window, under Alerts. (See Figure 8-16.)

FIGURE 8-16The Health Alerts page.
Click Service Issues, Planned Maintenance, Health Advisories, or Service Advisories (depending on what type of alert it is) in the left pane to view more details about health alerts that are ongoing in the right pane. Figure 8-17 shows the Service Issues page.
TipYou can view closed health alerts by clicking Health History in the left pane.
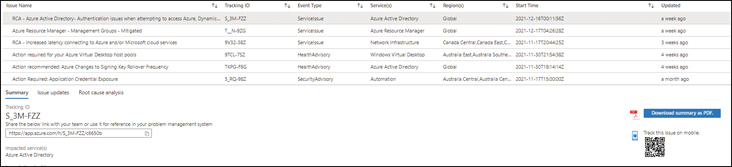
FIGURE 8-17See more details about a specific alert.
Optionally, click the Download Summary as PDF button to download event details, including root cause explanations published by Microsoft.
Resource Health
Resource Health enables you to closely monitor the health of resources deployed in your Azure environment. You can set up alerts in Resource Health to allow you to take action when issues arise. This can also help you diagnose the root cause of the issue. Resource Health is available free of charge for all Azure customers.
Resource Health interprets various signals from different Azure services to determine if a resource is healthy or not. If a resource is deemed unhealthy, the service collects additional information to determine the source of the problem. For example, if a virtual machine (VM) is deemed to be unhealthy, the service performs the following checks are performed:
Is the server hosting this VM up and running?
Has the host OS completed booting?
Is the VM container provisioned and powered up?
Is there network connectivity between the host and the storage account?
Has the guest OS completed booting?
Is there ongoing planned maintenance?
Is the host hardware degraded and predicted to fail soon?
If, on the other hand, a website is deemed as unhealthy, the following checks are performed:
Is the host server up and running?
Is the Internet Information Server running?
Is the load balancer running?
Can the web app be reached from within the datacenter?
Is the storage account hosting the site content available?
As you can see, the checks are very different in each case, and depend on the service features and capabilities. Resource Health performs these checks on the individual resource instance that is deemed to be unhealthy, so it is critical to monitor Resource Health alerts and actions, as they will reveal issues in your environment.
You can set up personalized dashboards that show the health of your resources. The health data captured by Resource Health is maintained for historical reference and comparison for a period of 30 days. Additionally, in the case of VM workloads, as and when a health issue is resolved, root cause analysis information is published regarding the VM resource within 72 hours.
Health status indicators
Resource Health displays various health status indicators. Possible status values are as follows:
AvailableThe resource is working as expected, and there have been no ongoing issues in the last 24 hours. If an issue was resolved in the last 24 hours, the service will indicate this, too.
UnavailableAn issue has been detected that is affecting the health of the resource. This could be a platform issue or a non-platform issue. A platform issue is an issue with the Azure infrastructure, such as a service outage, planned maintenance, or unplanned resource restarts or host restarts. Non-platform issues include issues triggered by user actions, such as a resource restart or shutdown.
UnknownThe health of the resource could not be determined for the last 10 minutes. This might be because the resource did not broadcast any health information because it is offline, or it could be due to an underlying service issue.
DegradedThe service is detecting some ongoing issue that is affecting the performance of the resource. Depending on the type of resource, the reasons behind a degraded status are different. For example, a storage account might indicate a degraded status if the underlying hardware is detecting corruption, whereas a traffic manager service might indicate a degraded status if some of the regions that provide the service are offline.
Based on the health status indicator, Resource Health will provide you with a set of recommendations and next steps to help you troubleshoot the issue as quickly as possible to reduce downtime. These recommendations are based on a historical analysis of common solutions for similar events across all Azure customers.
Create a Resource Health alert walkthrough
The following section walks you through the process of setting up a Resource Health alert rule using the Azure Portal.
Using The Azure Portal
To use Resource Health to monitor the health of your system and to set up an alert in the Azure Portal, follow these steps:
Log in to the Azure Portal, type service health in the search box, and select it from the list that appears. (See Figure 8-18.)
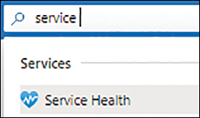
FIGURE 8-18Service Health service search.
In the left pane of the Service Health window, under Resource Health, click the Resource Health option. (See Figure 8-19.)

FIGURE 8-19Service issues.
On the Resource Health page, click the Add Resource Health Alert button. (See Figure 8-20.)
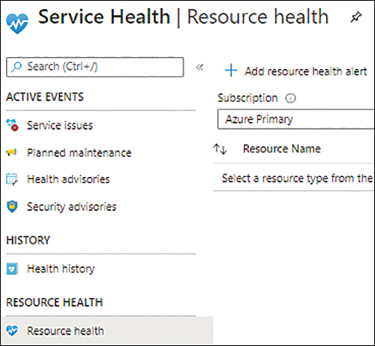
FIGURE 8-20Click the Add Resource Health Alert button.
In the Create Resource Health Alert Rule dialog box (see Figure 8-21), enter the following information:
SubscriptionSelect the subscription that hosts the services for which you want to create an alert.
Resource TypeSelect the specific resource type(s) for which you want to create an alert or choose Select All.
Resource GroupSelect the resource group(s) that contain the resource(s) for which you want to create an alert or choose Select All.
Include All Future Resource GroupsLeave this check box selected to automatically apply the new alert rule to all resource groups created in the future.
ResourceSelect the resource(s) (such as the specific VMs) for which you want to create an alert or choose Select All.
Include All Future ResourcesLeave this check box selected to automatically apply the new alert rule to all resources created in the future.
Event StatusSelect the event status you want to monitor or choose Select All.
Current Resource StatusSelect the Resource Health status indicators for which you want to receive alerts based on their current status in Azure or choose Select All.
Previous Resource StatusSelect the Resource Health status indicators for which you want to receive alerts based on their previous status or choose Select All.
Reason TypeSelect the reasons to generate the alert or choose Select All.
ActionsClick the Add Action Groups link.
In the Add Action Groups pop-up window, do one of the following:
Click Create Action Groupand follow steps 9−15 in the “Service Health walkthrough” section earlier in the chapter.
Select the existing action group(s) with which you want to associate the rule. (See Figure 8-22.)
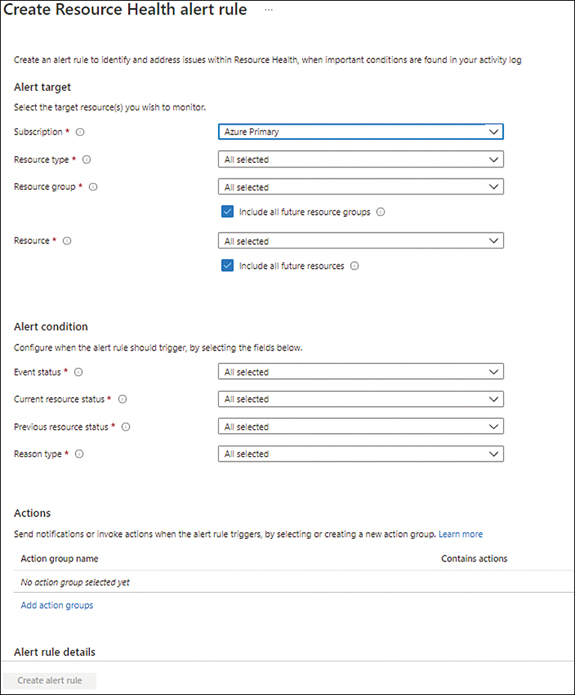
FIGURE 8-21The Create a Resource Health Alert Rule dialog box.
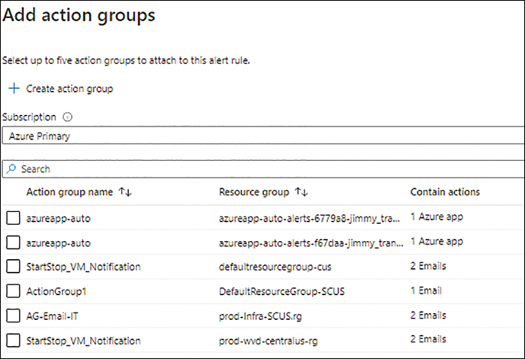
FIGURE 8-22Add action group.
Back in the Create Resource Health Alert Ruledialog box, under Alert Rule Details (see Figure 8-23), enter the following information. Then click the Create Alert Rule button:
Alert Rule NameEnter a unique name for the alert rule.
DescriptionEnter a description of the alert rule for easy reference for other admins.
Resource GroupSelect the resource group in which to create the alert rule.
Enable Alert Rule Upon CreationLeave this check box selected.

FIGURE 8-23Finishing the Resource Health alert rule.
To view all the alerts set up for your subscription, type monitor service in the search box and select it from the list that appears.
In the left pane of the Monitor page, click Alerts. (See Figure 8-24.)
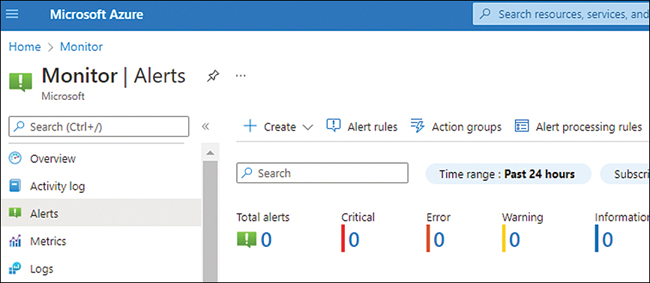
FIGURE 8-24Select Alerts in Azure Monitor.
Click the Alert Rules button.
On the Alert Rules page, view all rules that have been set up, or type a rule name in the search bar on the left to locate a particular rule. Figure 8-25 shows a search for the Resource Health alert rule.
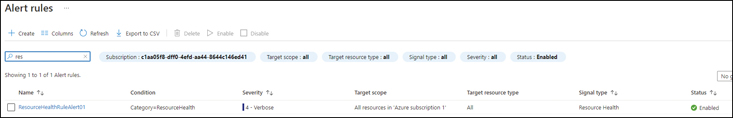
FIGURE 8-25Search for the Resource Health alert rule.
Check a resource’s health walkthrough
The following section walks you through the process of viewing the health of a particular resource using the Azure Portal.
Using The Azure Portal
To check the health of a particular resource using the Azure Portal, follow these steps:
In the Azure Portal, browse to the resource whose health status you want to check.
In the left pane of the resource’s page in the Azure Portal, under Support + Troubleshooting, click the Resource Health option. (See Figure 8-26.)

FIGURE 8-26Check the health of a particular resource.
The right pane displays current and past health status details for the resource in question, such as whether it’s available, and if not, why not. (See Figures 8-27 and 8-28.)

FIGURE 8-27Detailed Resource Health status information for an available resource.

FIGURE 8-28Resource Health status information for a resource that is unavailable.
Best practices
Following are some general best practices for the Service Health and Resource Health tools:
Set up Service Health alerts for regular monitoringIt is highly recommended that you set up Service Health alerts for all services you use in all active Azure regions to proactively identify any ongoing service issues and address them if possible. Some Service Health issues might not be addressable; still, being aware of them can help with internal user communications, planning future service redundancy options, or failing over the service if such options are already in place.
Set up Resource Health alerts for critical resourcesIt is highly recommended that you set up Resource Health alerts for all resources—or at the very least, those resources that are most critical to your organization—to proactively identify and address any ongoing issues. These alerts should be sent to a mailbox that is monitored 24/7.
Set up custom dashboardsSet up dashboards to monitor the health of the various services and resources on a continuous basis to ensure they are online as per your SLA requirements.
Setup automated actionsif possible Setup automated actions to trigger workflows or runbooks to fix health issues or to enlist resources in the same or other regions to take over the load of any resources experiencing issues.